Commodities
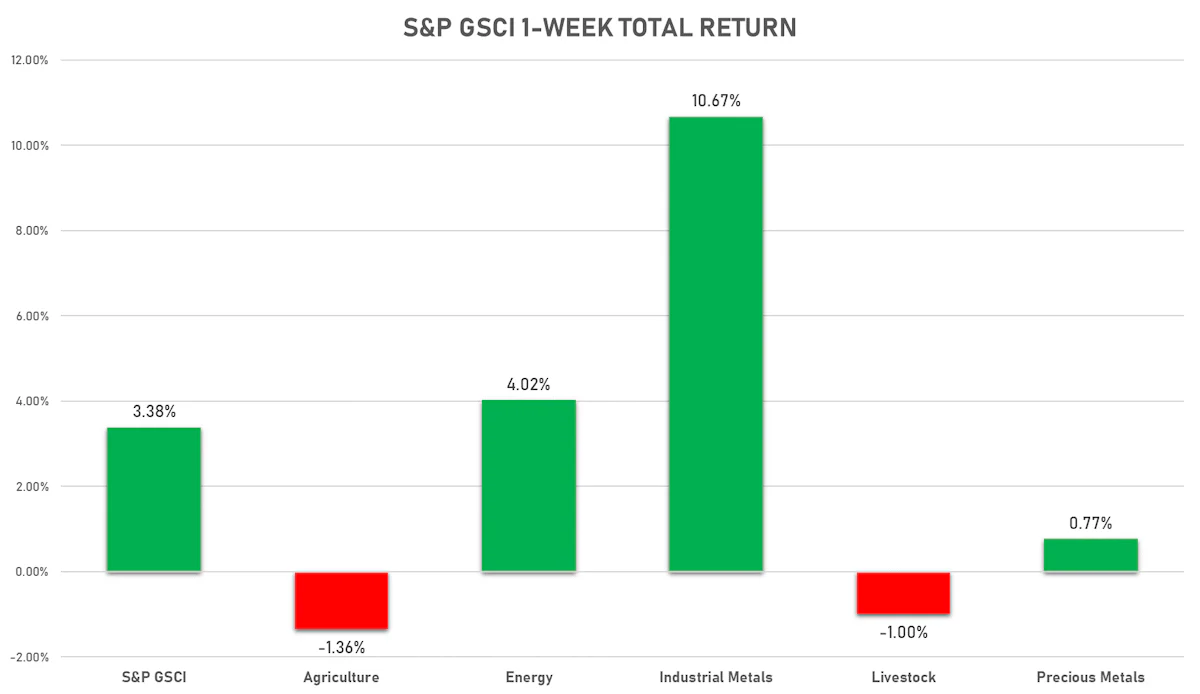
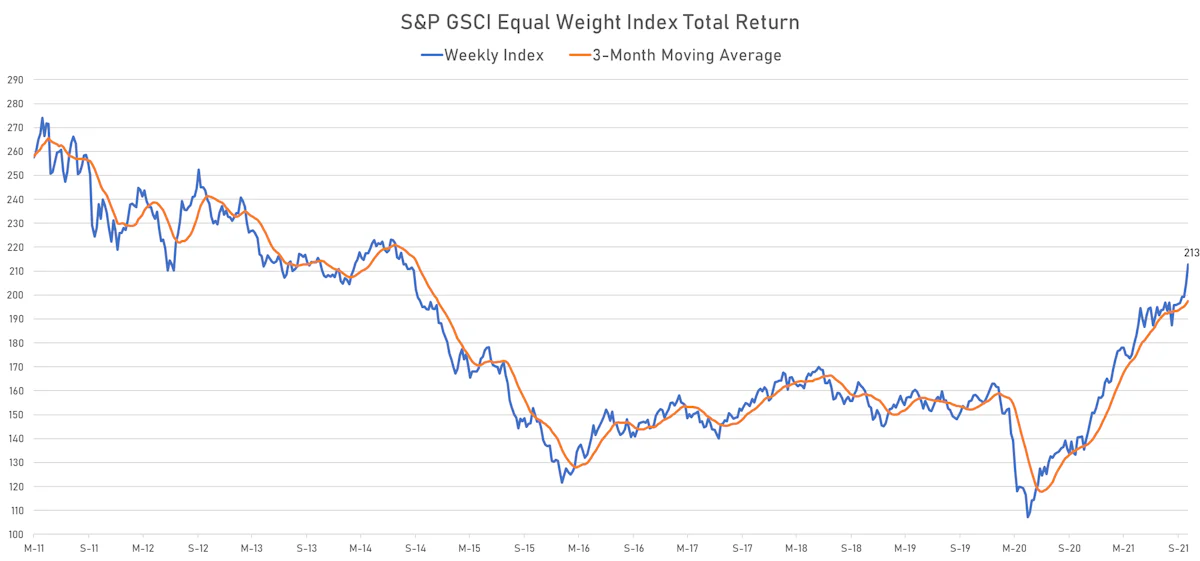
Broad Commodities Strength This Week, Led By Base Metals And Energy
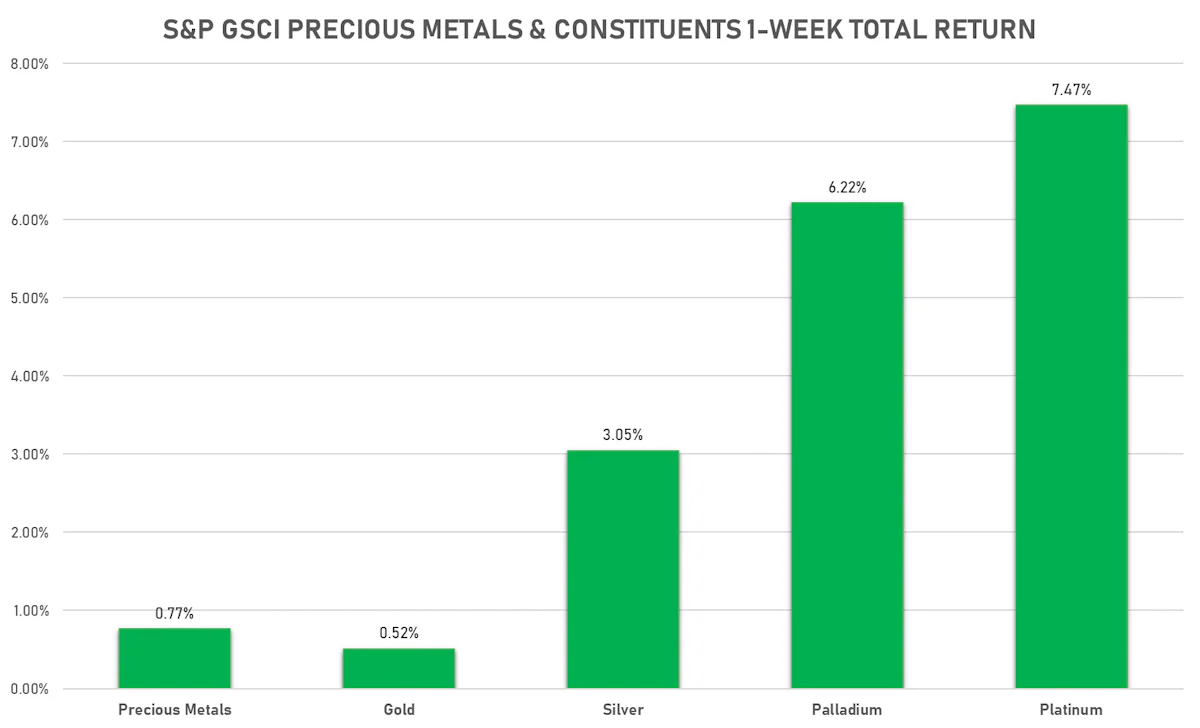
Industrial metals, including platinum-group elements, had a glorious week on the back of inflationary pressures as well as positive sentiment about industrial production, with monthly data to be released ahead of Monday's open
Published ET
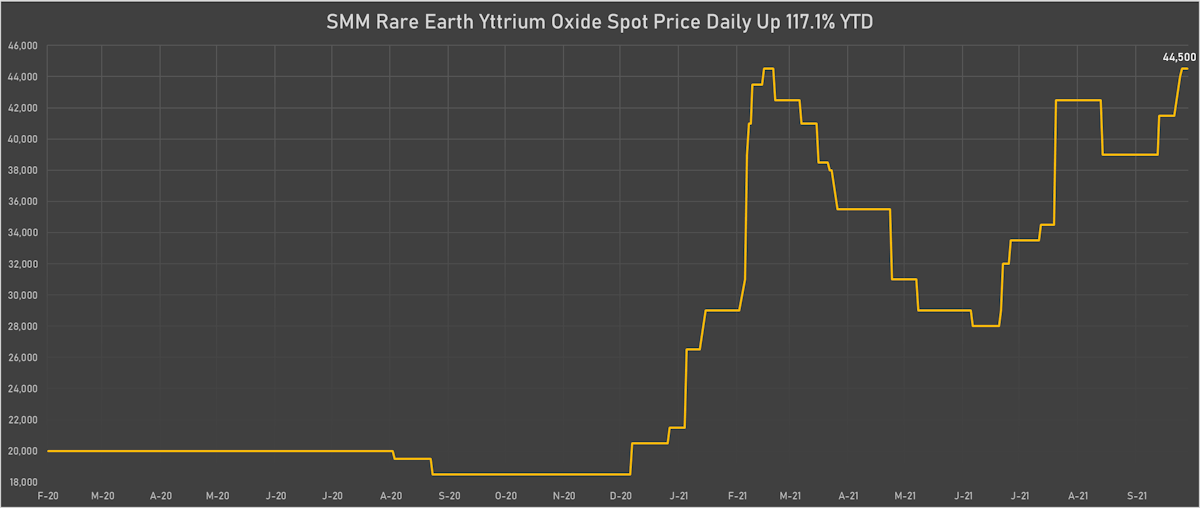
Yttrium Oxide (Rare Earth) Daily Prices | Sources: ϕpost chart, Refinitiv data
NOTABLE GAINERS THIS WEEK
- Zhengzhou Exchange Thermal Coal up 37.7% (YTD: 153.4%)
- SMM Erbium Oxide Spot Price Daily up 21.7% (YTD: 54.2%)
- Baltic Clean Tank Index up 16.3% (YTD: 42.9%)
- SHFE Zinc up 12.1% (YTD: 22.8%)
- COMEX Copper up 10.5% (YTD: 34.7%)
- SMM Lithium Metal Spot Price Daily up 8.1% (YTD: 92.8%)
- SMM Rare Earth Yttrium Oxide Spot Price Daily up 7.2% (YTD: 117.1%)
- SMM Rare Earth Gadolinium Oxide Spot Price Daily up 6.9% (YTD: 56.7%)
- Baltic Exchange BALTIC DIRTY TNK up 6.8% (YTD: 55.8%)
- DCE Coking Coal Continuation Month 1 up 6.5% (YTD: 165.9%)
- SHFE Copper up 6.3% (YTD: 27.6%)
- SMM Rare Earth Yttrium Metal Spot Price Daily up 6.3% (YTD: 24.4%)
- SHFE Rubber up 5.6% (YTD: 3.4%)
- CME Random Length Lumber up 5.4% (YTD: -13.0%)
- SHFE Lead Continuation Month 1 up 5.2% (YTD: 4.0%)
NOTABLE LOSERS THIS WEEK
- Baltic Exchange Capesize Index down -23.2% (YTD: 287.2%)
- CME Lean Hogs down -13.3% (YTD: 11.4%)
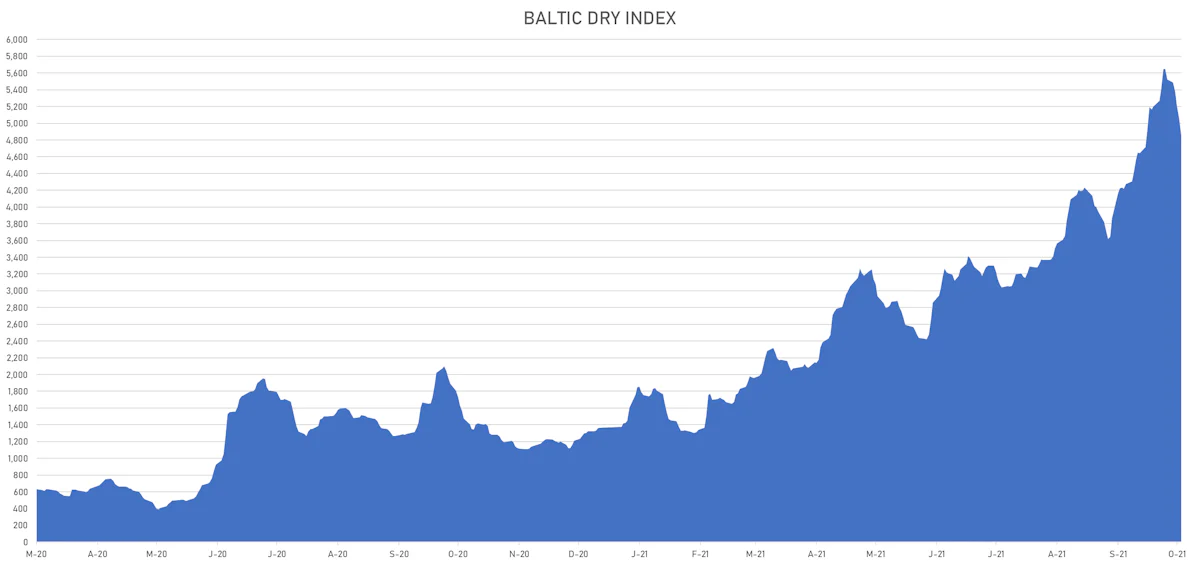
- Baltic Dry down -12.2% (YTD: 255.3%)
- Johnson Matthey Iridium New York 0930 down -6.1% (YTD: 76.9%)
- ICE-US Cocoa down -5.2% (YTD: 0.2%)
- SHFE Rebar down -4.0% (YTD: 34.8%)
- DCE Coke down -3.8% (YTD: 32.4%)
- DCE RBD Palm Oil down -3.3% (YTD: 36.8%)
- SHFE Bitumen Continuation Month 1 down -3.1% (YTD: 22.8%)
- ICE-US Cotton No. 2 down -3.0% (YTD: 37.4%)
- NYMEX Henry Hub Natural Gas down -2.8% (YTD: 113.1%)
- ICE-US Sugar No. 11 down -2.4% (YTD: 27.8%)
- CBoT Soybeans down -2.0% (YTD: -7.4%)
- SHFE Hot Rolled Coil down -1.9% (YTD: 27.4%)
- Shanghai International Exchange Bonded Copper down -1.4% (YTD: 18.6%)
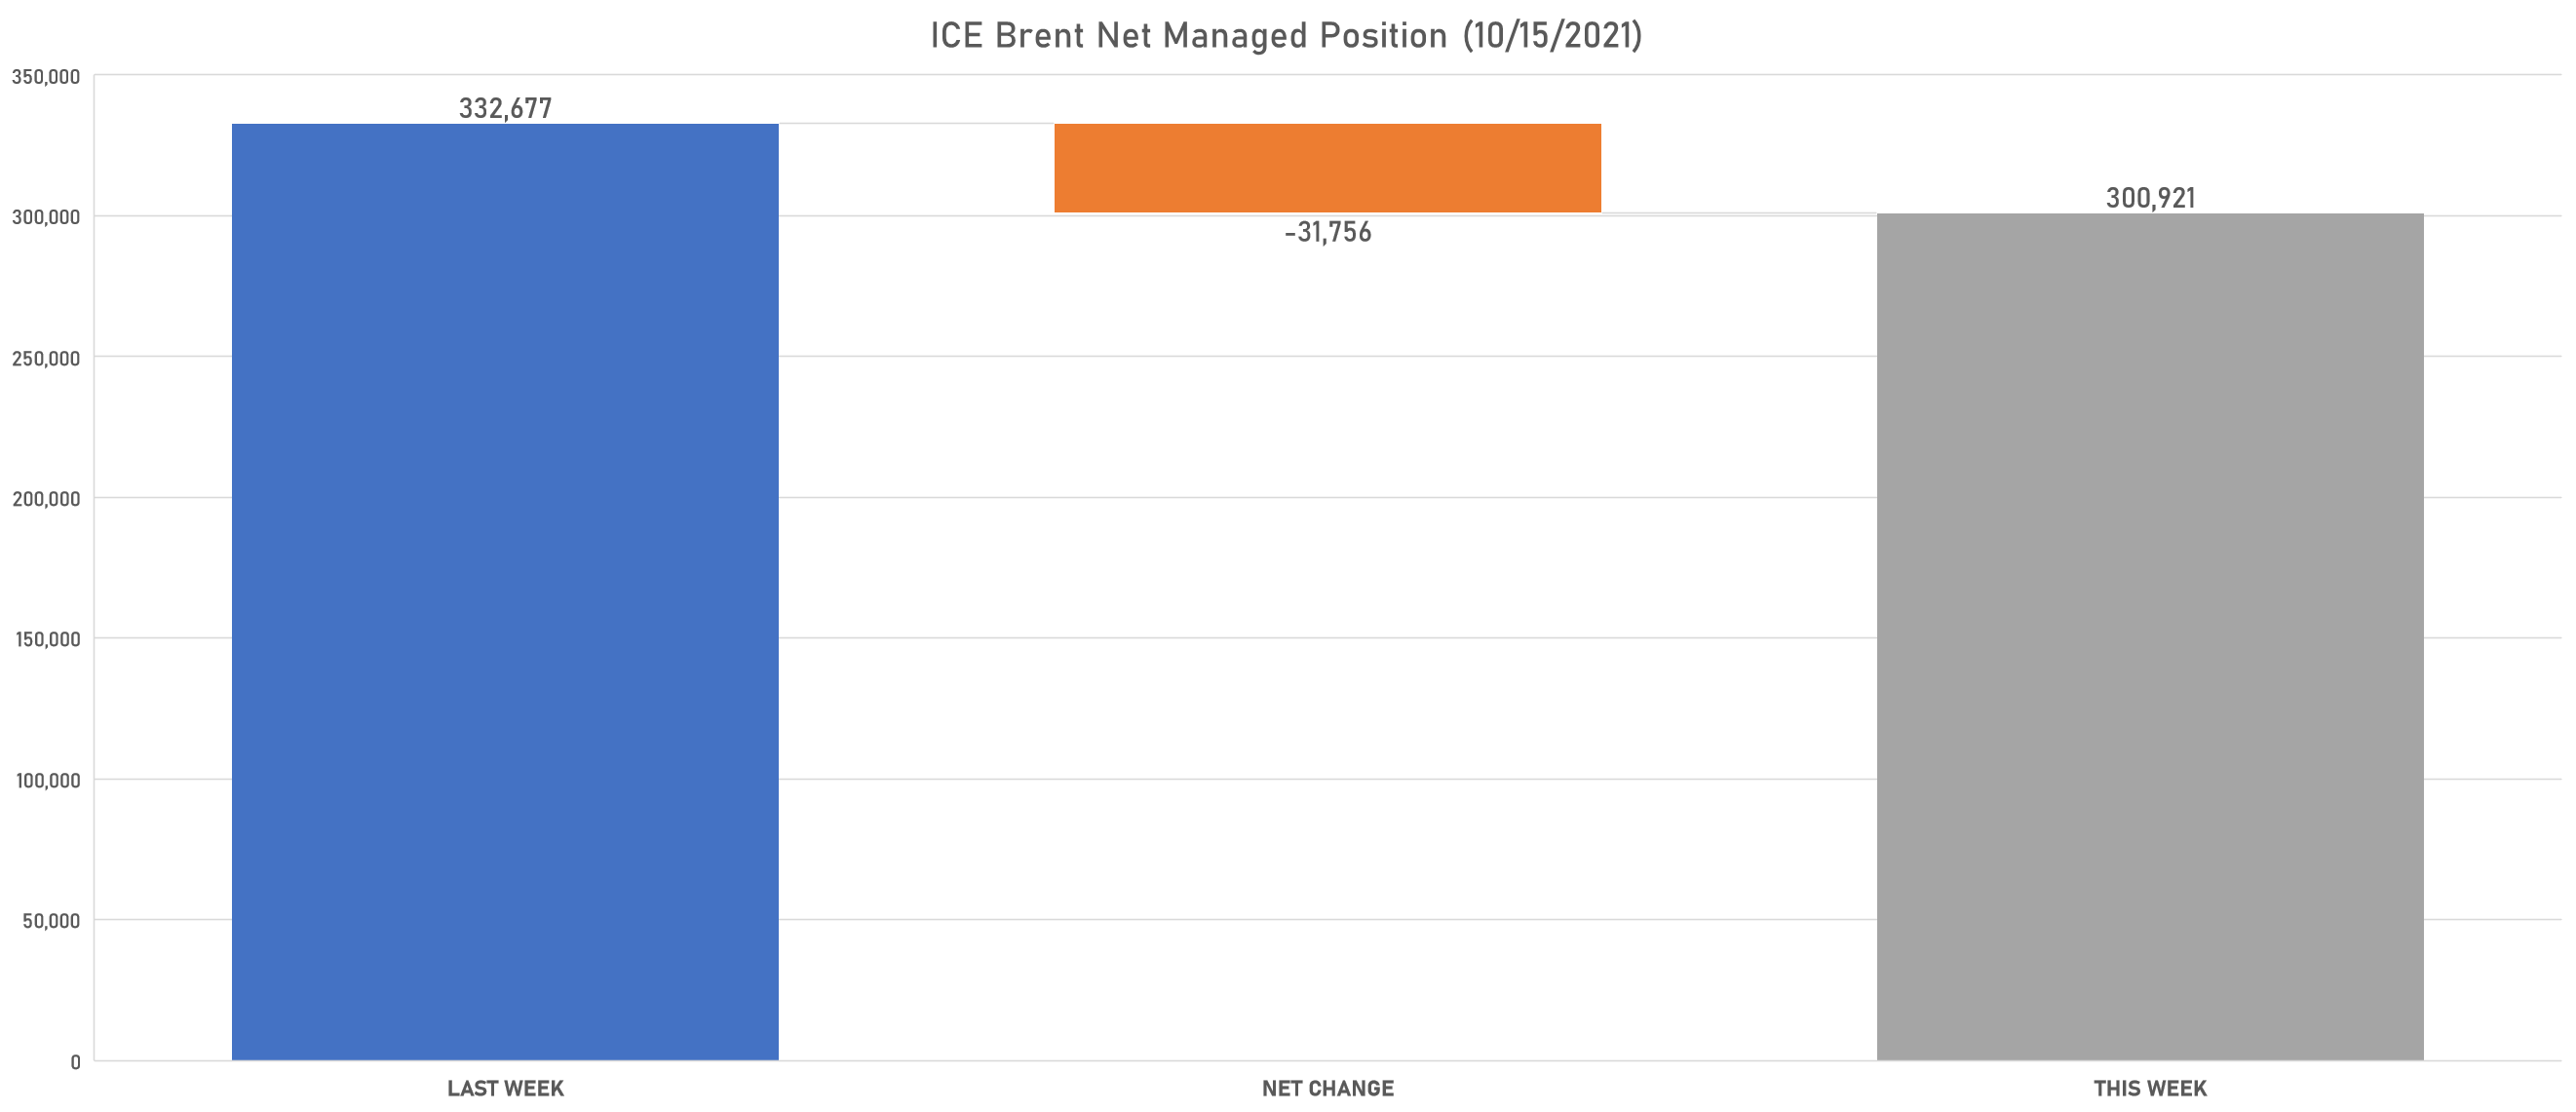
NET POSITIONS OF MANAGED MONEY (WEEKLY CFTC REPORT)
ENERGY
- Light Sweet Crude increased net long position
- Ice Brent reduced net long position
- Gasoline RBOB reduced net long position
- No.2 Heating Oil increased net long position
- Ice Gasoil reduced net long position
- Henry Hub Ice reduced net long position
METALS
- Gold increased net long position
- Silver increased net long position
- Platinum turned to net long
- Palladium reduced net short position
- Copper-Grade#1 increased net long position
AGRICULTURE
- Wheat turned to net short
- Corn reduced net long position
- Rough Rice increased net long position
- Oats reduced net long position
- Soybeans reduced net long position
- Soybean Oil reduced net long position
- Soybean Meal increased net short position
- Lean Hogs reduced net long position
- Live Cattle increased net long position
- Feeder Cattle reduced net short position
- Cocoa reduced net long position
- Coffee C increased net long position
- Robusta Coffee reduced net long position
- Frozen Orange Juice reduced net long position
- Sugar No.11 reduced net long position
- White Sugar increased net long position
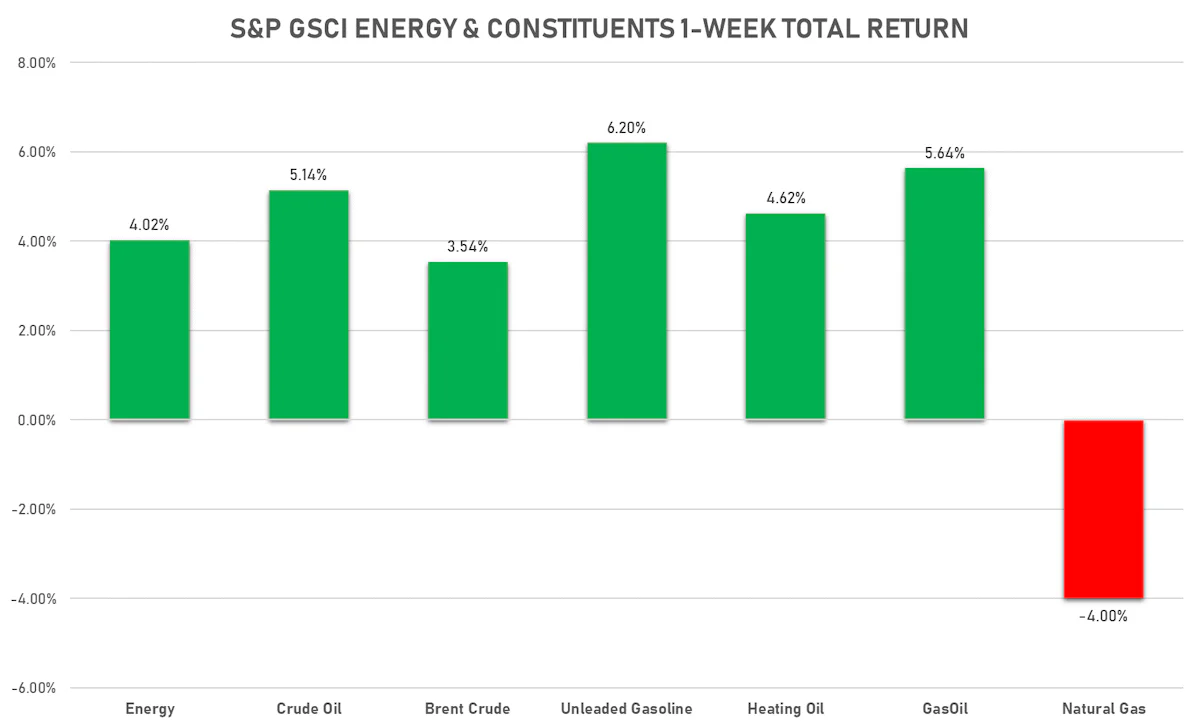
ENERGY THIS WEEK
- WTI crude front month currently at US$ 82.28 per barrel, up 3.7% (YTD: +69.6%); 6-month term structure in widening backwardation
- Brent crude front month currently at US$ 84.86 per barrel, up 3.0% (YTD: +63.8%); 6-month term structure in widening backwardation
- Newcastle Coal (ICE Europe) currently at US$ 240.00 per tonne, up 0.6% (YTD: +198.1%)
- Natural Gas (Henry Hub) currently at US$ 5.41 per MMBtu, down -2.8% (YTD: +113.1%)
- Gasoline (NYMEX) currently at US$ 2.49 per gallon, up 5.1% (YTD: +76.5%); 6-month term structure in widening backwardation
- Low Sulphur Gasoil (ICE Europe) currently at US$ 746.75 per tonne, up 4.2% (YTD: +77.5%)
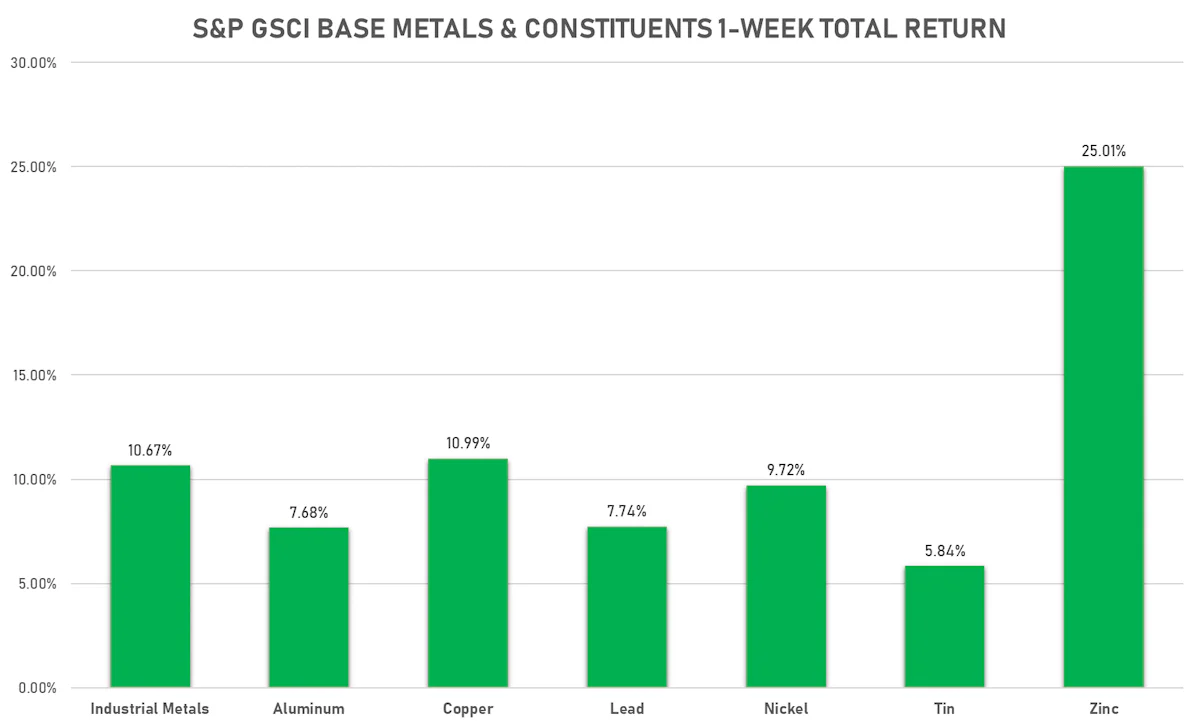
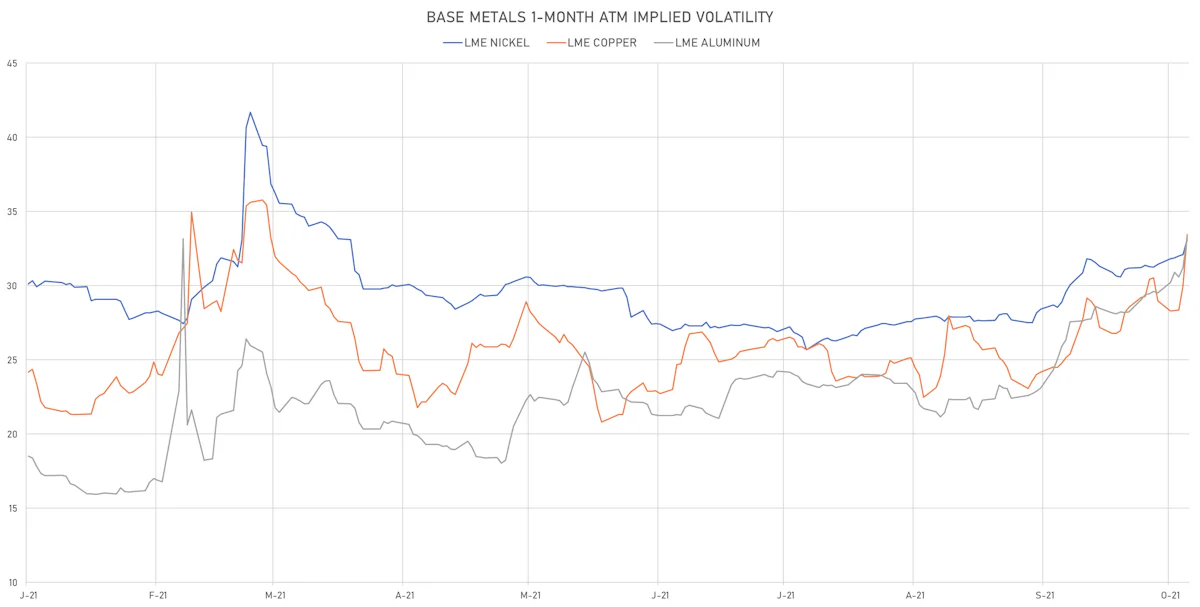
BASE METALS THIS WEEK
- Copper (COMEX) currently at US$ 4.71 per pound, up 10.5% (YTD: +34.7%)
- Iron Ore (Dalian Commodity Exchange) currently at CNY 748.00 per tonne, up 4.6% (YTD: -30.7%)
- Aluminium (Shanghai) currently at CNY 24,425 per tonne, up 3.4% (YTD: +50.9%)
- Nickel (Shanghai) currently at CNY 149,880 per tonne, up 2.5% (YTD: +18.5%)
- Lead (Shanghai) currently at CNY 15,475 per tonne, up 5.2% (YTD: +4.0%)
- Rebar (Shanghai) currently at CNY 5,572 per tonne, down -4.0% (YTD: +34.8%)
- Tin (Shanghai) currently at CNY 284,330 per tonne, up 2.0% (YTD: +89.1%)
- Zinc (Shanghai) currently at CNY 27,520 per tonne, up 12.1% (YTD: +22.8%)
- Refined Cobalt (Shanghai) spot price currently at CNY 395,000 per tonne, up 2.9% (YTD: +44.2%)
- Lithium (Shanghai) spot price currently at CNY 935,000 per tonne, up 8.1% (YTD: +92.8%)
PRECIOUS METALS THIS WEEK
- Gold spot currently at US$ 1,767.26 per troy ounce, up 0.6% (YTD: -6.9%)
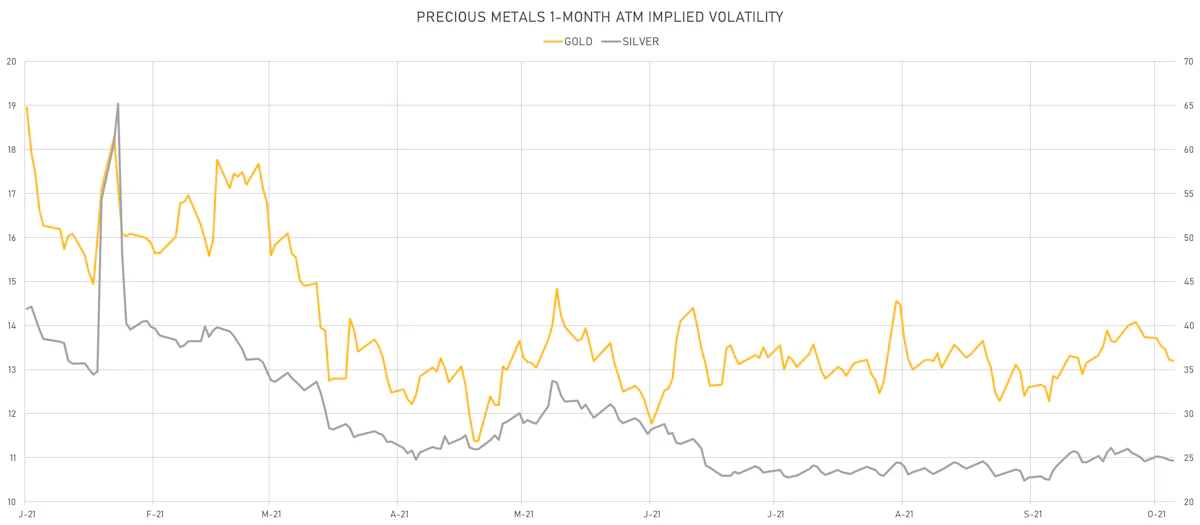
- Gold 1-Month ATM implied volatility currently at 12.80, down -3.9% (YTD: -18.0%)
- Silver spot currently at US$ 23.28 per troy ounce, up 2.8% (YTD: -11.7%)
- Silver 1-Month ATM implied volatility currently at 23.45, up 0.6% (YTD: -41.9%)
- Palladium spot currently at US$ 2,072.71 per troy ounce, down -0.3% (YTD: -15.2%)
- Platinum spot currently at US$ 1,054.50 per troy ounce, up 2.8% (YTD: -1.3%)
- Rhodium (Johnson Matthey, New York 09:30) currently at US$ 14,200 per troy ounce, down -0.7% (YTD: -16.7%)
- Iridium (Johnson Matthey, New York 09:30) currently at US$ 4,600 per troy ounce, down -6.1% (YTD: +76.9%)
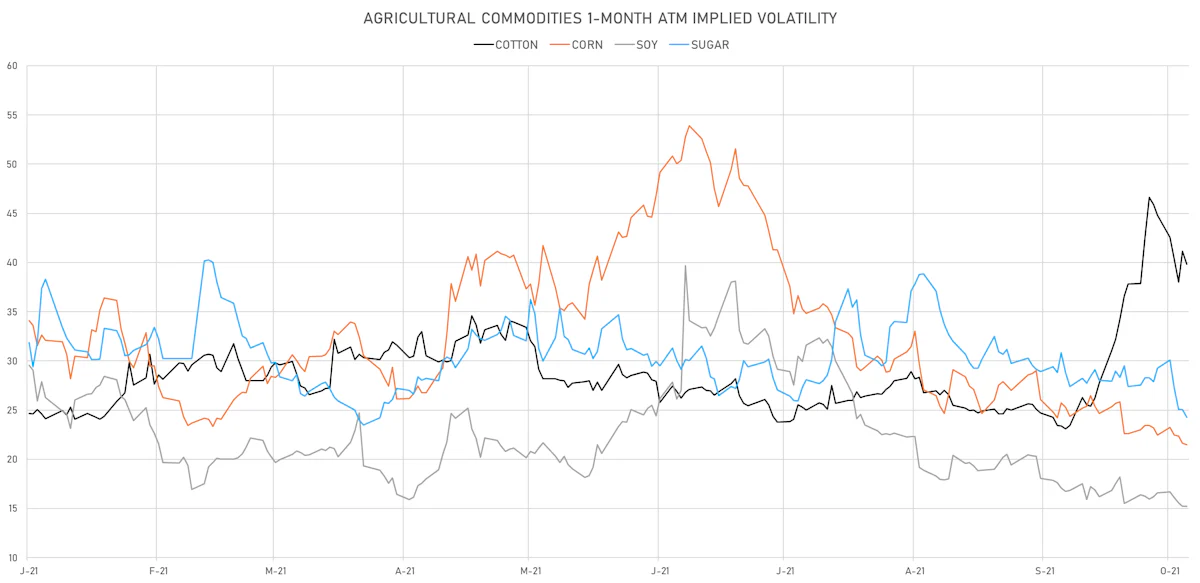
AGS THIS WEEK
- Live Cattle (CME) currently at US$ 125.98 cents per pound, up 0.3% (YTD: +11.5%)
- Lean Hogs (CME) currently at US$ 78.28 cents per pound, down -13.3% (YTD: +11.4%)
- Rough Rice (CBOT) currently at US$ 13.86 cents per hundredweight, up 0.9% (YTD: +11.7%)
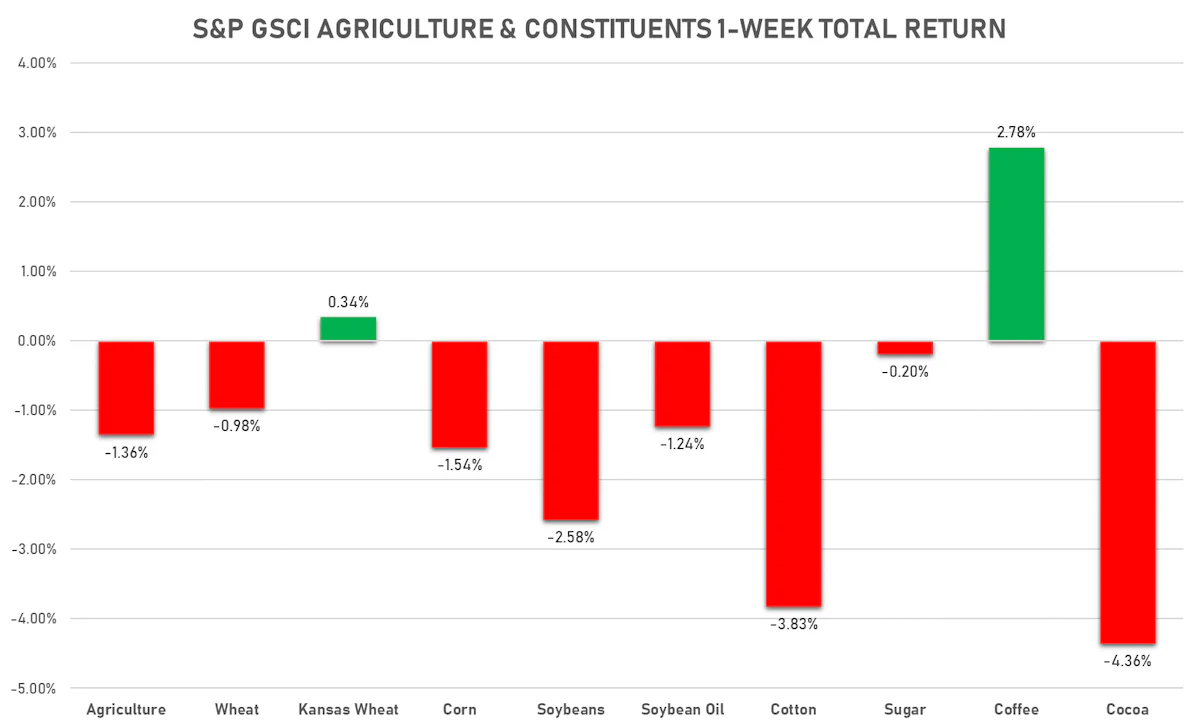
- Soybeans Composite (CBOT) currently at US$ 1,217.75 cents per bushel, down -2.0% (YTD: -7.4%)
- Corn (CBOT) currently at US$ 525.75 cents per bushel, down -0.9% (YTD: +8.6%)
- Wheat Composite (CBOT) currently at US$ 734.00 cents per bushel, down 0.0% (YTD: +14.6%)
- Sugar No.11 (ICE US) currently at US$ 19.77 cents per pound, down -2.4% (YTD: +27.8%)
- Cotton No.2 (ICE US) currently at US$ 107.03 cents per pound, down -3.0% (YTD: +37.4%)
- Cocoa (ICE US) currently at US$ 2,609 per tonne, down -5.2% (YTD: +0.2%)
- Coffee Arabica (Colombia Excelso) currently at EUR 5,001 per tonne, up 4.2% (YTD: +58.0%)
- Random Length Lumber (CME) currently at US$ 759.90 per 1,000 board feet, up 5.4% (YTD: -13.0%)
- TSR 20 Rubber (Shanghai) currently at CNY 11,560 per tonne, up 2.5% (YTD: +19.0%)
- Soybean Oil Composite (CBOT) currently at US$ 61.29 cents per pound, down -0.1% (YTD: +41.4%)
- Crude Palm Oil (Bursa Malaysia) currently at MYR 5,102 per tonne, up 0.2% (YTD: +32.6%)
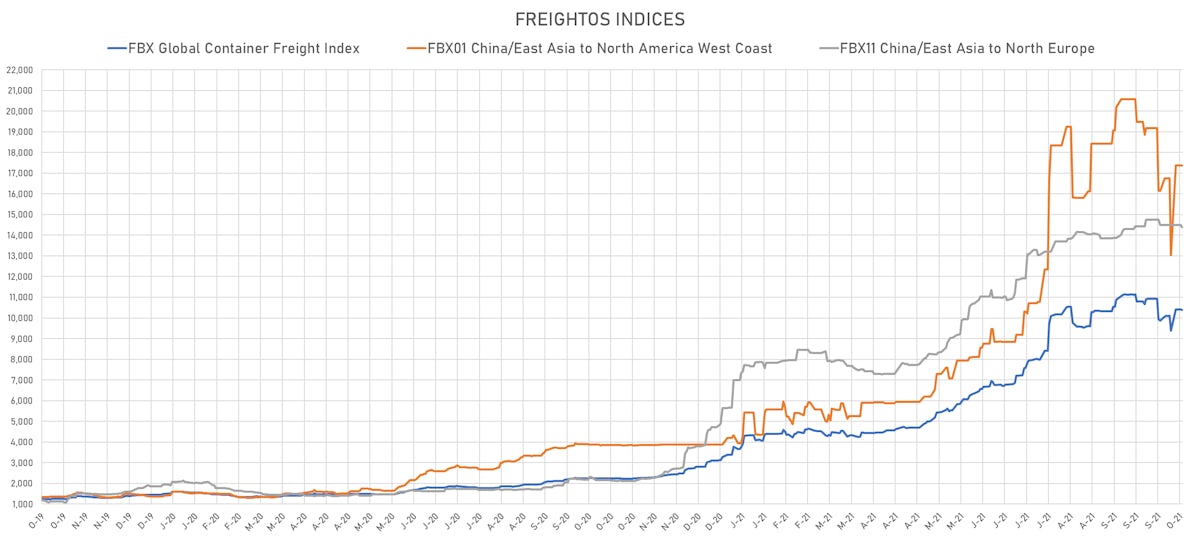
SHIPPING THIS WEEK
- Baltic Dry Index (Baltic Exchange) currently at 4,854, down -12.2% (YTD: +255.3%)
- Freightos China To North America West Coast Container Index currently at 17,377, up 33.4% (YTD: +313.8%)
- Freightos North America West Coast To China Container Index currently at 1,064, unchanged (YTD: +105.5%)
- Freightos North America East Coast To Europe Container Index currently at 472, unchanged (YTD: +30.1%)
- Freightos Europe To North America East Coast Container Index currently at 7,178, down -0.6% (YTD: +284.0%)
- Freightos China To North Europe Container Index currently at 14,376, down -0.8% (YTD: +153.9%)
- Freightos North Europe To China Container Index currently at 1,332, unchanged (YTD: -3.1%)
- Freightos Europe To South America West Coast Container Index currently at 5,558, unchanged (YTD: +228.5%)
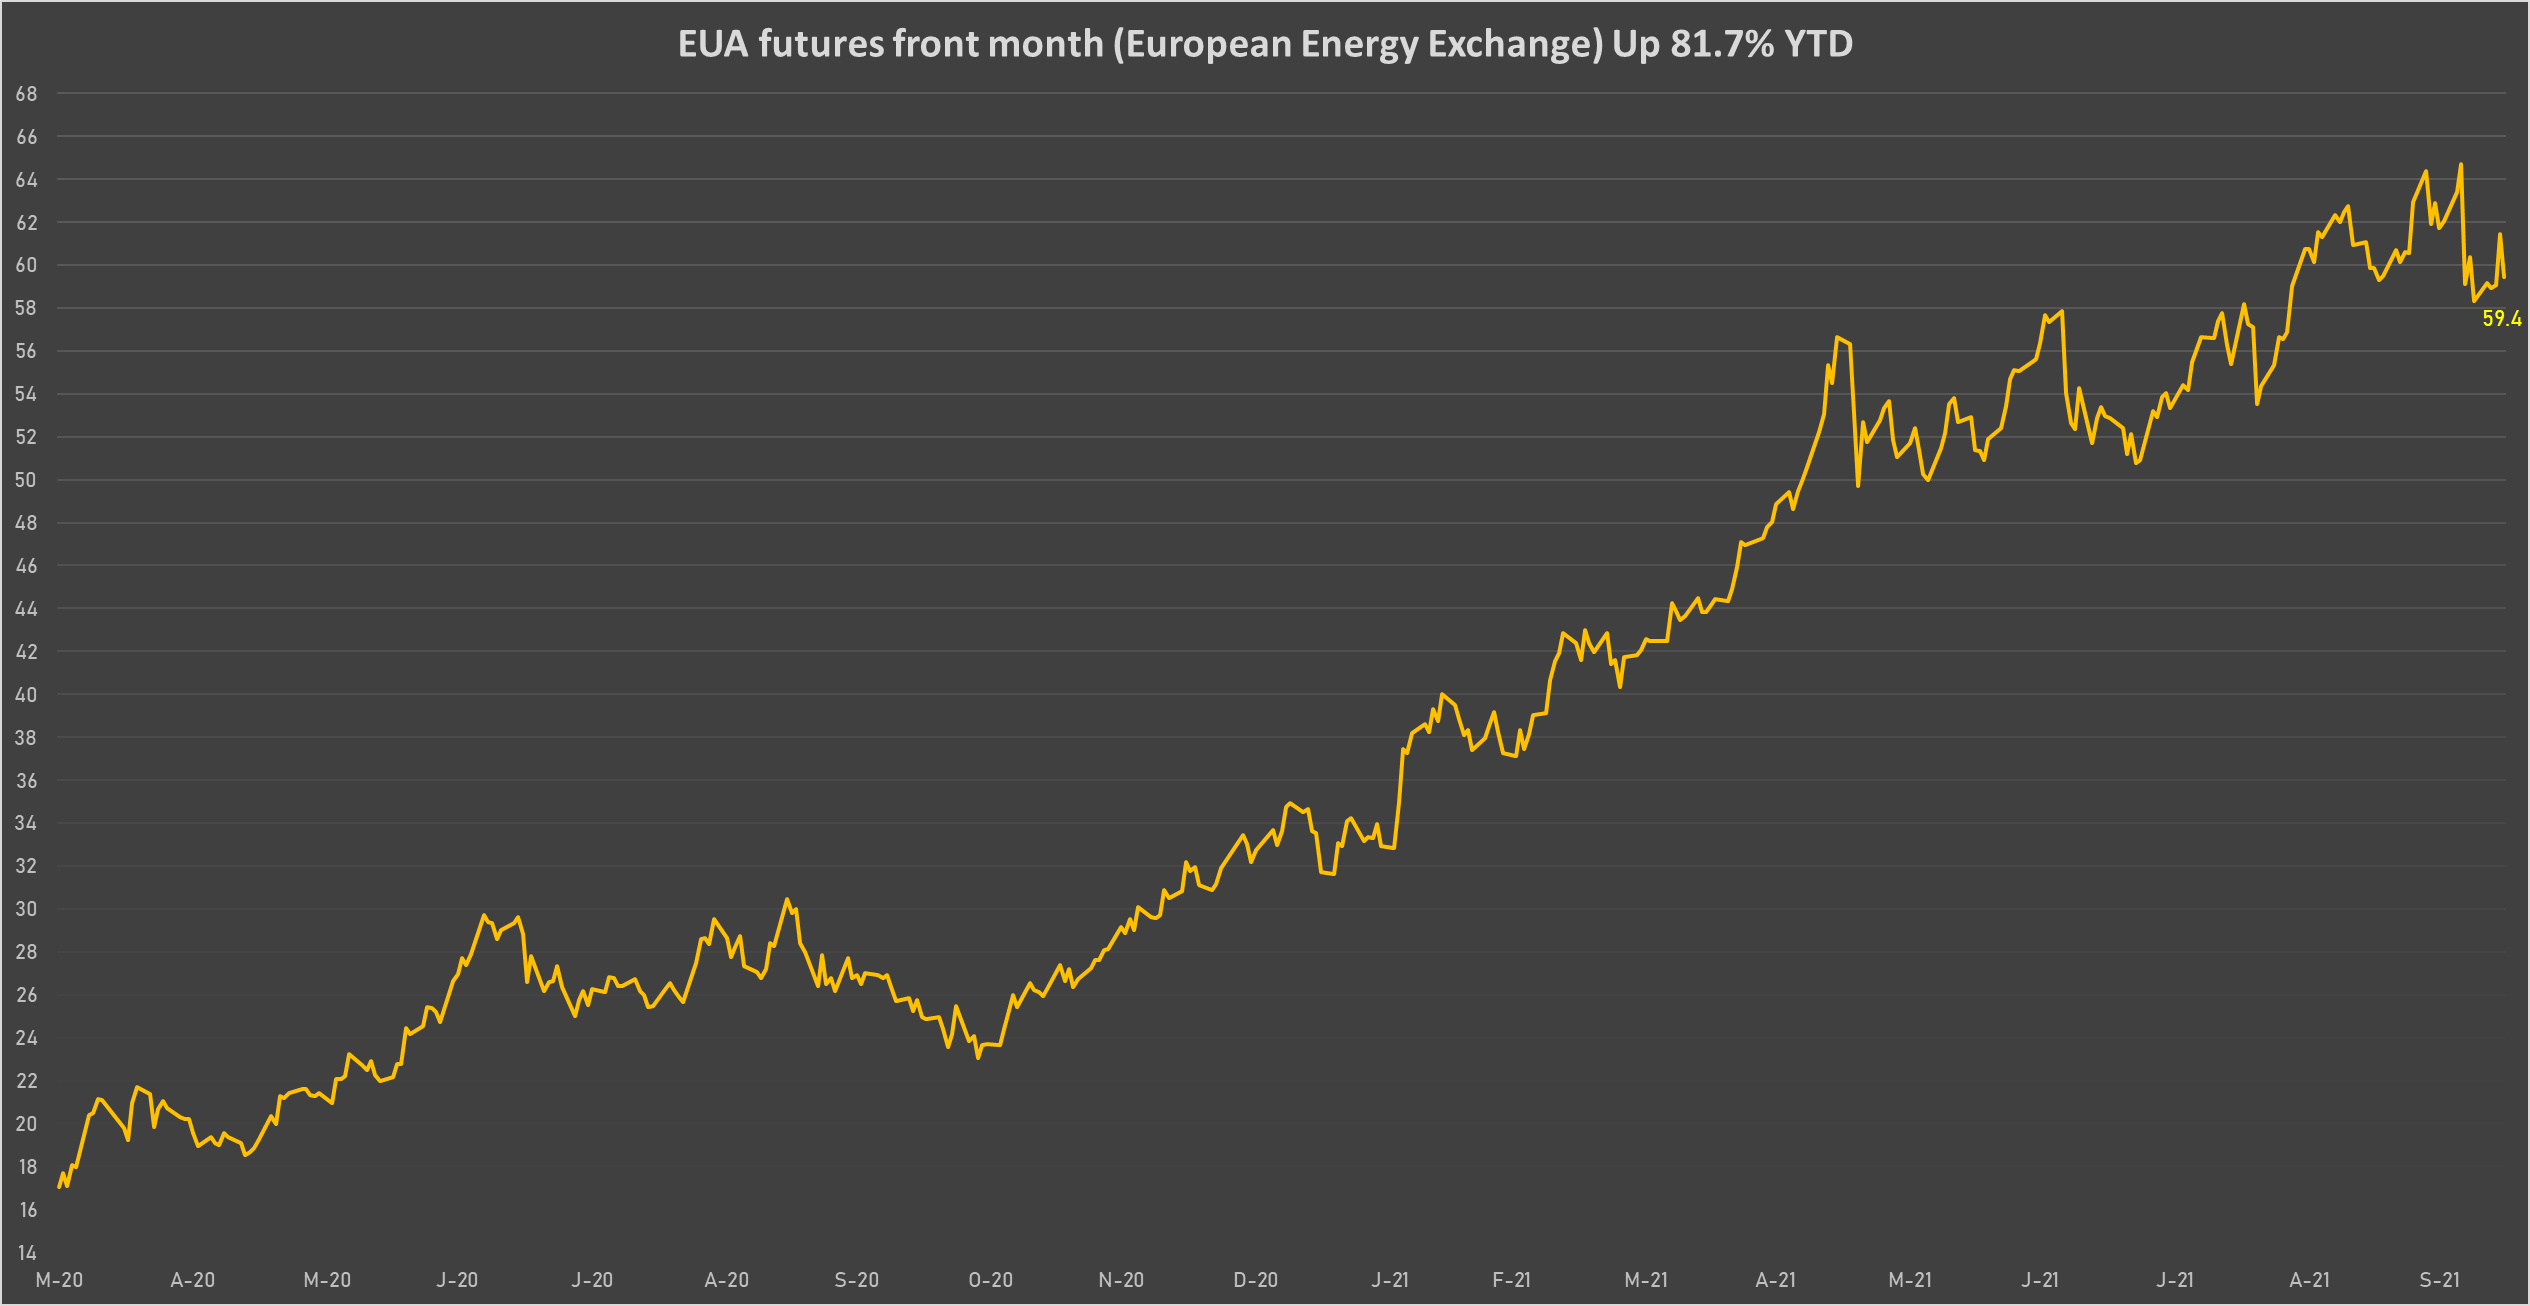
CARBON EMISSION ALLOWANCES (CO2)
- EUA futures front month (European Energy Exchange) currently at EUR 59.44 per tonne, up 1.9% (YTD: +81.7%)