top stories
Cross Asset
A Note About Weekly Updates
Just a short message to let you know that time constraints make continued weekly updates unsustainable for the time being
Credit
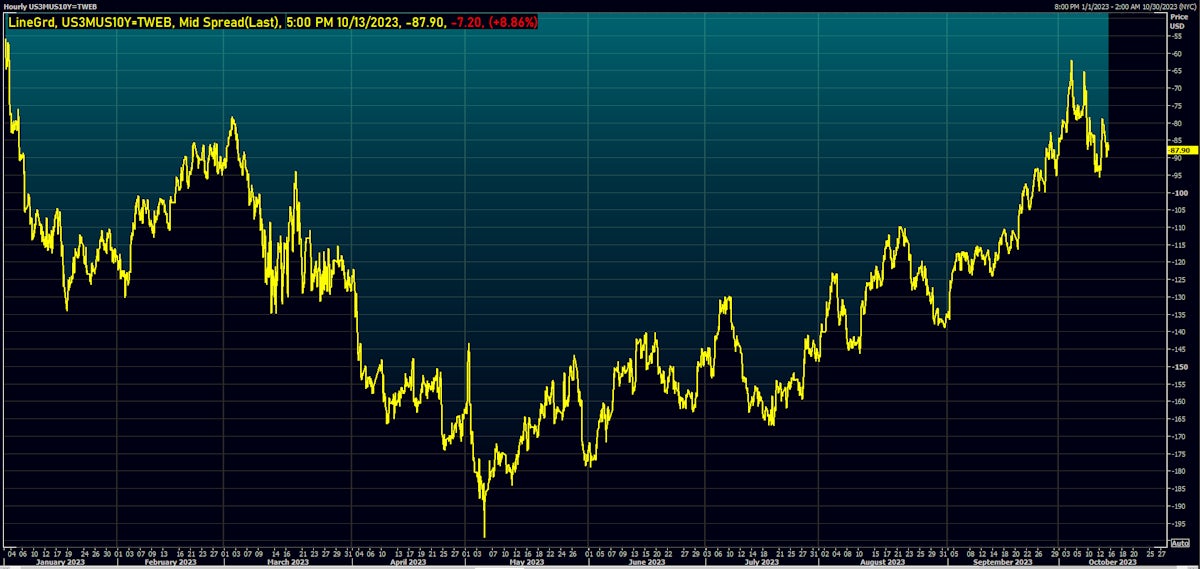
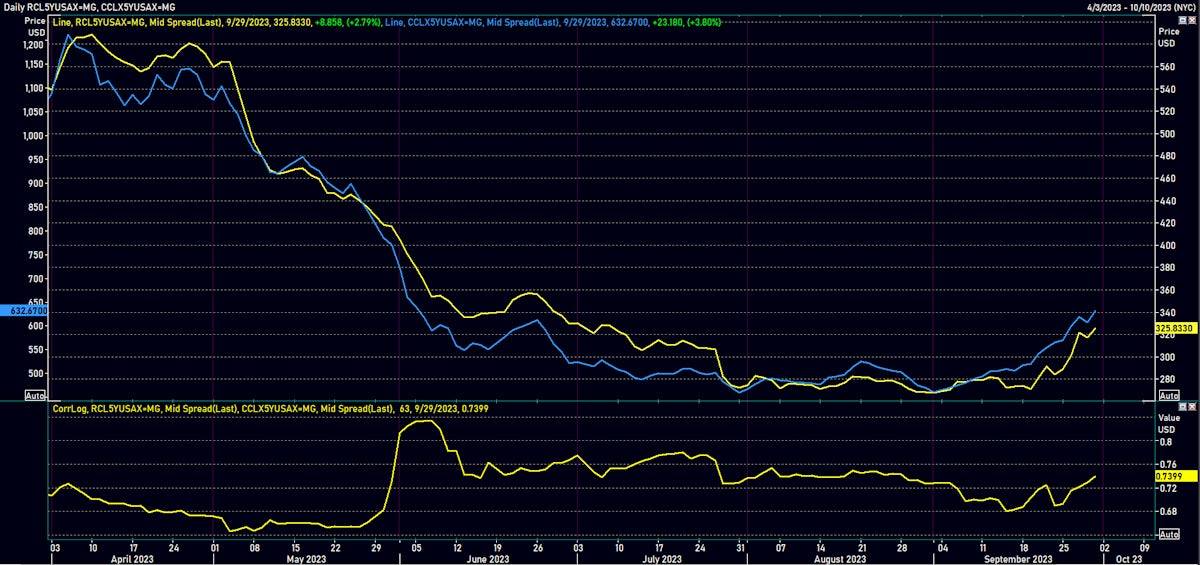
Cash Spreads Tightened Slightly While Payer Skew In CDX Swaptions Pushed Up By Geopolitical Risk
Limited USD bond supply as 3Q23 earnings season kicks off: 14 tranches for $13.25bn in IG (2023 YTD volume US$1.027trn vs 2022 YTD US$1.031trn), 4 tranches for $2.705bn in HY (2023 YTD volume US$137.436bn vs 2022 YTD US$87.661bn)
Equities
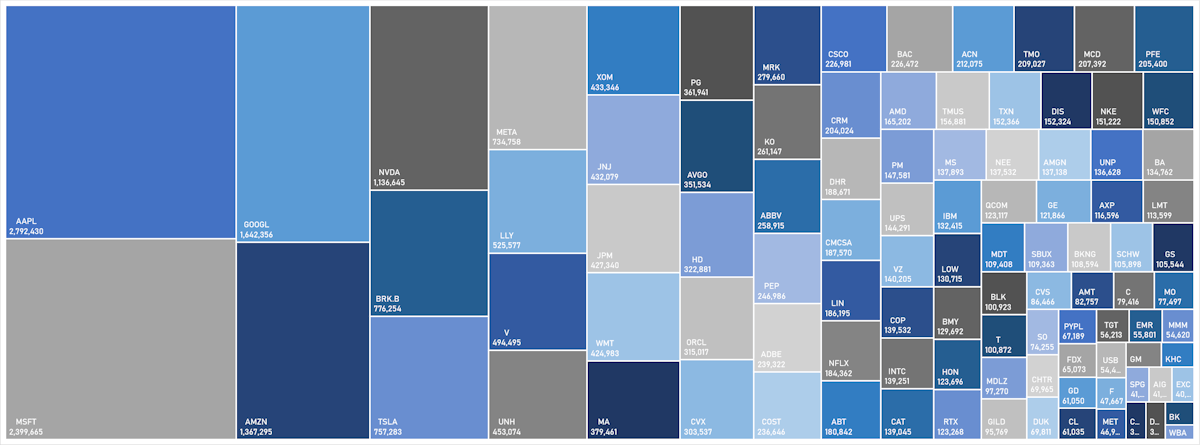
Energy And Defense Stocks Outperformed This Week As War Looms In The Middle East
Low bar to clear for corporates as 3Q23 earnings start rolling in; upside seen on the revenue side, with profit margins contracting for the 5th consecutive quarter
latest stories
Rates
US Duration Rebounded This Week, Curve Inversion Deepened As 2s10s Spread Fell 16bp
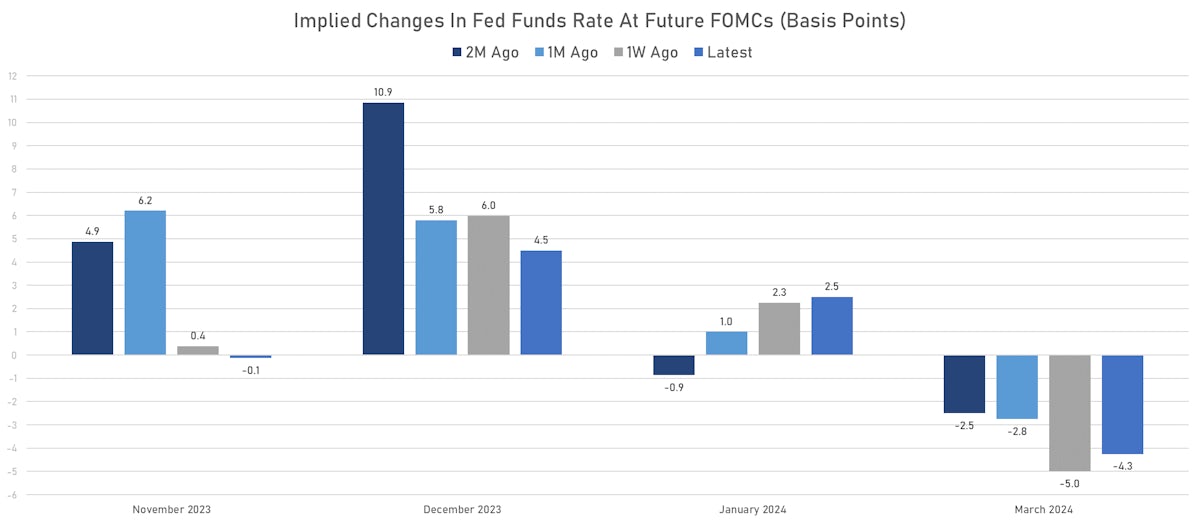
Fed officials seemed to indicate last week that a decision has been made to keep rates unchanged at the next FOMC, pointing to the tightening in US financial conditions to justify their position
Credit
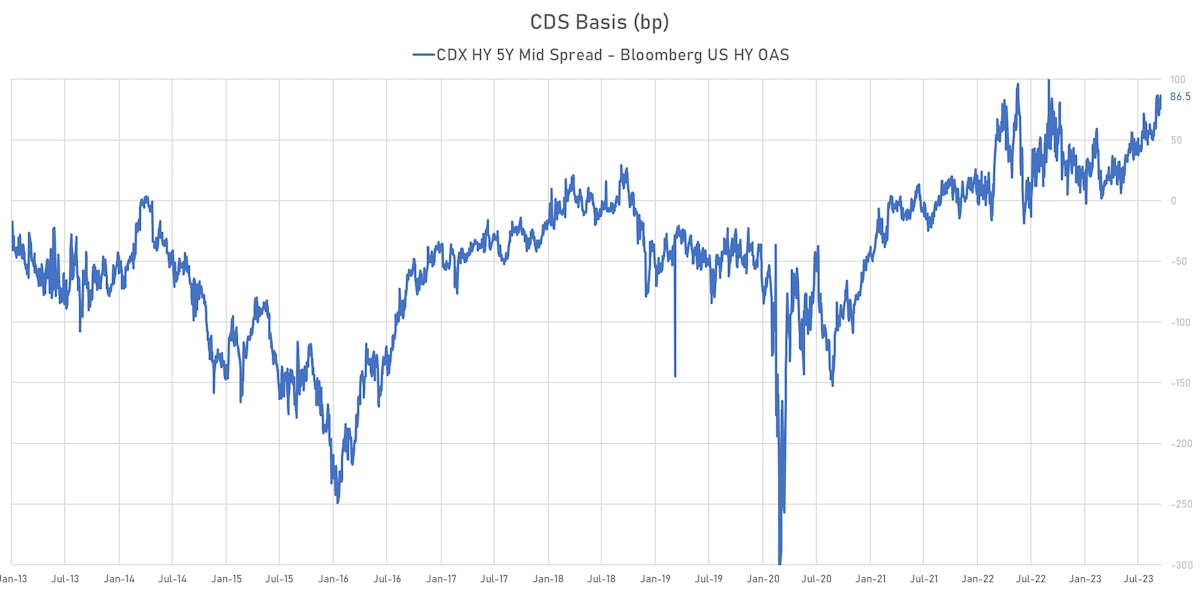
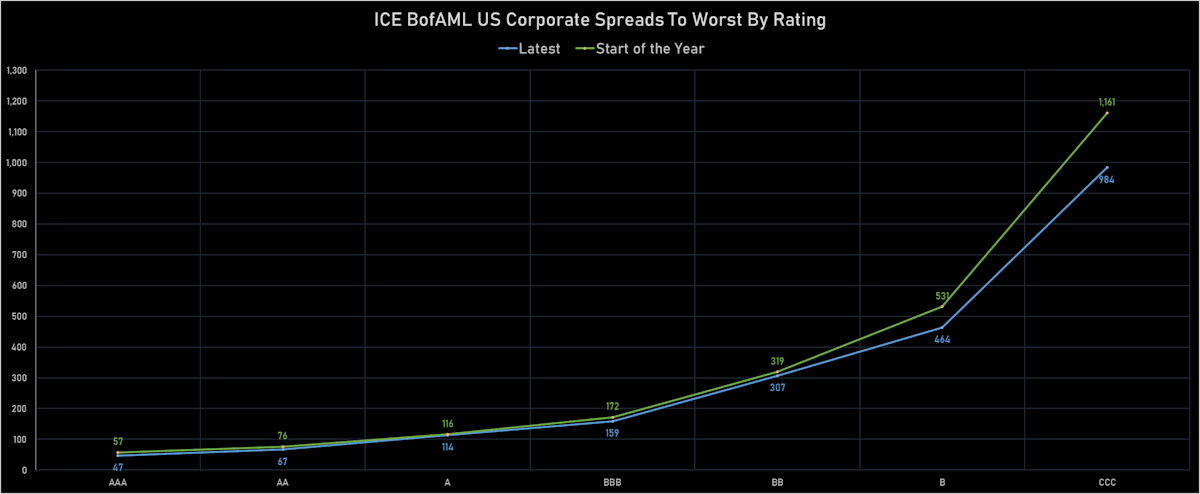
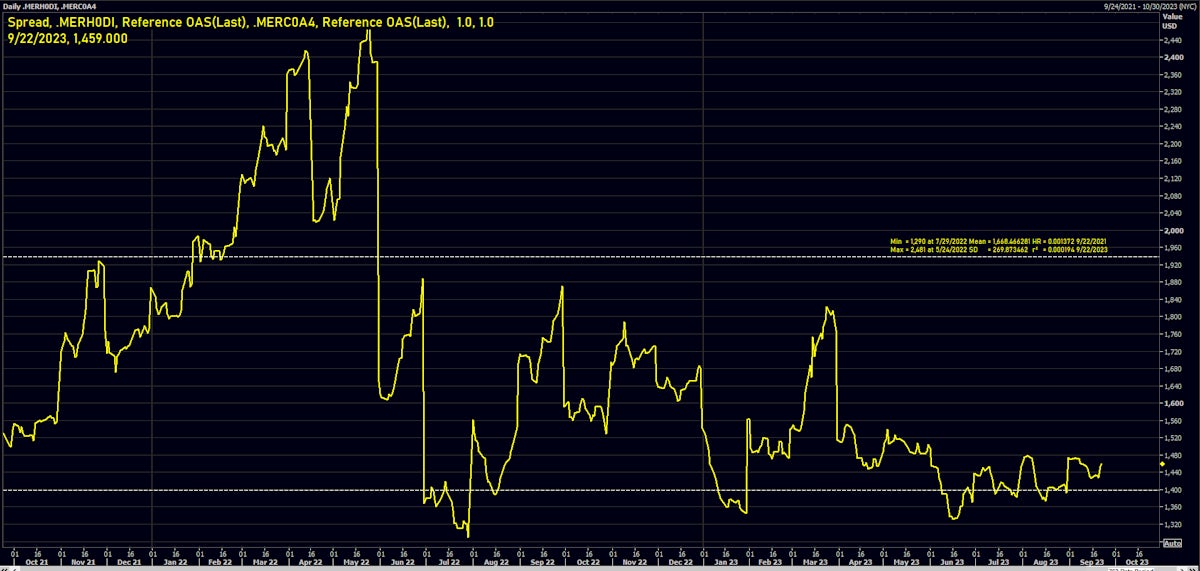
Despite Recent Widening, Cash Spreads Are Still At Reasonable Historical Levels, Credit Fundamentals Healthy For Most Sectors
Limited amount of corporate bond issuance this week: 15 tranches for US$8.9bn in IG (2023 YTD volume US$1.013trn vs 2022 YTD US$1.030trn), none in HY (2023 YTD volume US$134.731bn vs 2022 YTD US$87.001bn)
Equities
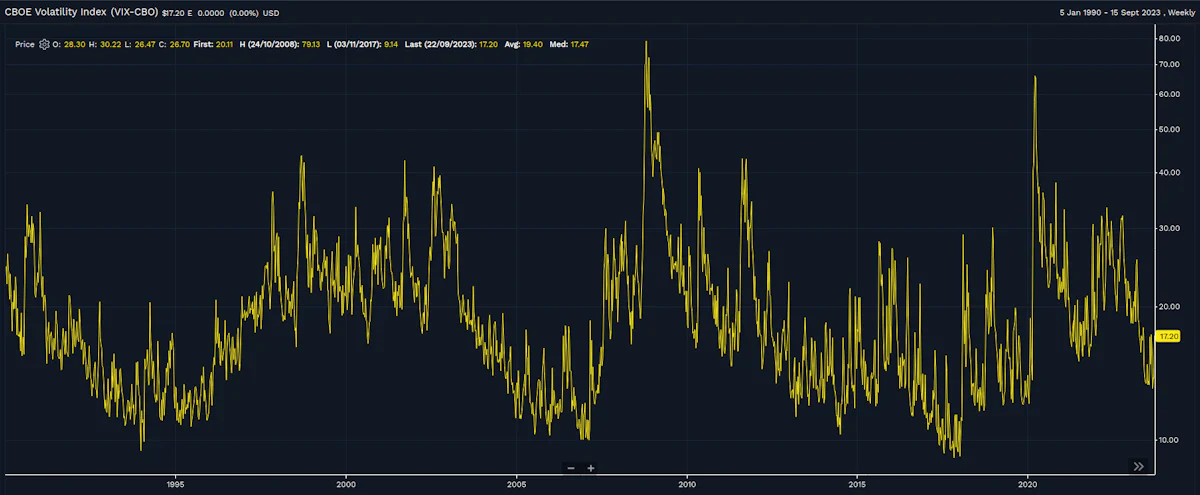
US Equities End The Week Higher, Pulled Up By The Mega-Cap Technology Stocks
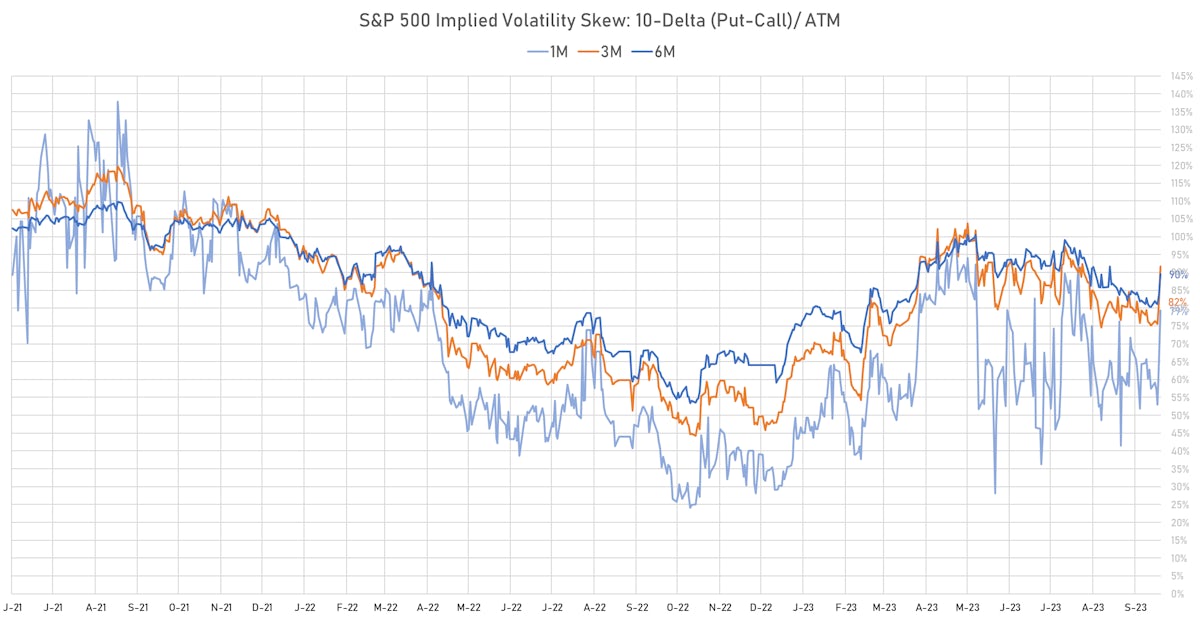
With implied volatility staying at reasonable levels and downside protection not overly bid, it looks like market participants are waiting for a bounce as earnings season is set to kick off
Rates
Continued Duration Selloff In The US This Week: 2y3y Up 22bp, 5y5y Up 28bp, 5s10s Spread Turned Positive
The CPI data this week will be critical for the Fed to determine its next step, with the November FOMC likely to the be the last live meeting of the year, considering that a delayed shutdown could overshadow the December meeting
Credit
Broad Selloff In USD Credit, As Yields Rise, Spreads Widen Across The Complex
Decent levels of issuance considering the backdrop this week: 23 tranches for $19.6bn in IG (2023 YTD volume $1.004trn vs 2022 YTD $1.016trn), 7 tranches for $5.1bn in HY (2023 YTD volume $134.731bn vs 2022 YTD $86.376bn)
Equities
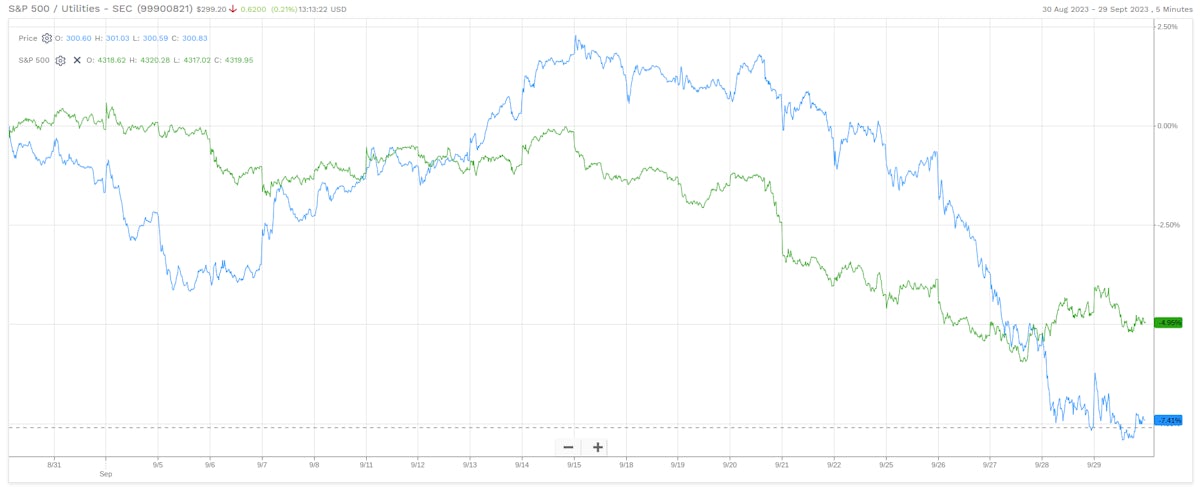
Rates Weigh On Bond Proxies, With S&P 500 Utilities Falling Close To 7% This Week
We're starting to see extreme oversold conditions that could lead to a decent rebound, with the S&P 500 currently over 2.5 standard deviations below its 50-day moving average
Rates
Continued Selloff At The Back End Of The US Curve, With 10Y Real Yields Up Another 18bp
The interesting thing about the move at the long end is that it's been more about risk management from the long side than speculative shorts, which have remained largely unchanged over the past weeks
Credit
Move To Quality In USD Credit Pushes HY Spreads Wider, IG Spreads Tighter
More modest levels of USD bond issuance this week: 21 tranches for $16.65bn in IG (2023 YTD volume $984.959bn vs 2022 YTD $1.014trn), 12 tranches for $8.333bn in HY (2023 YTD volume $129.631bn vs 2022 YTD $86.376bn)
Equities
Equities Have A Rough Week, As Real Yields Rise Without Any Positive Revision To Growth Expectations
The rise of oil prices has raised concerns about the continuing health of the US consumer sector, and this theme was really top of mind this week, with consumer staples overperforming and consumer discretionary underperforming
Rates
Hawkish FOMC Leads To Repricing Higher In USD Curves, Forward Inversion Still High Compared To Fed Forecasts
The market is currently giving roughly equal probability to a Fed hike in November and in December, but the former sounds increasingly unlikely if the Federal government shuts down for weeks in October

Credit
USD HY Overperformed IG This Week, As Spreads Tightened While Duration Sold Off
A decent week for USD bond issuance: 45 tranches for $36.085bn in IG (2023 YTD volume $968.309bn vs 2022 YTD $1.008trn), 14 tranches for $9.15bn (2023 YTD volume $121.297bn vs 2022 YTD $80.376bn)
Equities
Sideways Price Action For US Equities This Week, Dragged Down By Technology Stocks
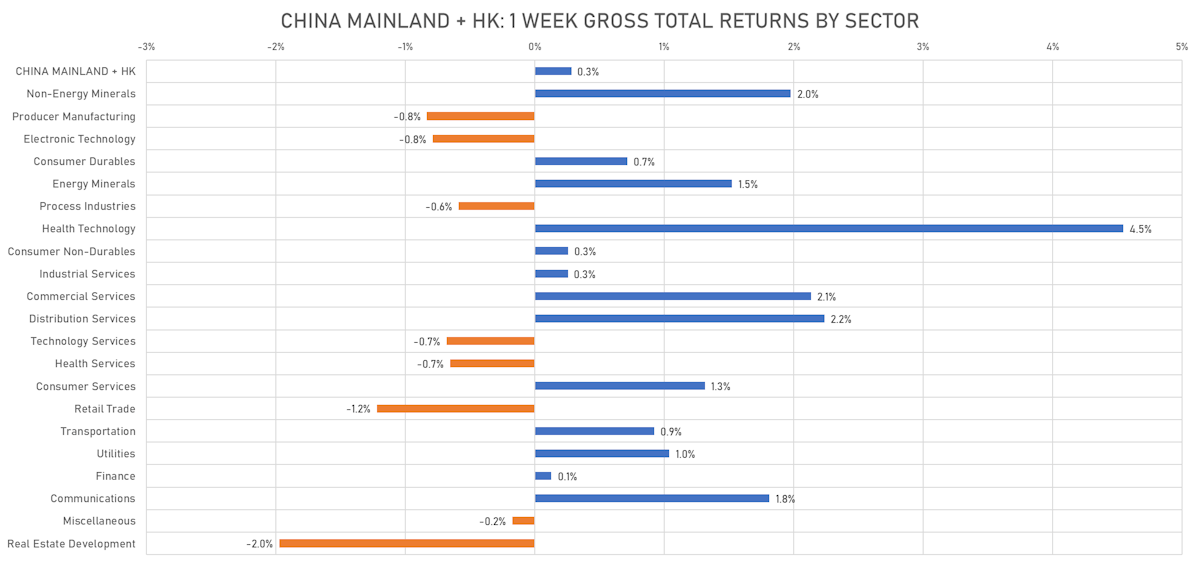
Chinese equities saw a slight rebound (US$ total returns), although the real estate sector continues to underperform, with enduring concerns about possible LGFV defaults
Rates
Modest Sell-Off At The Long End, With The US Curve Steepening, Driven By Real Rates
The September FOMC decision not to hike is well-telegraphed, but it will be interesting to see what the Fed's latest economic projections and dot plot show, as the strength of the recent data continues to justify one more hike
Credit
Losses Across The US Credit Complex, With Modest Spread Widening Amplifying The Move In Rates
High-quality bond issuance jumped this week as corporates are back to work: 74 tranches for $57.53bn in IG (2023 YTD volume $932.224bn vs 2022 YTD $988.591bn), 3 tranches for $815m in HY (2023 YTD volume $112.147bn vs 2022 YTD $78.876bn)
Equities
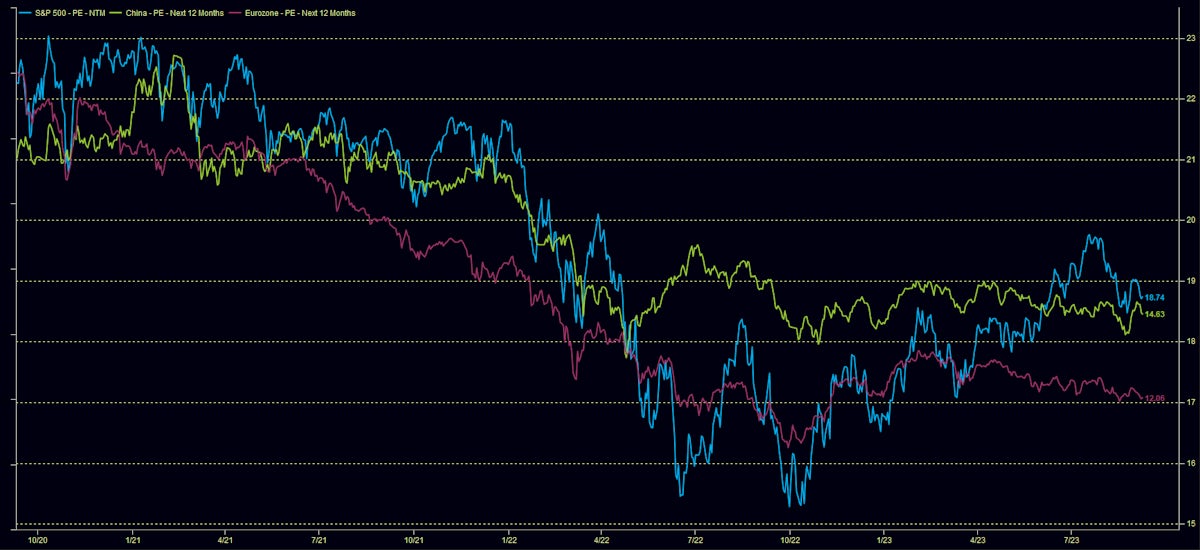
Pretty Grim Week For Global Equities: US Total Return -1.5%, China -2.0%, EZ -2.2%
The rise in real yields mixed with an economic slowdown and tension between the US and China around technology have been driving valuations lower: the NTM P/E of Eurozone stocks is now back around 12x
Rates
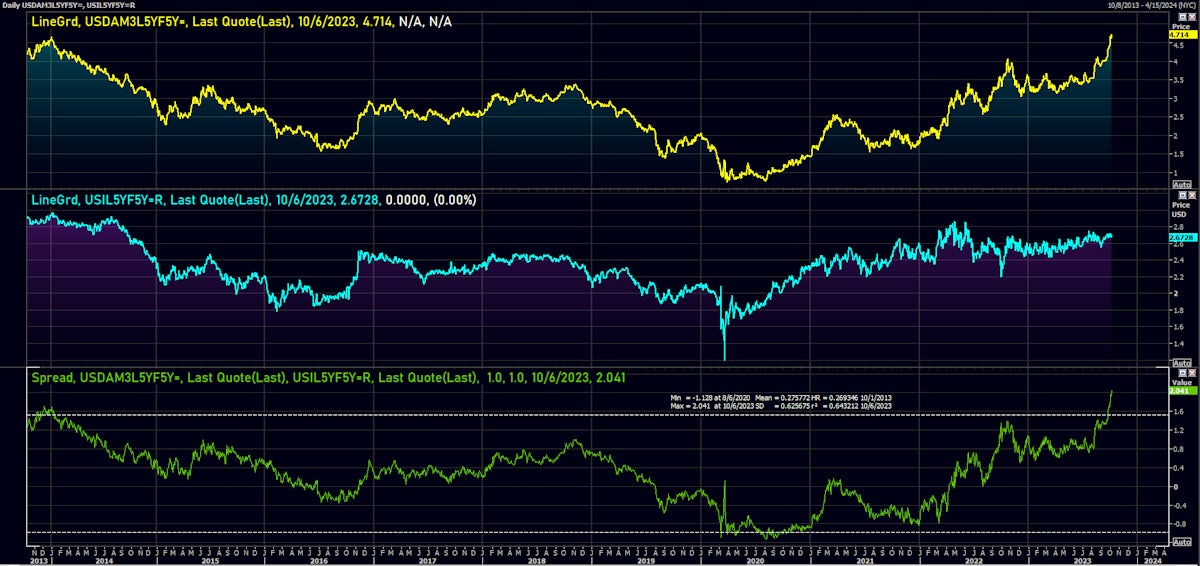
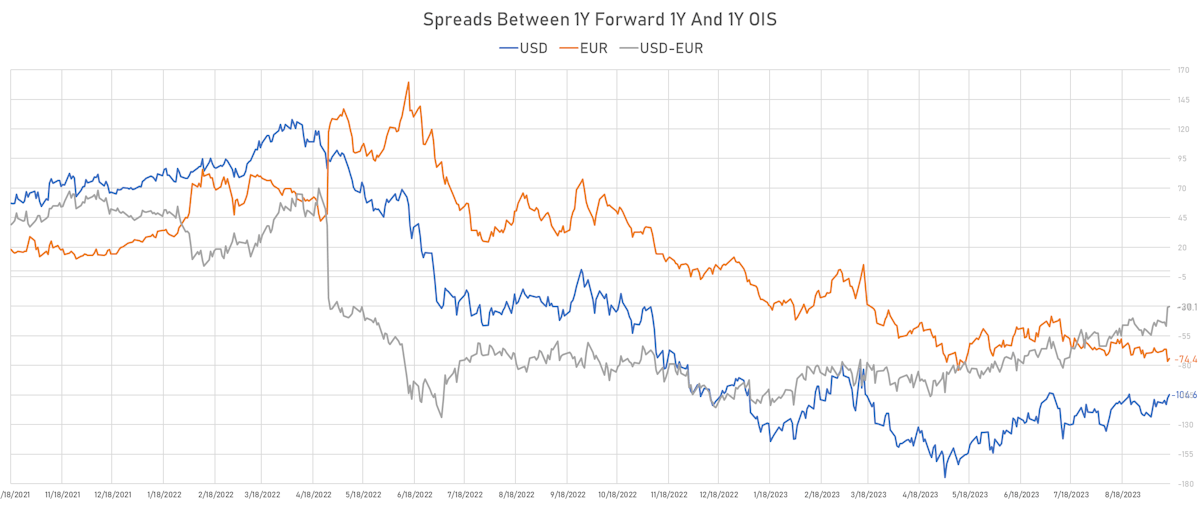
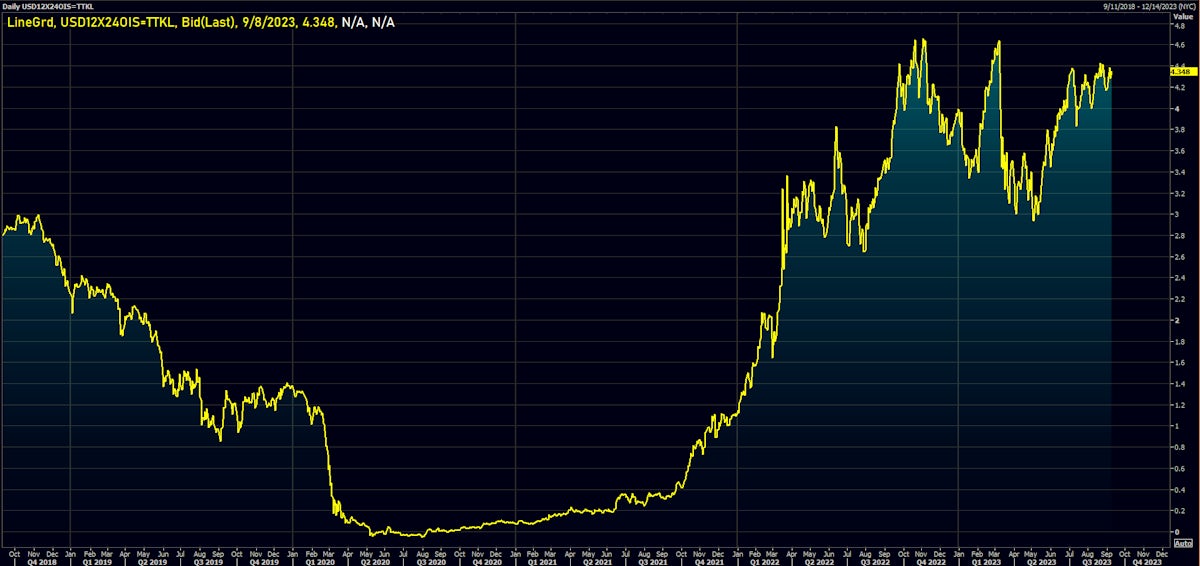
Rates Sold Off This Week, With The OPEC Decision Adding Some Pressure To The Front-End Of The Inflation Curve
The main driver of the recent moves in US rates has been the robustness of US economic growth, pushing up 1y forward 1y and repricing the belly of the curve towards a higher neutral rate
Credit
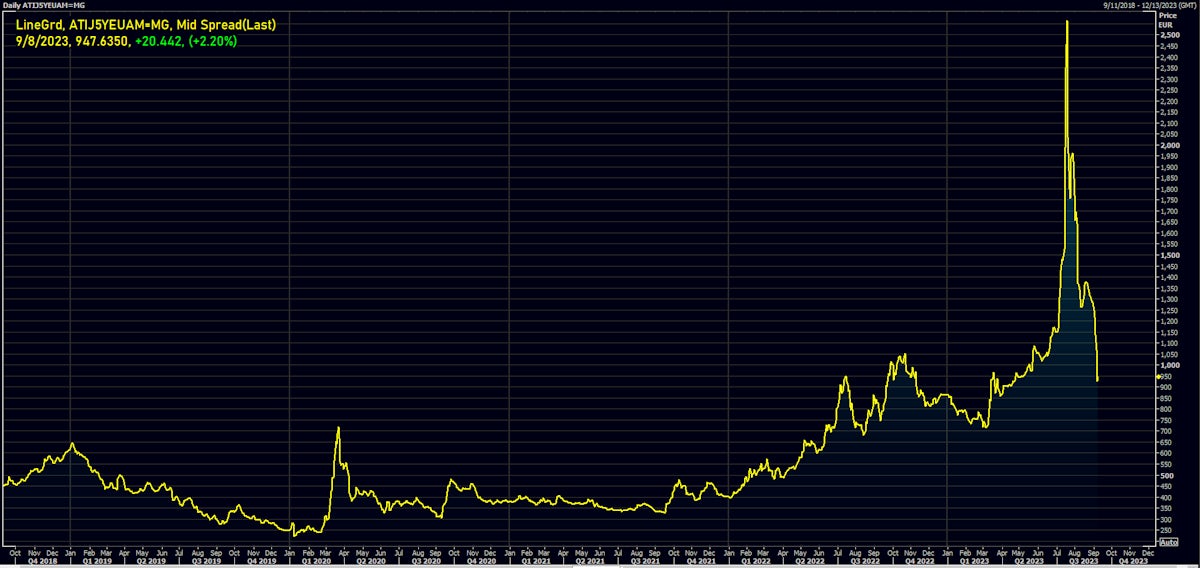
High Yield USD Cash Credit Has Outperformed Equities Over The Month Of August On A Vol Adjusted Basis
Very little activity in the USD primary bond market this week: 4 tranches for $3.45bn in IG (2023 YTD volume $873.694bn vs 2022 YTD $936.09bn), no new issue in HY (2023 YTD volume $111.332bn vs 2022 YTD $77.37)
Equities
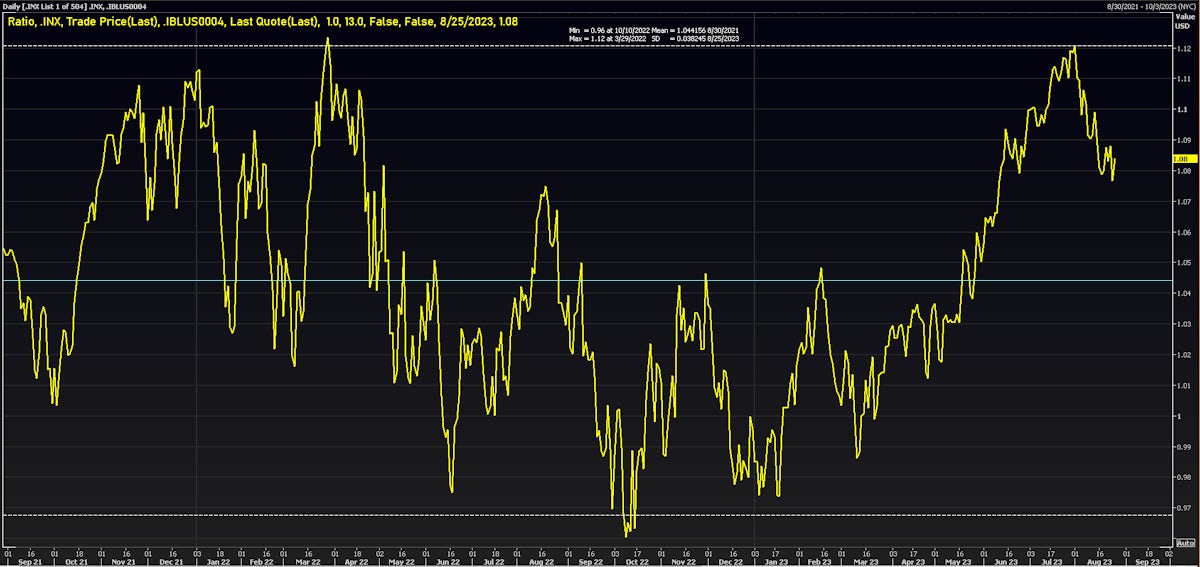
Decent Rebound For US Equities This Week, With Healthier Hedge Fund Positioning Helping
The divergence in the macro outlook of major economic areas has become more apparent, and was reflected in the poor performance of Chinese and European equities over the past week