Equities
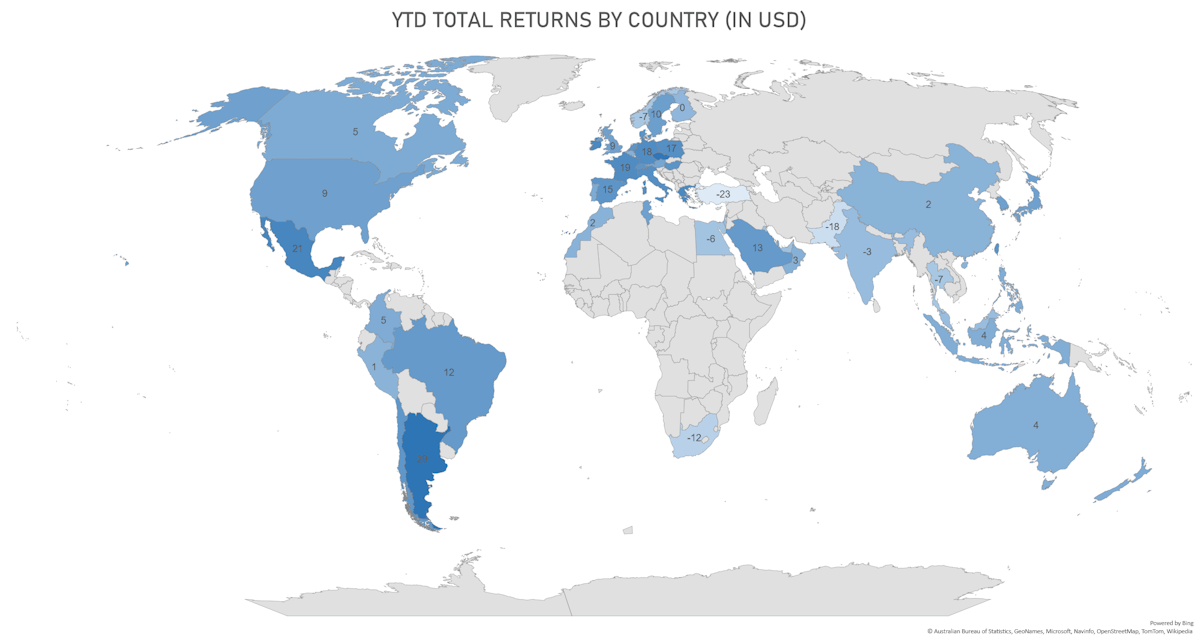
Energy And Defense Stocks Outperformed This Week As War Looms In The Middle East
Low bar to clear for corporates as 3Q23 earnings start rolling in; upside seen on the revenue side, with profit margins contracting for the 5th consecutive quarter
Equities
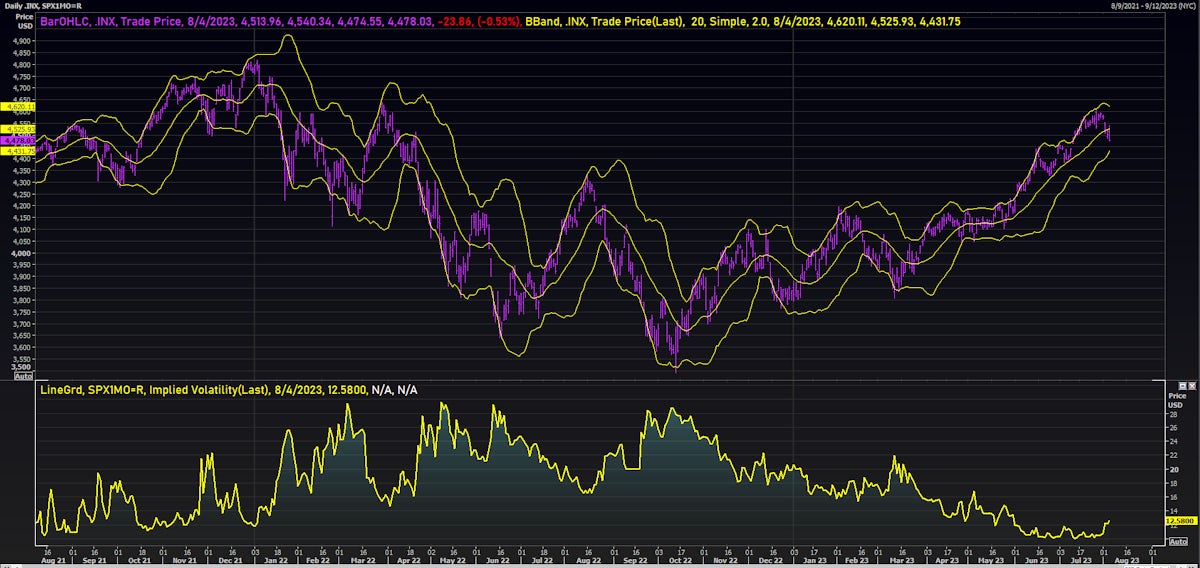
US Equities End The Week Higher, Pulled Up By The Mega-Cap Technology Stocks
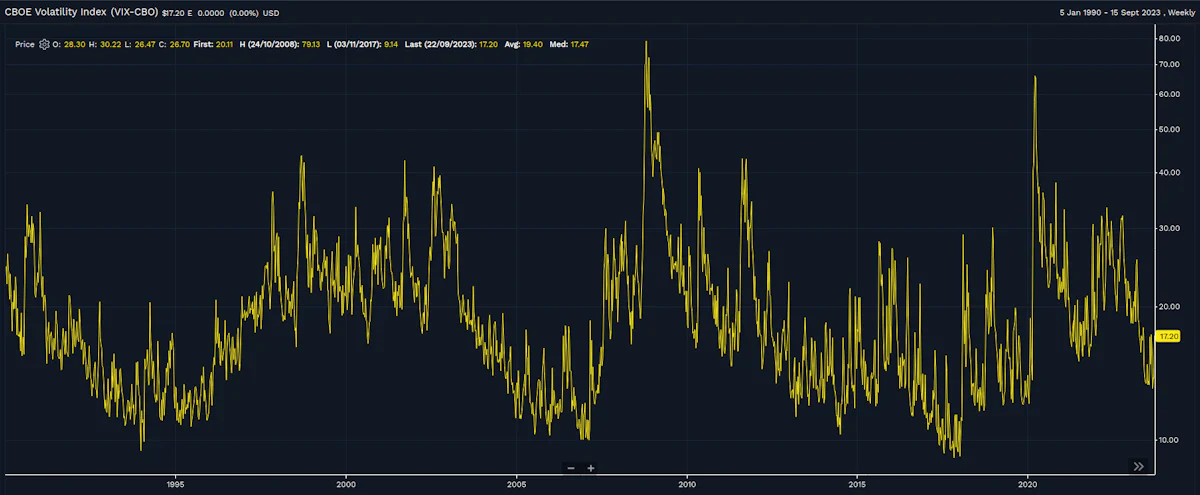
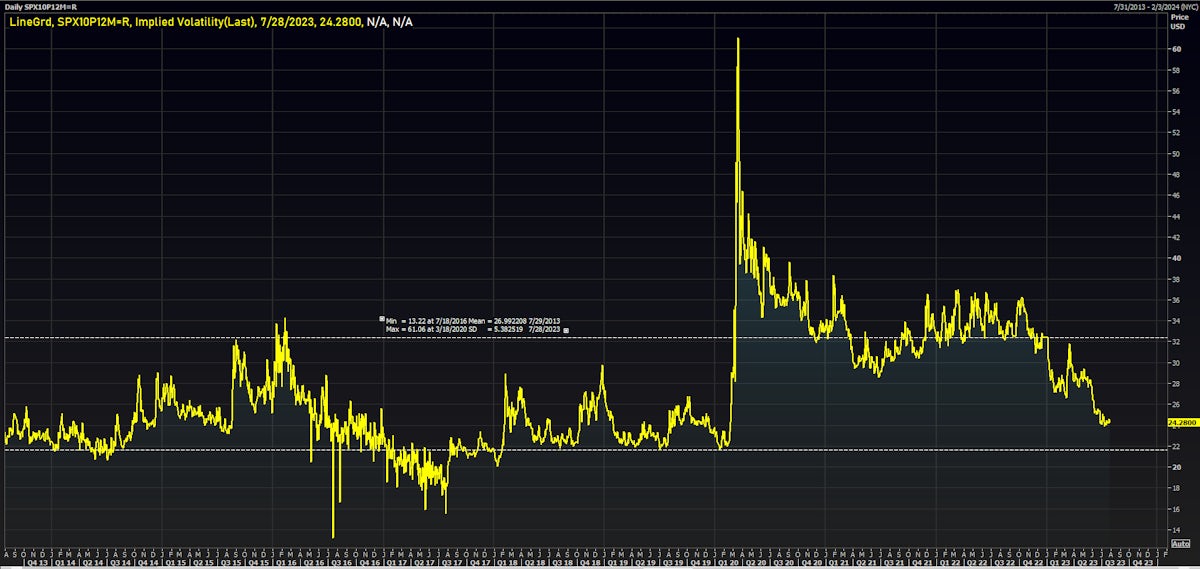
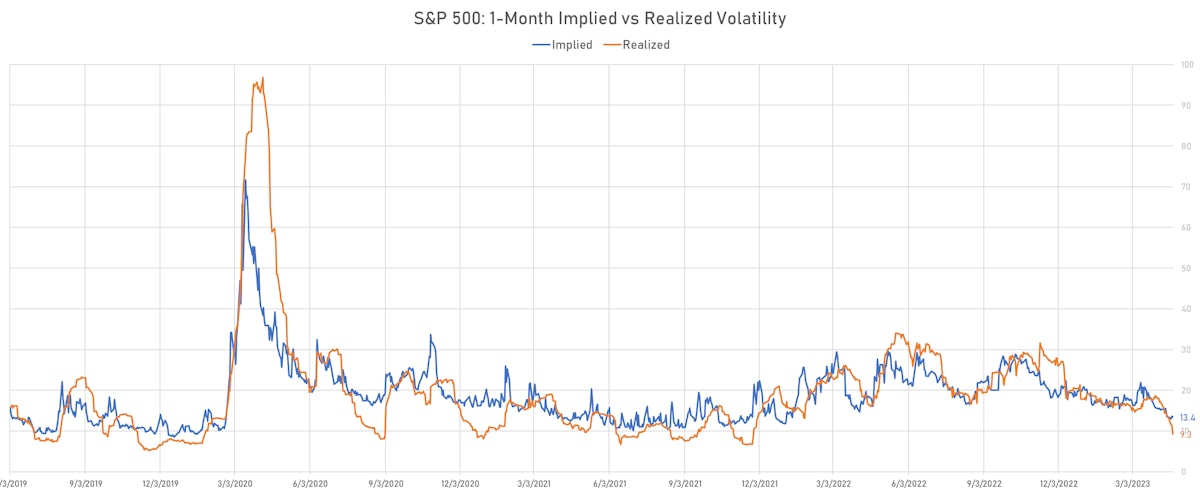
With implied volatility staying at reasonable levels and downside protection not overly bid, it looks like market participants are waiting for a bounce as earnings season is set to kick off
Equities
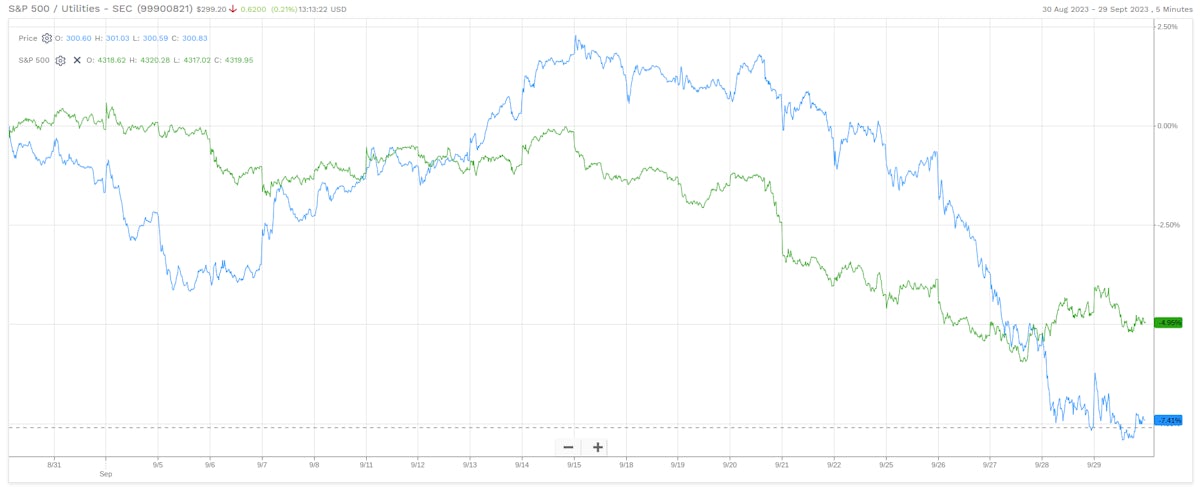
Rates Weigh On Bond Proxies, With S&P 500 Utilities Falling Close To 7% This Week
We're starting to see extreme oversold conditions that could lead to a decent rebound, with the S&P 500 currently over 2.5 standard deviations below its 50-day moving average
Equities
Equities Have A Rough Week, As Real Yields Rise Without Any Positive Revision To Growth Expectations
The rise of oil prices has raised concerns about the continuing health of the US consumer sector, and this theme was really top of mind this week, with consumer staples overperforming and consumer discretionary underperforming
Equities
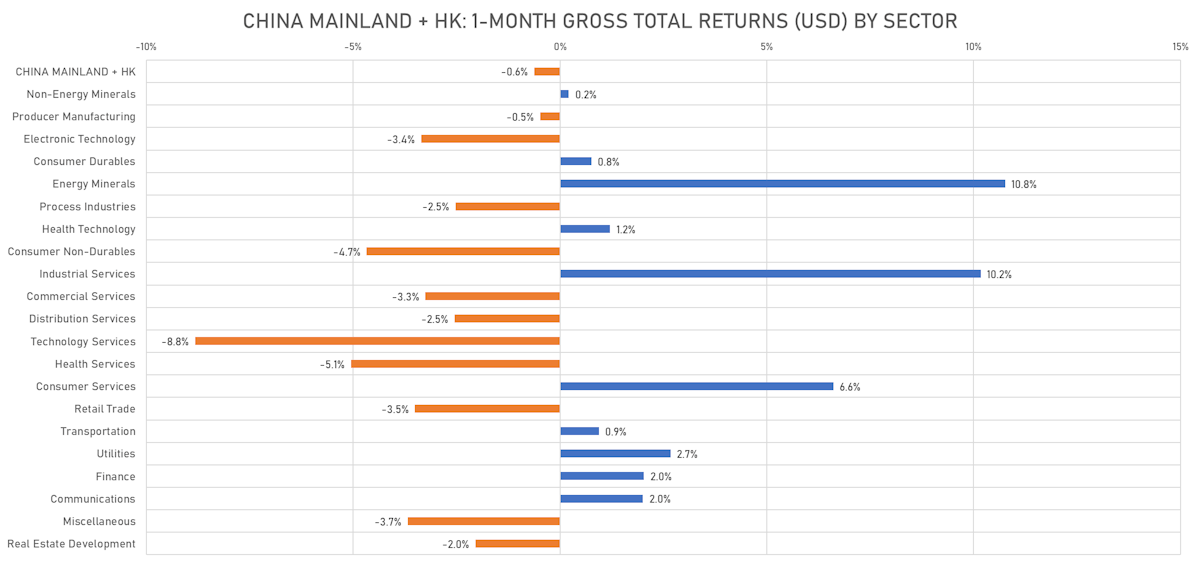
Sideways Price Action For US Equities This Week, Dragged Down By Technology Stocks
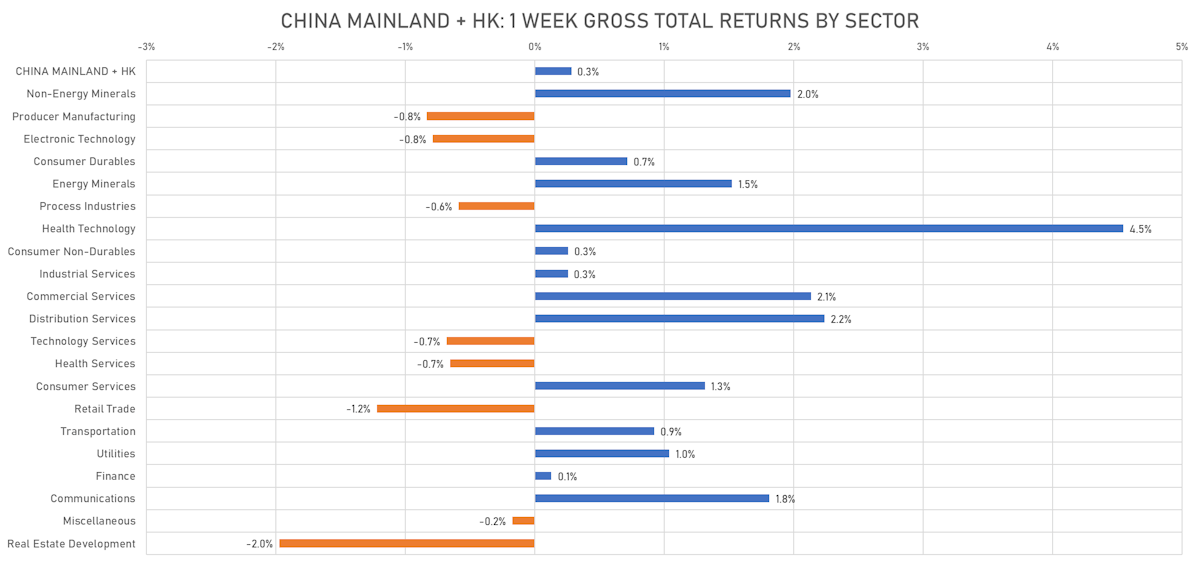
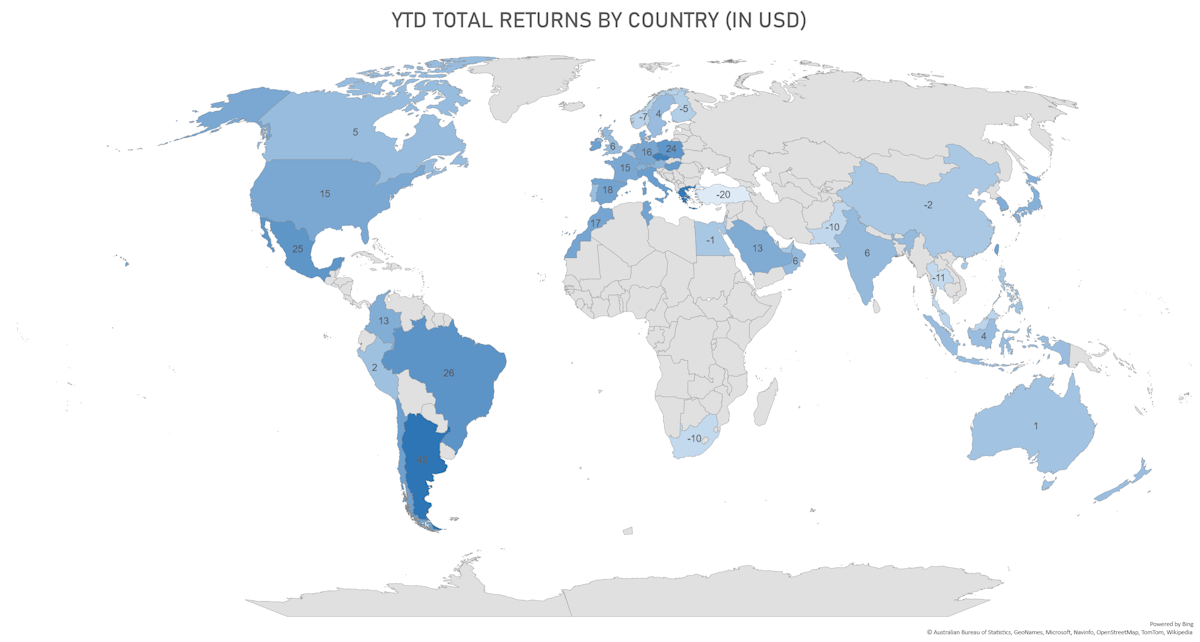
Chinese equities saw a slight rebound (US$ total returns), although the real estate sector continues to underperform, with enduring concerns about possible LGFV defaults
Equities
Pretty Grim Week For Global Equities: US Total Return -1.5%, China -2.0%, EZ -2.2%
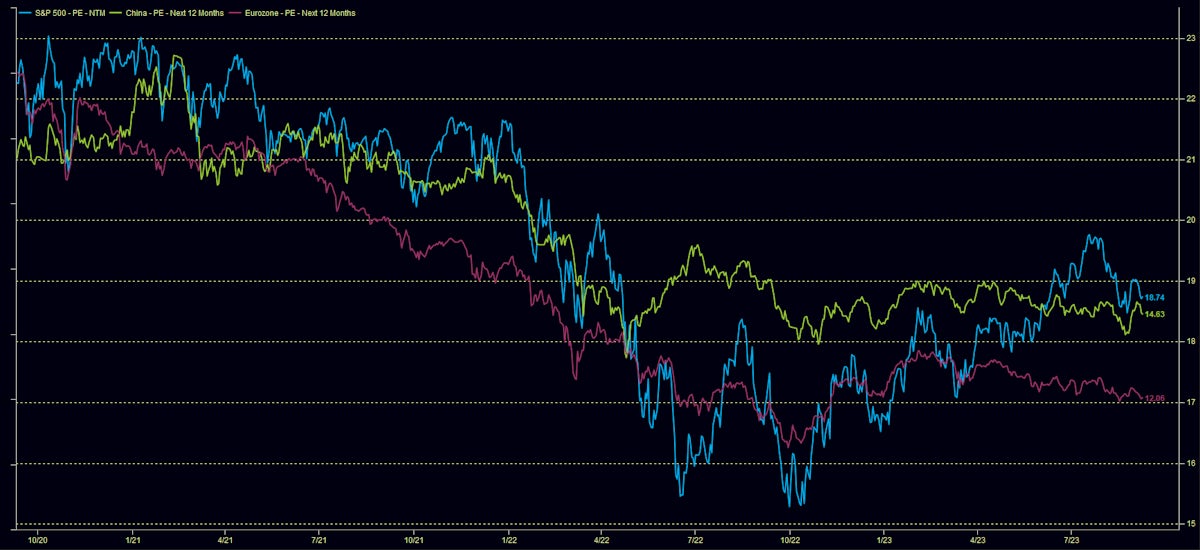
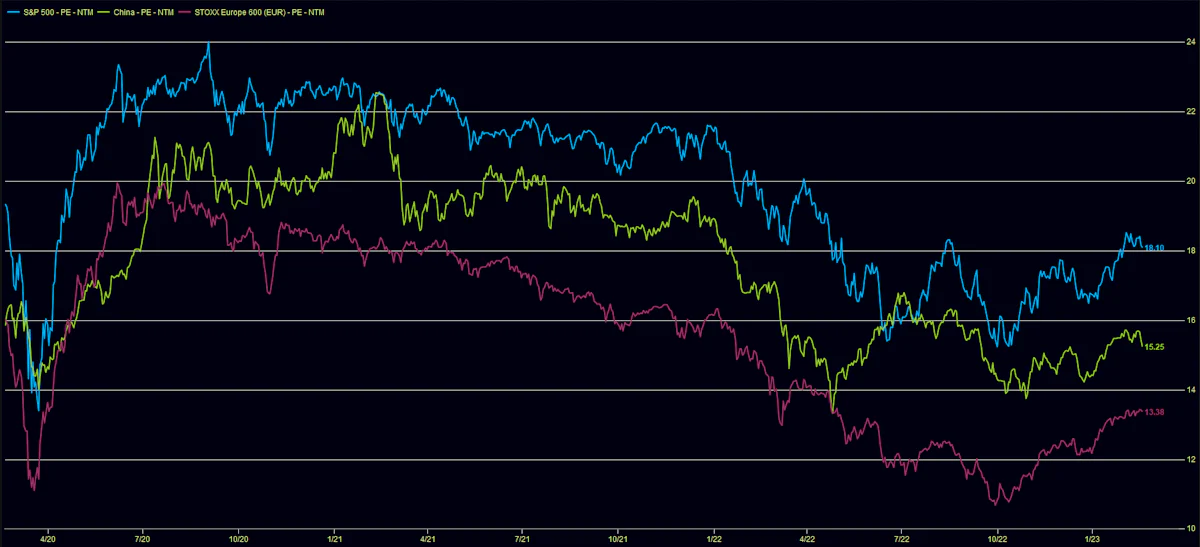
The rise in real yields mixed with an economic slowdown and tension between the US and China around technology have been driving valuations lower: the NTM P/E of Eurozone stocks is now back around 12x
Equities
Decent Rebound For US Equities This Week, With Healthier Hedge Fund Positioning Helping
The divergence in the macro outlook of major economic areas has become more apparent, and was reflected in the poor performance of Chinese and European equities over the past week
Equities
Stretched Sentiment And Positioning, Lower Summer Liquidity, Facilitate Short-Term Consolidation
The low level of realized (and implied) volatility this year can largely be explained by the rise in dispersion (fall of correlation) of performance across single stocks and sectors
Equities
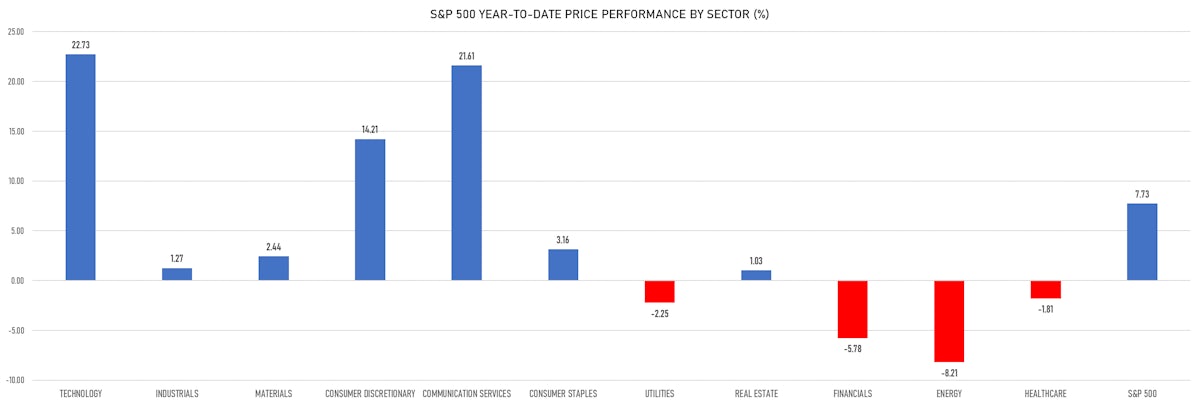
Although Momentum Remains Strong, The Performance Of US Tech Is Unlikely To Be Repeated in 2H23
At current levels, with the S&P 500 Technology sector up 46% YTD, a couple of things make sense: 1) hedging US equities with cheap gamma; 2) look for a continuation of the cycle in EM stocks that have underperformed (Chinese ADRs for example)
Equities
July Performance Unfazed Despite Mediocre Earnings So Far, Bolstered by Increase In Net Length From Fast Money Community
Though current levels of valuation for US equities look high, with the forward P/E on the S&P 500 close to 20, they are actually at a more reasonable 17 when you exclude the "magnificent seven" stocks (collectively trading at 32x)
Equities
Strong Performance Across US Equities As 2Q23 Earnings Season Gets Under Way
The improvement in market breadth could prove to be a headfake: if anything pulls equities higher from here, it will probably be more of the magnificent seven, rather than to a true broadening of the rally
Equities
Risks Of Higher-For-Longer Fed Policy Took US Equities Lower For The Week After Solid Gains In June
The skew in the implied volatility of S&P 500 options is close to neutral, and the aggregated positioning of hedge funds is still prudent (very low long/short ratios) heading into earnings season, possibly setting up US stocks for further gains
Equities
US Equities Keep Rising With Improved Breadth, Though Some Tactical Signals Point To Froth
Easy to overlook after months of underperformance, Chinese equities have done well over the past week, generating US$ total returns of 4.3% (vs 2.6% for US equities)
Equities
US Equities Continue To Rise, Now Led By Small Caps (up 6.7% MTD vs 2.9% for the S&P 500)
The extreme concentration of index returns around technology stocks is starting to broaden out, which should keep the rally intact for a while in the absence of a clear catalyst for a correction
Equities
US Equities Have Terrible Breadth: NDX Up 8% Month-To-Date, Equal-Weighted S&P 500 Down 3%
Active managers are still very lightly positioned, which could lead to further gains in the short term, with continued strength in economic data and a new debt ceiling deal
Equities
US Equities Rose 160bp This Week, Still Led By Technology And Internet Services
Before falling on Friday, the S&P 500 toyed with 4,200 this week to make new YTD highs, and could break that level more convincingly in June with a debt ceiling resolution and still very light net speculative positioning
Equities
Tech Outperformed The S&P 500 By 5% This Week As Mega Caps Continue To Lead US Equities
Net margins for the first quarter have contracted much less than expected (99bp vs 146bp) but investors remain very prudent, pointing to a possible upward path as long as growth remains fairly robust
Equities
US Equities Continue To Trade Sideways, Caught Between Solid Economic Data And Regional Banking Crisis
85% of the S&P 500 market cap has now reported 1Q23: the blended revenue growth rate stands at 3.9% and EPS growth rate at -2.2% (vs -6.7% expected) according to FactSet's latest Earnings Insight report
Equities
US Equities Gained 50bp Over The Past Week, Capping April Total Returns Of 85bp
Close to two thirds of the S&P 500 by market cap has now reported 1Q 2023 earnings, and results have been better than expected (still bad), down 5% YoY against a consensus estimate of -7%
Equities
US Equities Unchanged This Week On String Of Low Volume, Low Volatility Sessions
1Q23 earnings so far are slightly better than expected, though still bad: the blended quarterly decline currently at -6.2%, with 53% of companies beating consensus estimates by at least 1 standard deviation (vs 25-year average of 48%)
Equities
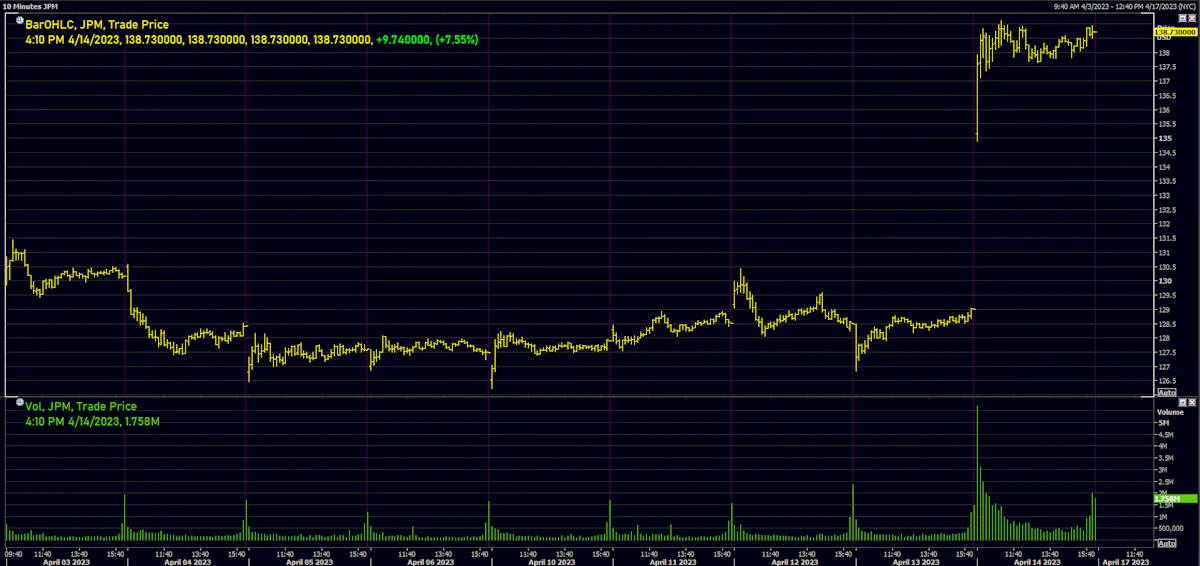
Winning Week For US Equities, With Large Banks Like Citi And JPM Beating EPS Estimates On Strong NII
Rerisking is definitely here, with Europe and EM seeing healthy inflows this week, but net length in US equity portfolios remains muted (hedge funds long/short ratios at multi-year lows)
Equities
4% of S&P 500 Companies Will Report 1Q23 Numbers In The Week Ahead, With EPS Expected To Fall 7% YoY
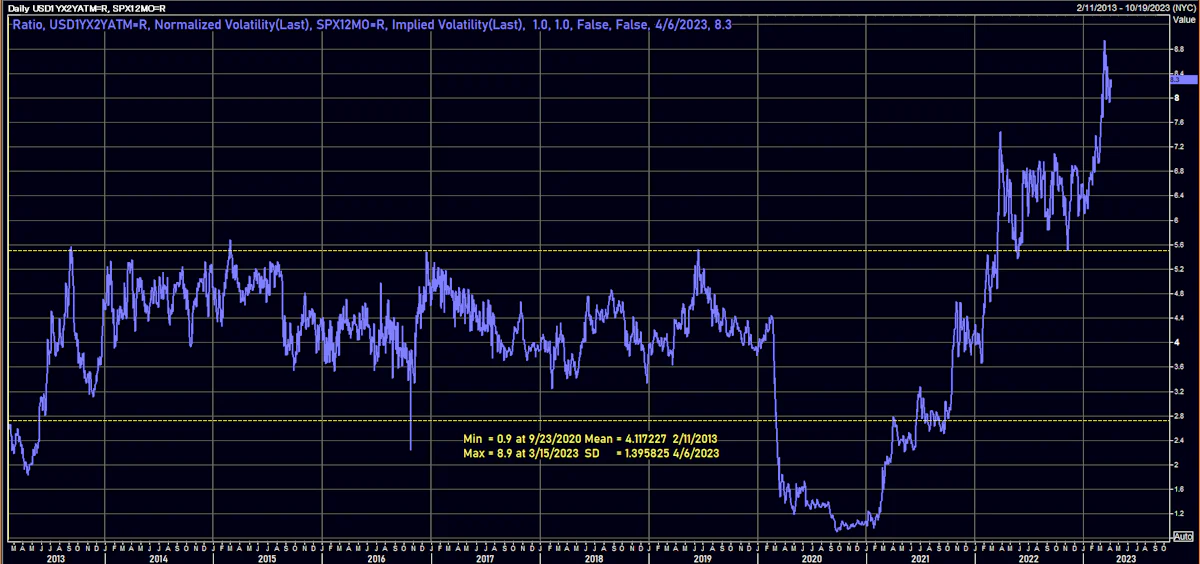
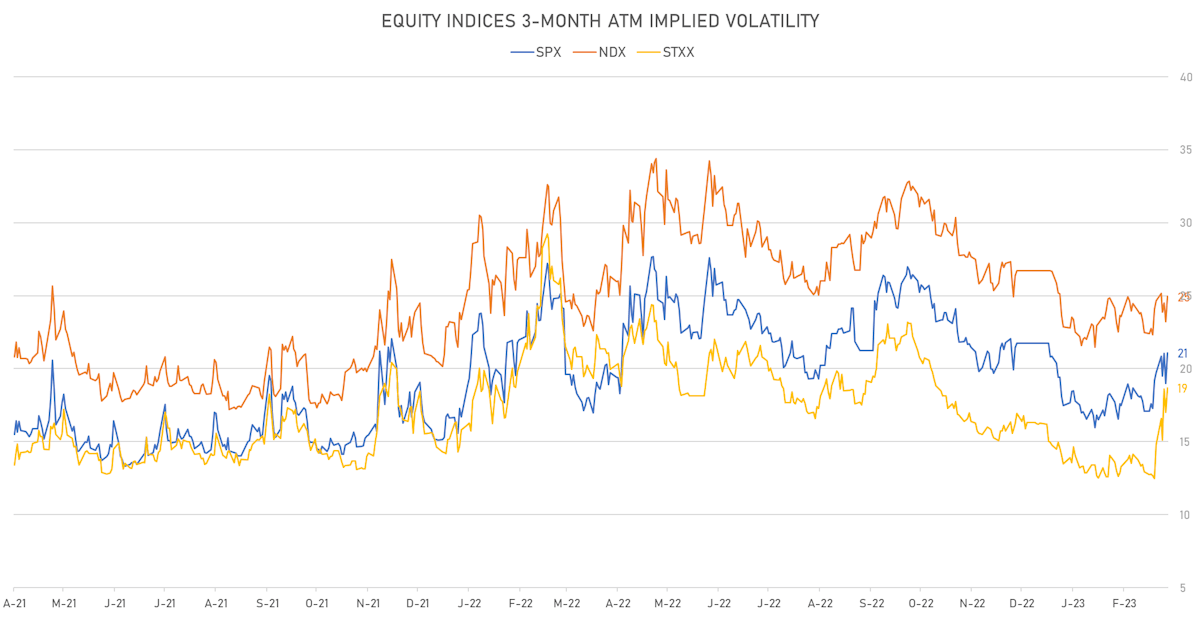
The compartmentalization of market risks has led to huge differences between the implied volatility of stocks compared to rates: 1Y into 2Y USD OIS swaptions are still around 3 standard deviations richer than 1Y ATM options on the S&P 500
Equities
US Equities End Week Broadly Higher After A Good Squeeze; NDX Now Up 20.5% YTD, Best Quarter Since 2Q20
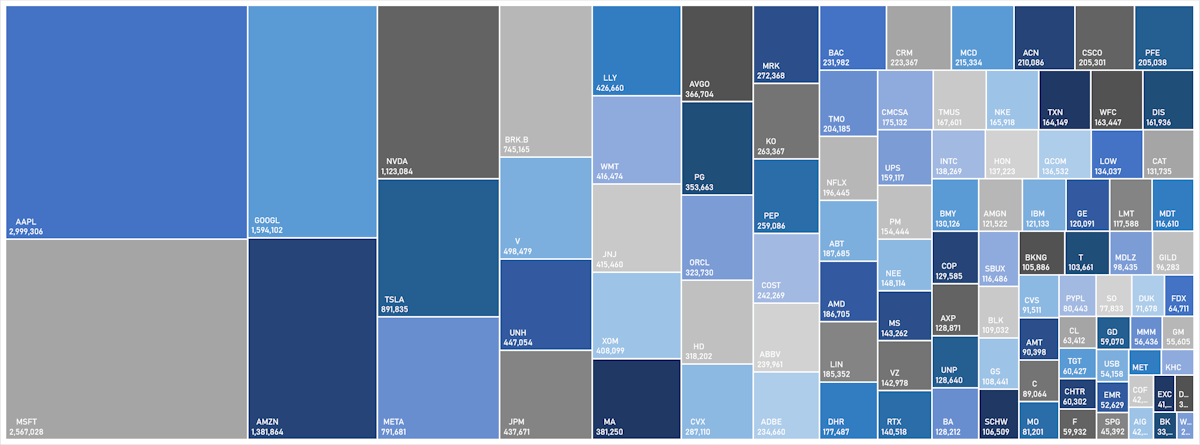
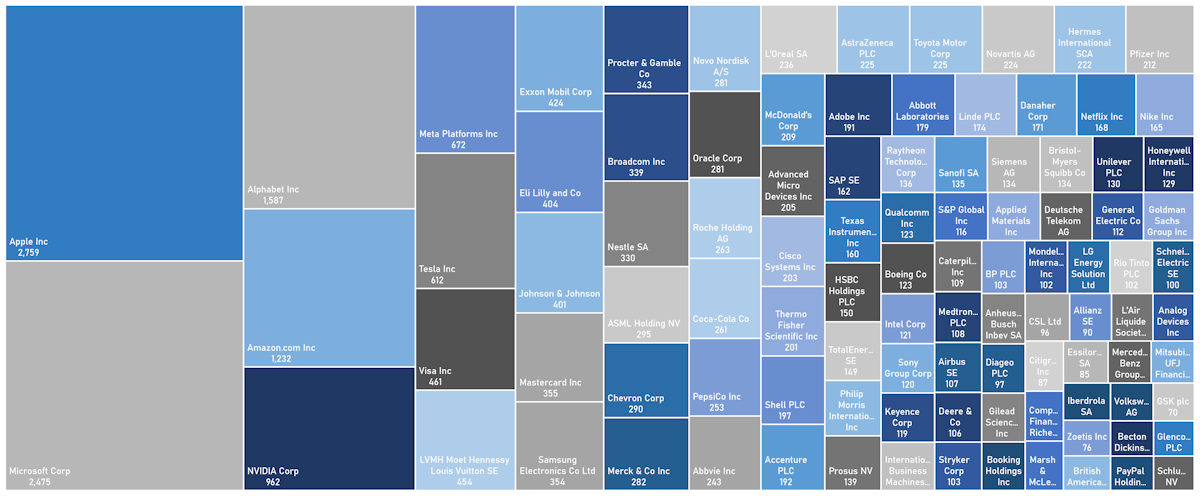
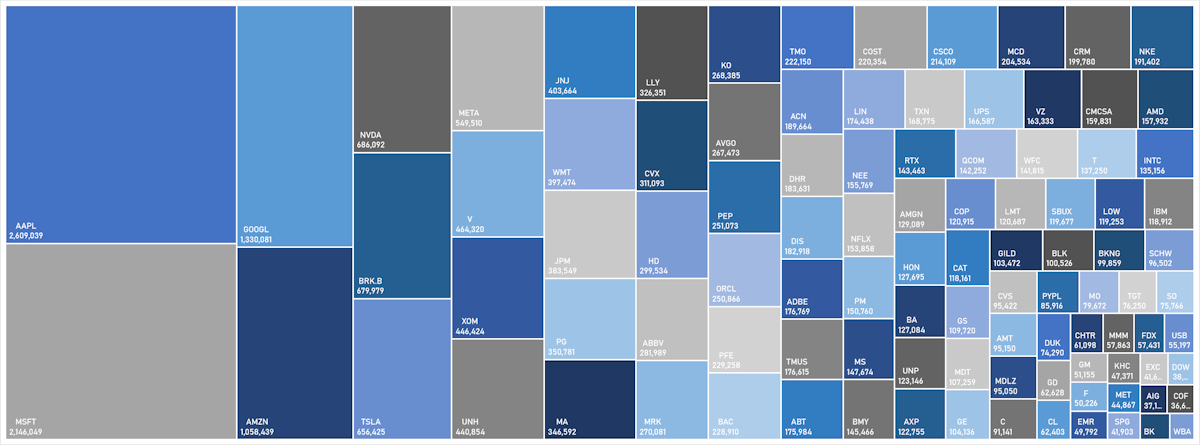
Despite the dispersion of returns across sectors recently, only 6 names (Microsoft, Apple, Nvidia, Google, Amazon, Meta) added up to 84% of the S&P 500's net market cap change this month ($1.1tn)
Equities
US Equities Rose Again This Week, Helped By A Stabilization Of Regional Financials
Despite the possible reversal of recent bearish positioning, we continue to see a challenged path ahead for US equities, with little upside to earnings and valuations
Equities
US Equities Did Relatively Well This Week, Despite A Selloff Ahead Of Potential Weekend Surprises
Defensives and highly liquid stocks outperformed this week, as the downside focus was obviously on weak balance sheets and rates sensitive sectors like regional financials
Equities
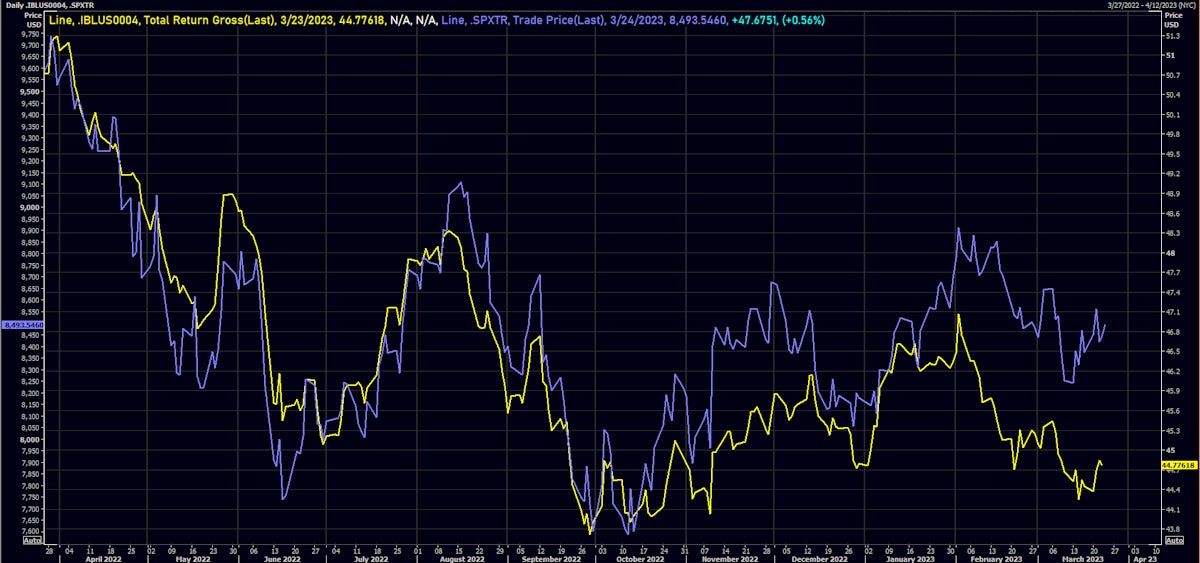
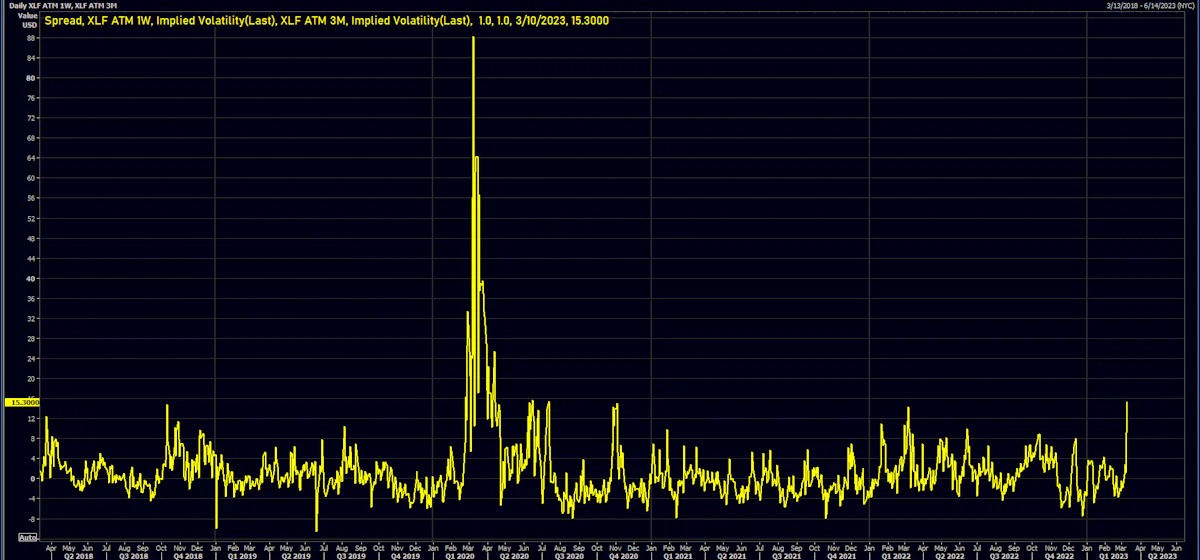
US Equities Had A Difficult Week As Powell And Regional Financials Provide One-Two Punch
The speed at which things got out of hand with SVB is the worry for US regional banks, with short-term implied volatility on financials getting a little panicky while the broader market stays relatively calm
Equities
Broad Rebound For US Equities This Week, Though S&P 500 Ends February Down 2.6%
The story of equities so far this year has been one of resilient revenue, declining margins and expanding valuations on the back of more positive than expected growth; as such, the greatest risk to the market remains that of recession and growth downgrades
Equities
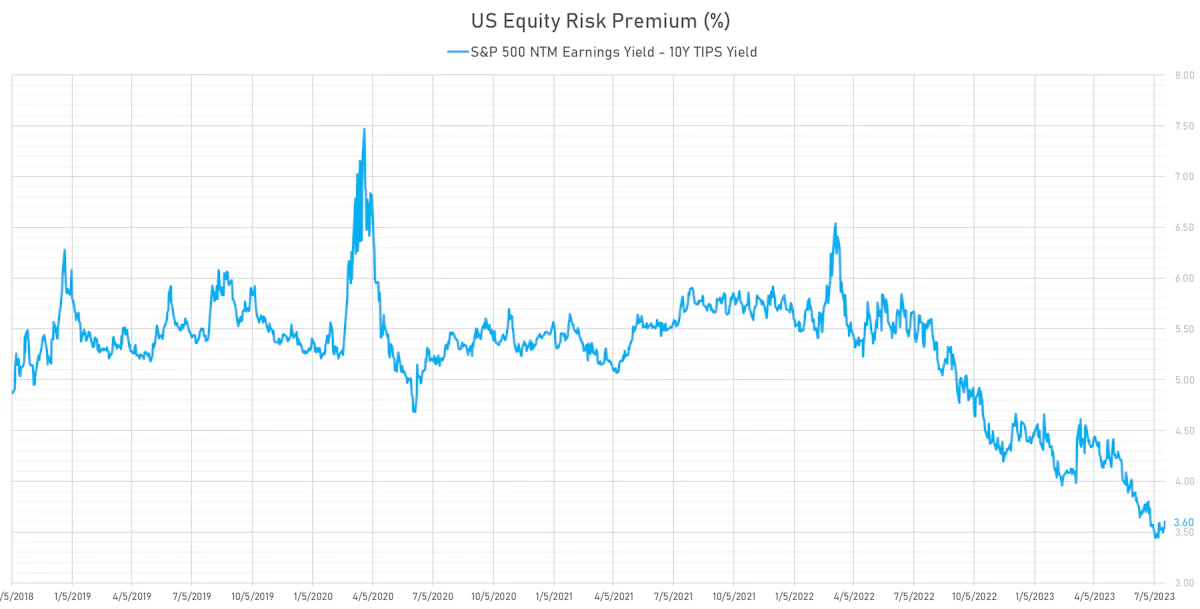
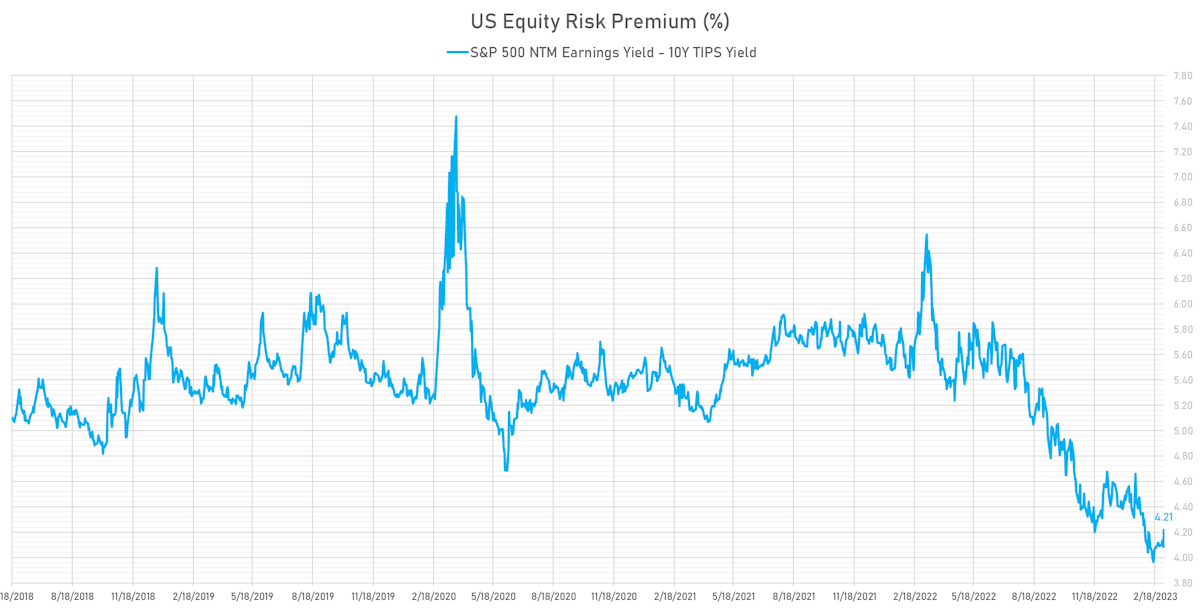
US Valuations Have Come Down Somewhat With Higher Rates, But The Equity Risk Premium Remains Low
In the absence of pressure on risk premia, the story of equities this month has been entirely driven by a shift in the economic narrative, with investors wondering how high rates will need to go for the Fed to achieve a landing
Equities
US Equities Fairly Resilient Through Recent Rates Repricing, But Hard To See A Lot Of Upside Given Current Valuations
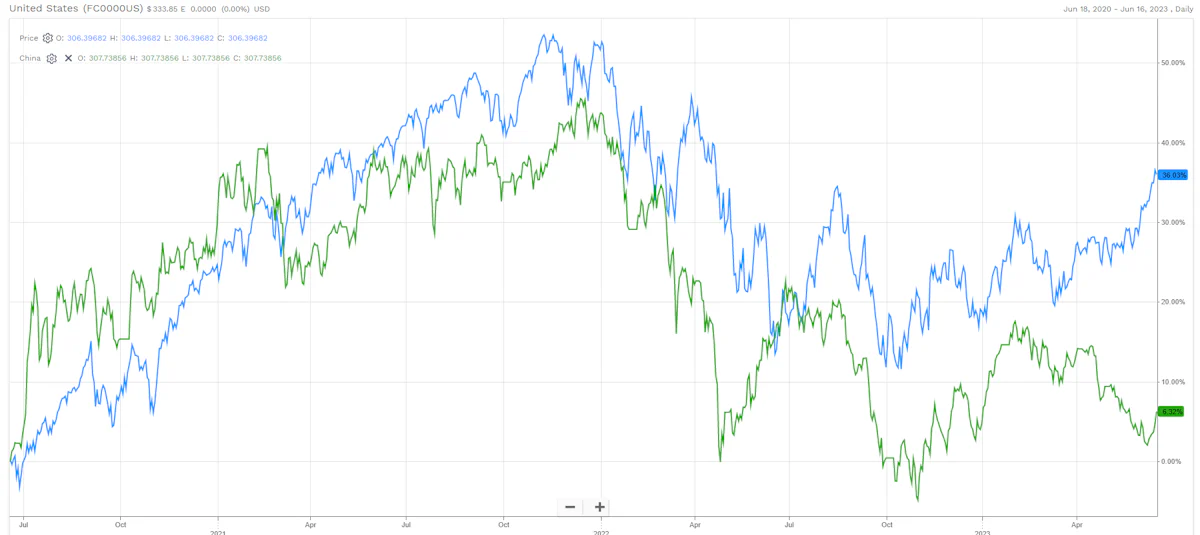
Despite the tremendous rebound in Chinese equities since October, the valuation levels remain reasonable compared to US and European large-cap equivalents
Equities
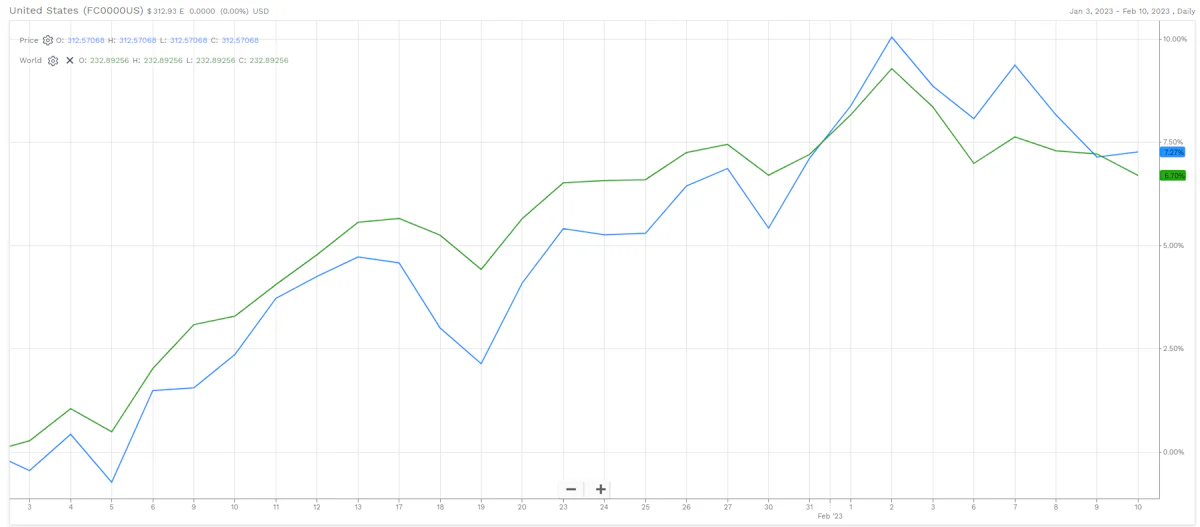
Derisking Ahead Of Much-Awaited CPI Data After US Equities Start The Year Up 10%
Expectations for FY2023 S&P 500 EPS continue to come down: they were around $250 last year and the median estimate now stands at $227 according to S&P Capital IQ (the consensus still sees around 2.5% EPS growth YoY)