Equities
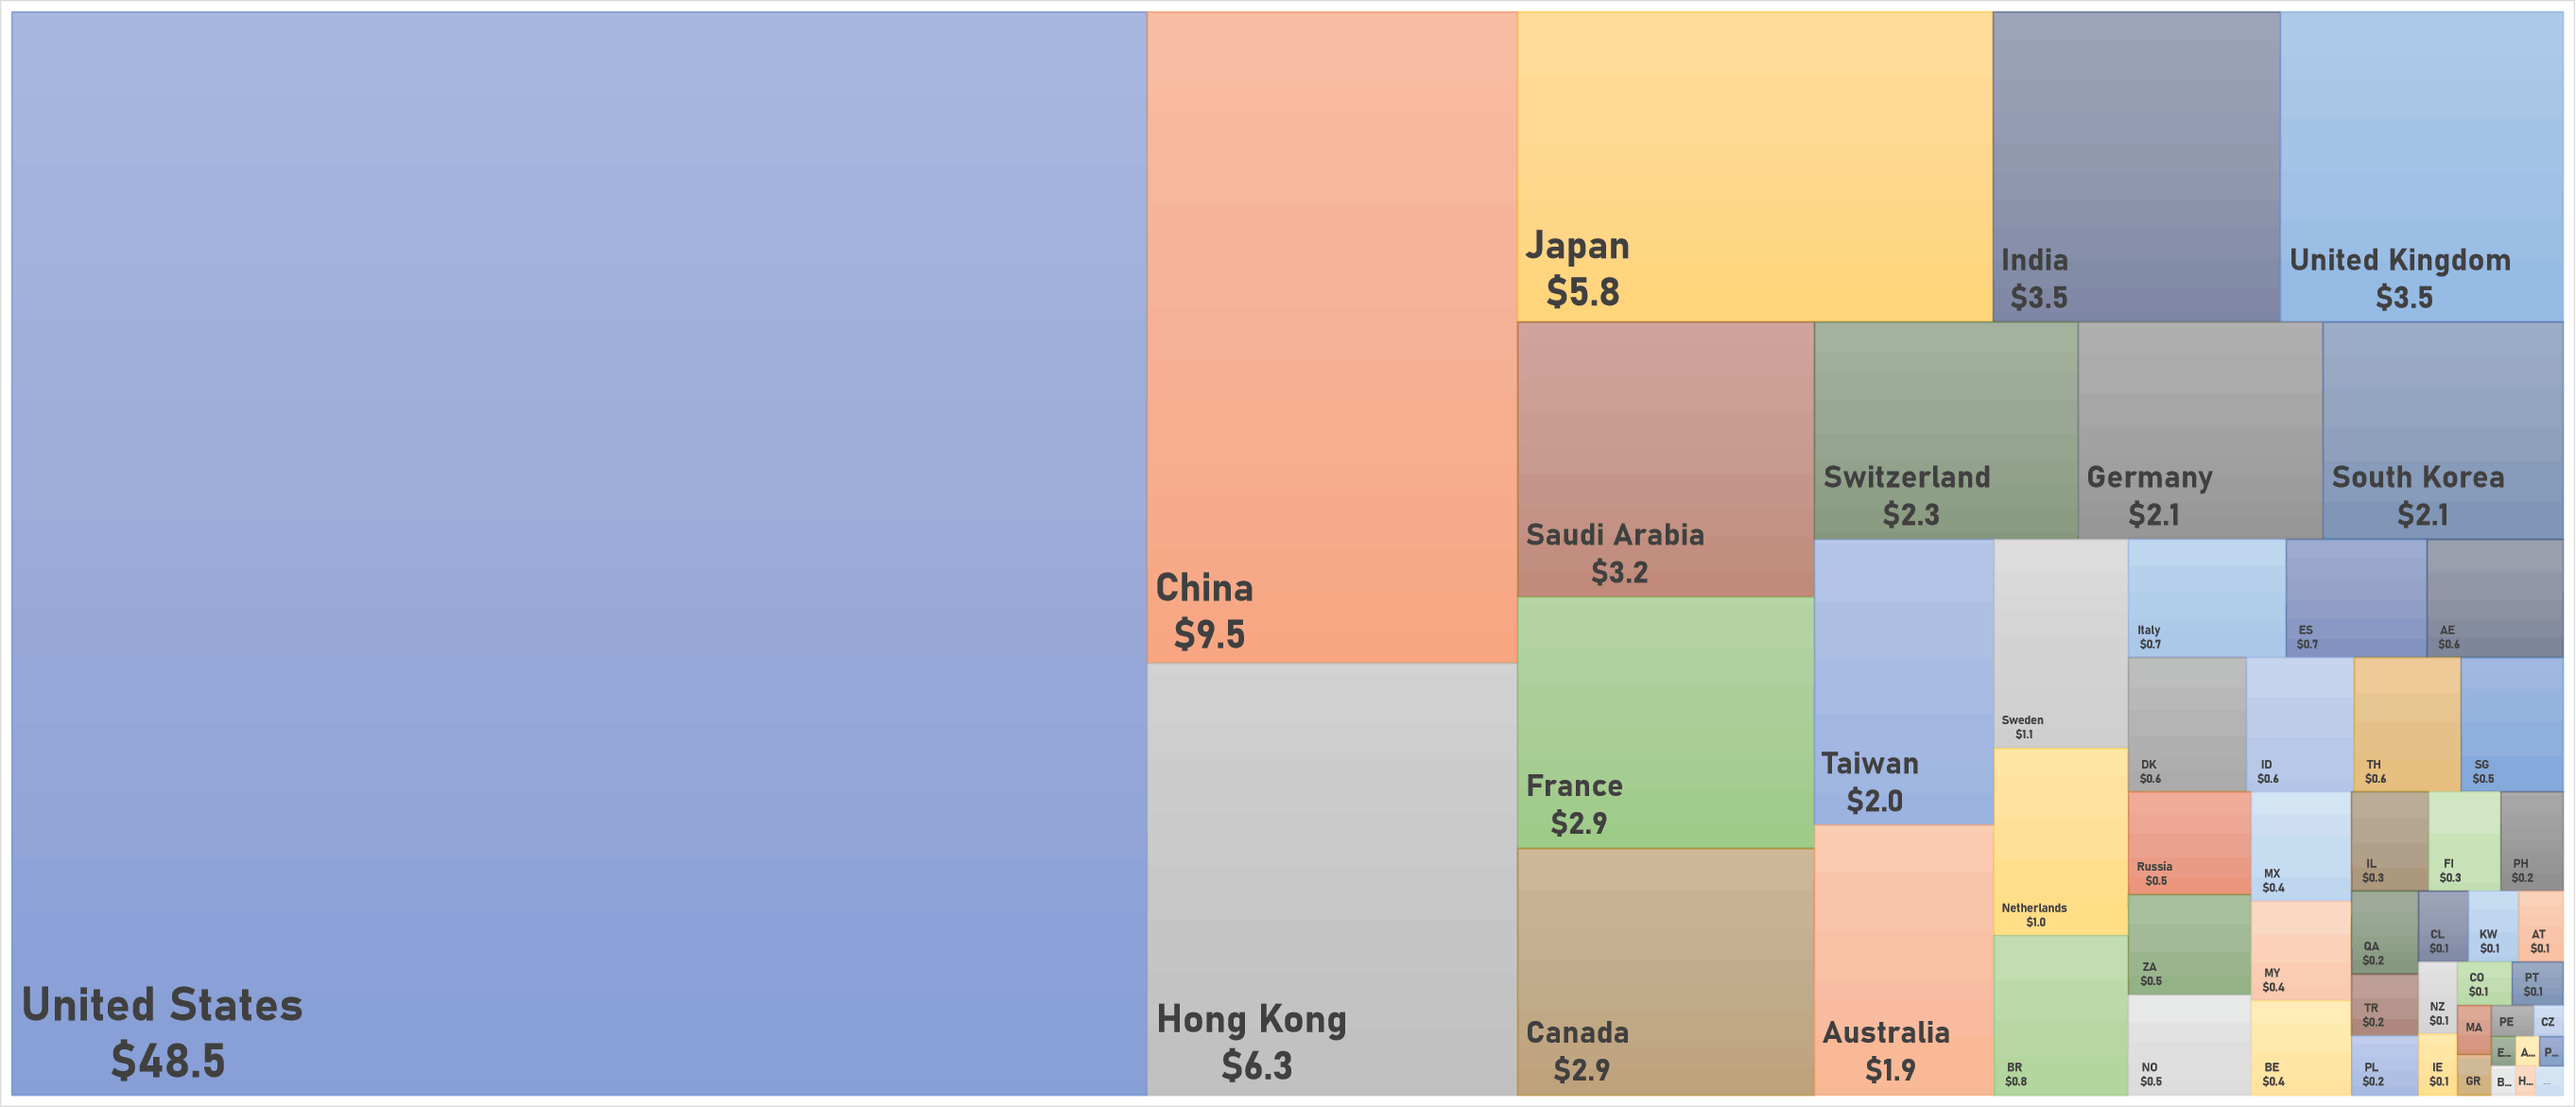
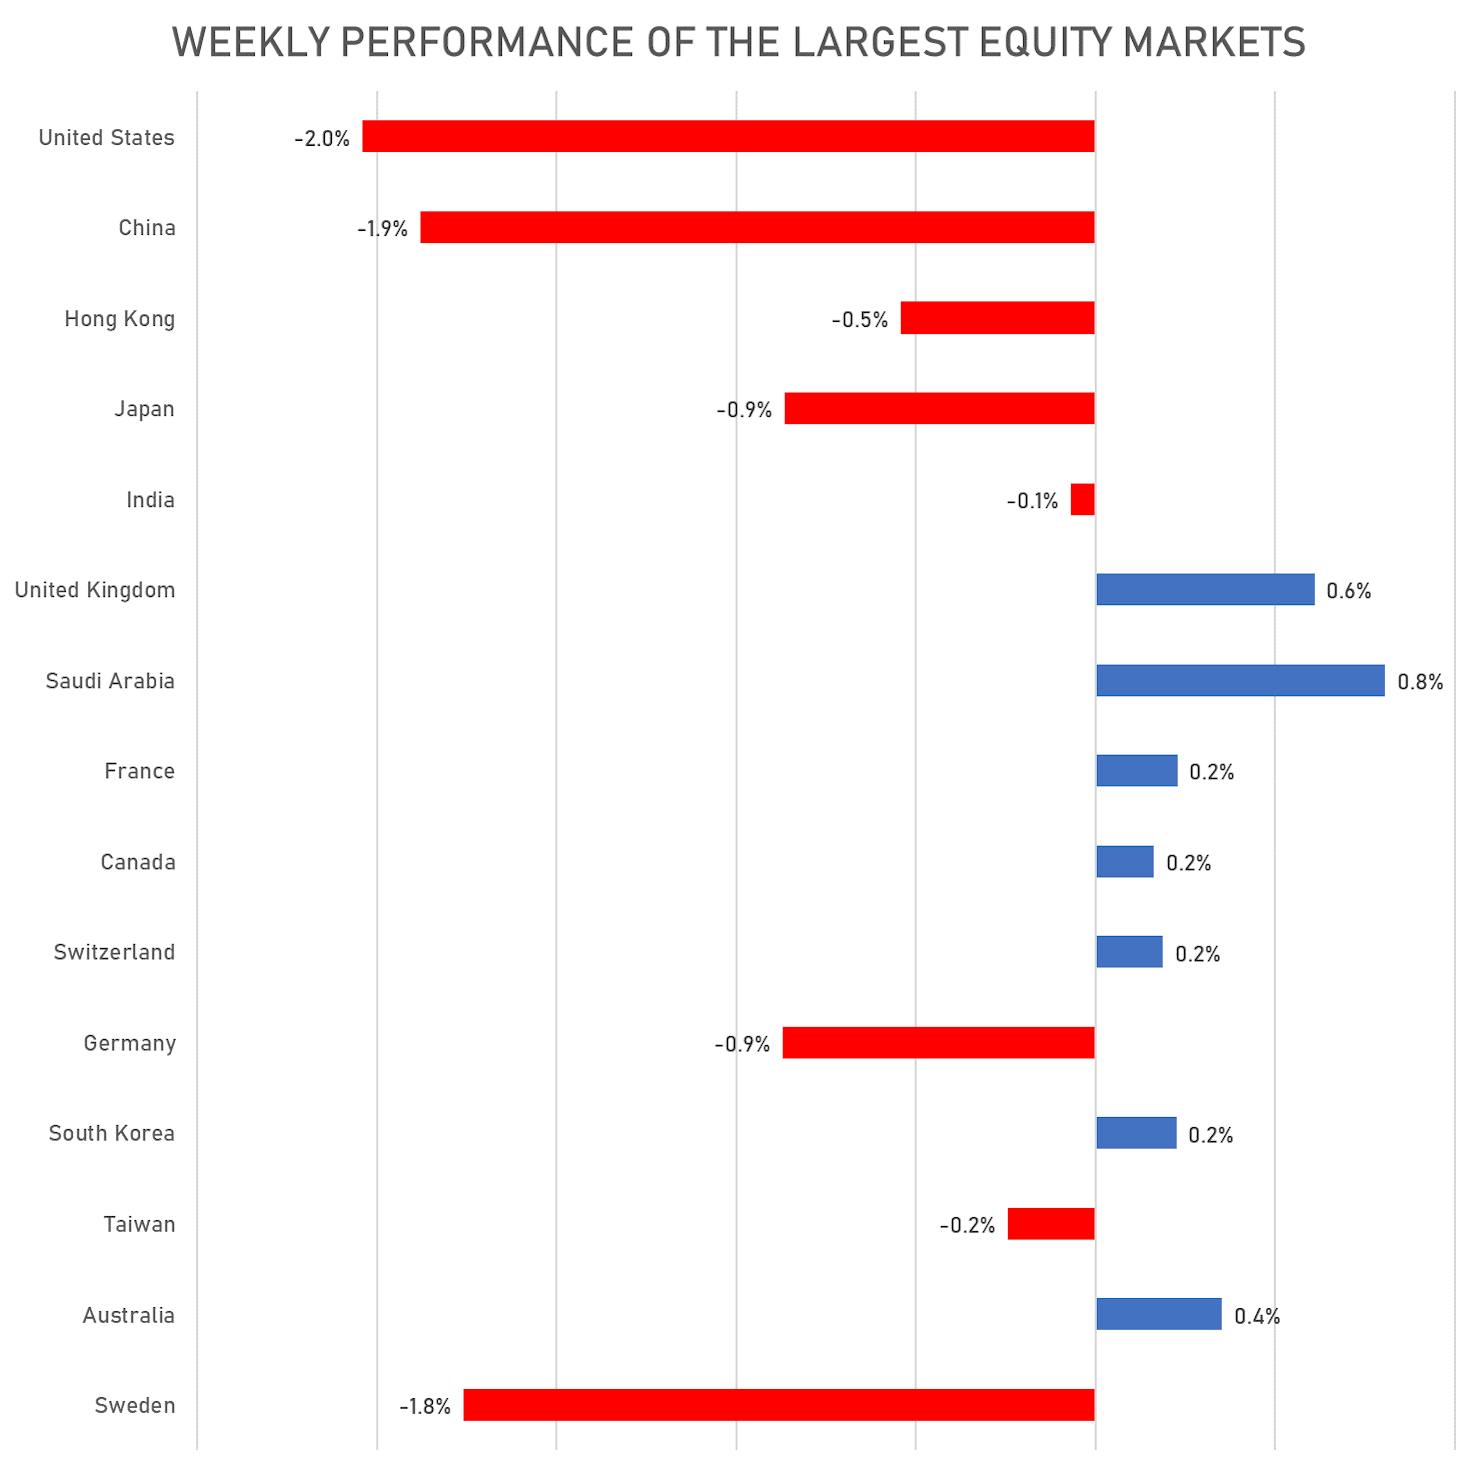
Another Week Of Losses For The Largest Global Equity Markets, With The US Down 2.0% And China+HK Down 1.2%
With higher energy and input costs, we're seeing an unusual divergence so far this quarter in US earnings: EPS are up 5%, with revenue growth of 14% and declining profit margins (which generally doesn't happen with rapidly expanding sales)
Published ET
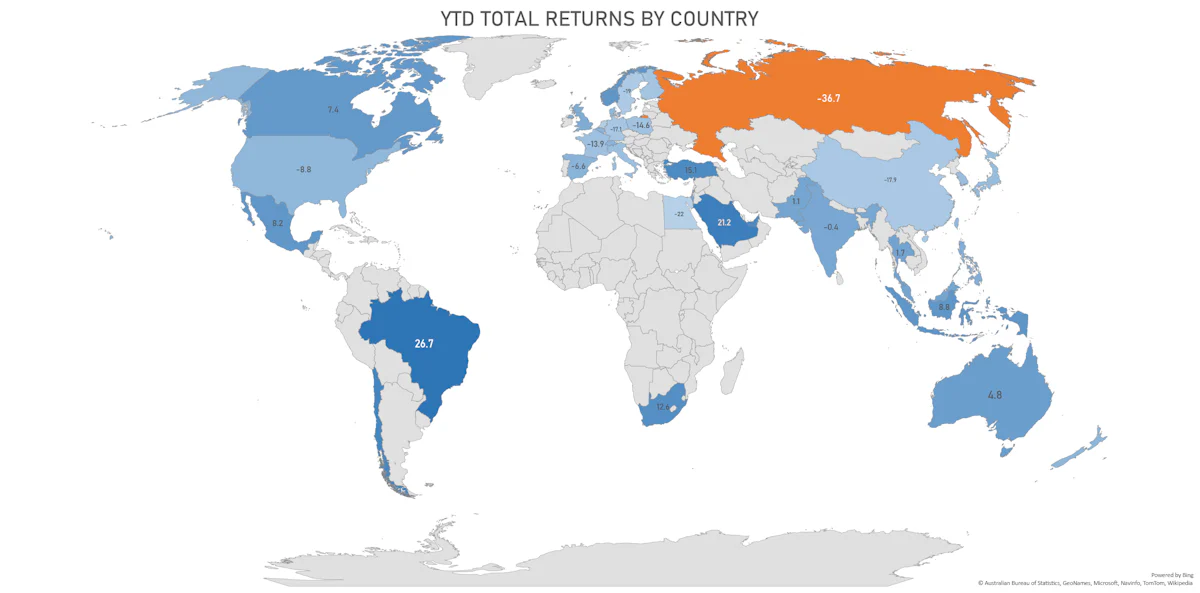
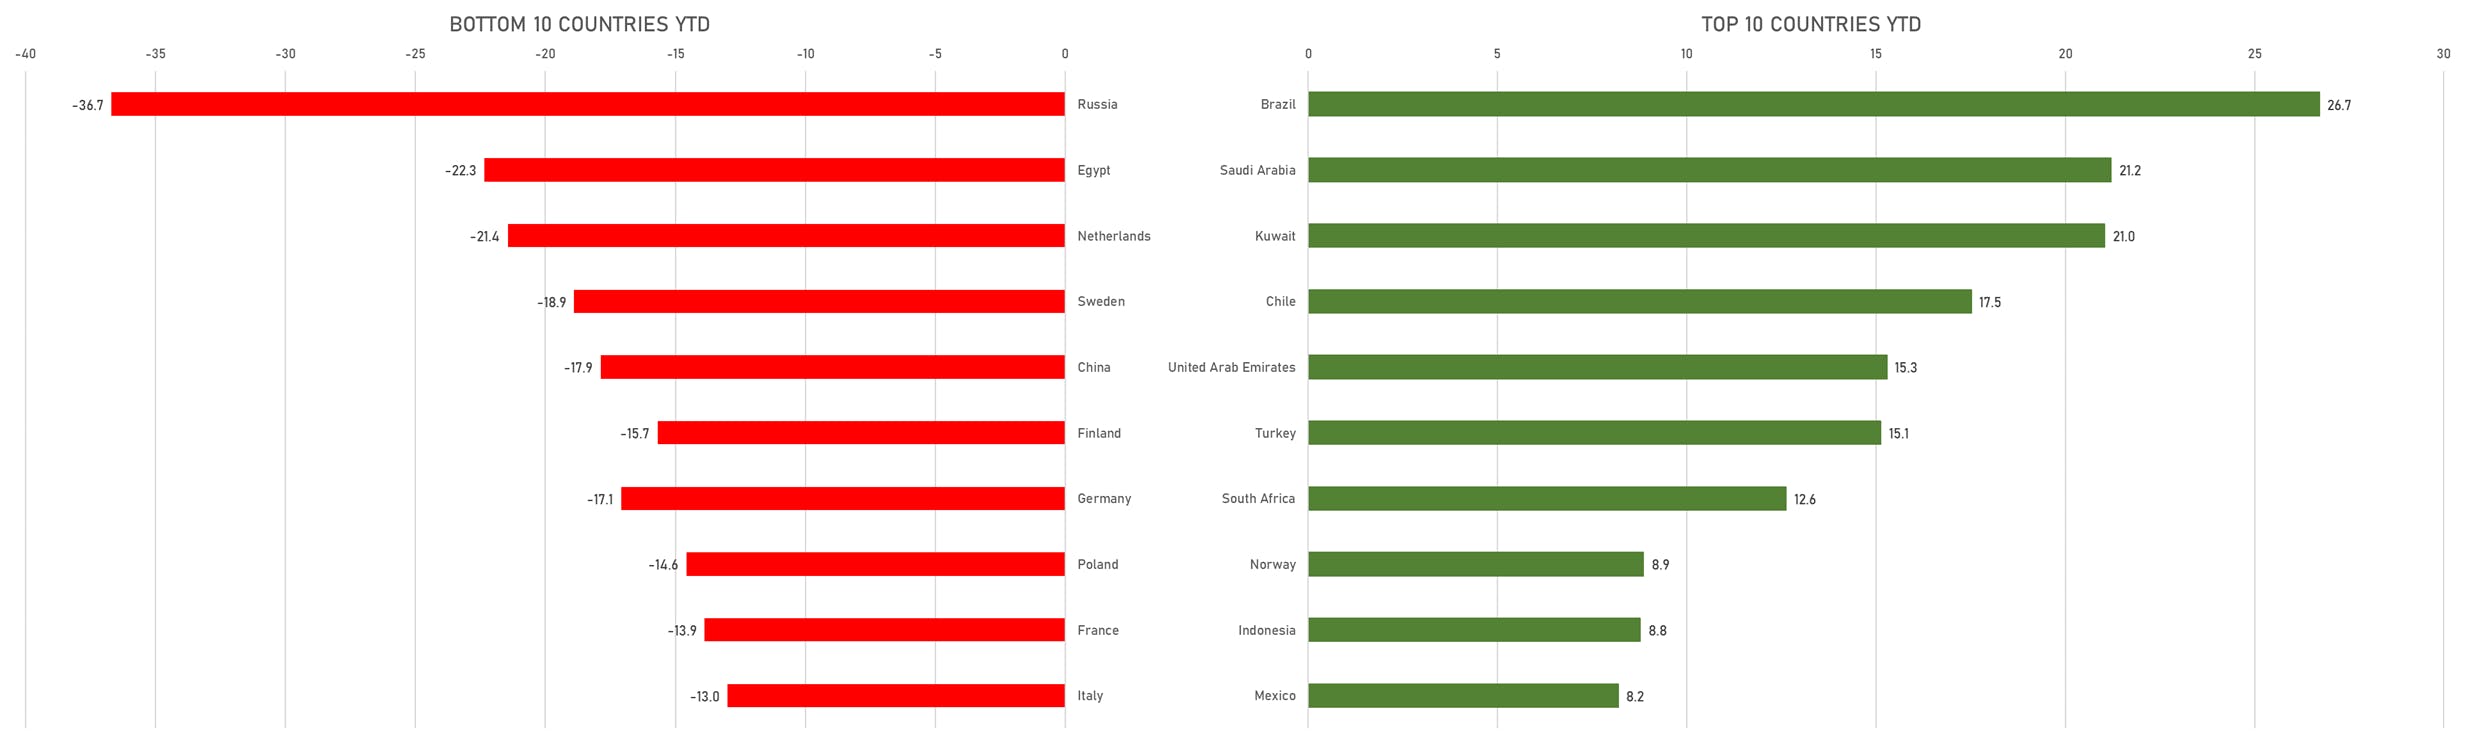
Year-To-Date Total Returns By Country | Sources: ϕpost, FactSet data
QUICK DAILY SUMMARY
- Performance of US indices: S&P 500 down -1.21%; Nasdaq Composite down -2.14%; Wilshire 5000 down -1.21%%
- 33.5% of S&P 500 stocks were up today, with 47.1% of stocks above their 200-day moving average (DMA) and 51.5% above their 50-DMA
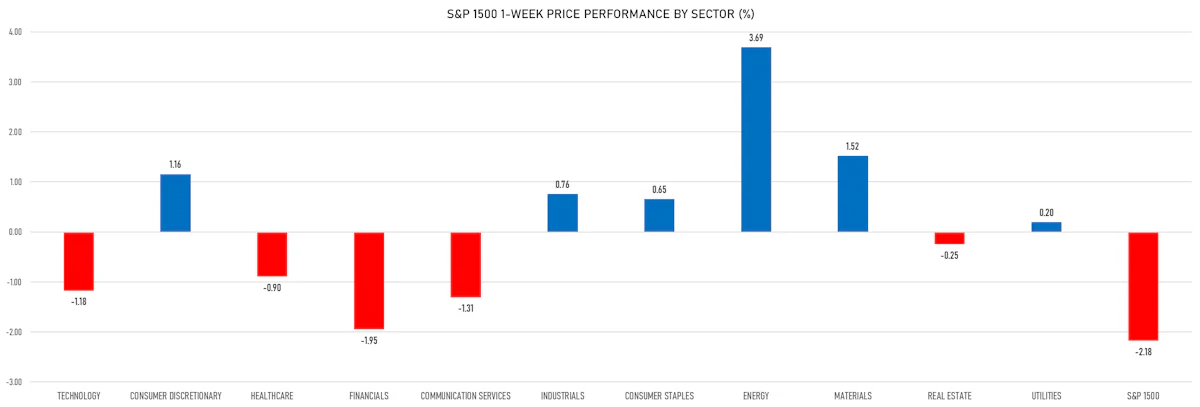
- Top performing sectors in the S&P 500: energy up 0.41% and utilities up 0.01%
- Bottom performing sectors in the S&P 500: technology down -2.45% and communication services down -1.82%
- The number of shares in the S&P 500 traded today was 692m for a total turnover of US$ 81 bn
- The S&P 500 Value Index was down -0.4%, while the S&P 500 Growth Index was down -2.1%; the S&P small caps index was down -0.7% and mid-caps were down -0.6%
- The volume on CME's INX (S&P 500 Index) was 2.5m (3-month z-score: -0.5); the 3-month average volume is 2.7m and the 12-month range is 1.3 - 4.6m
- Daily performance of international indices: Europe Stoxx 600 down 0.00%; UK FTSE 100 up 0.47%; Hang Seng SH-SZ-HK 300 Index down -0.06%; Japan's TOPIX 500 down -0.60%
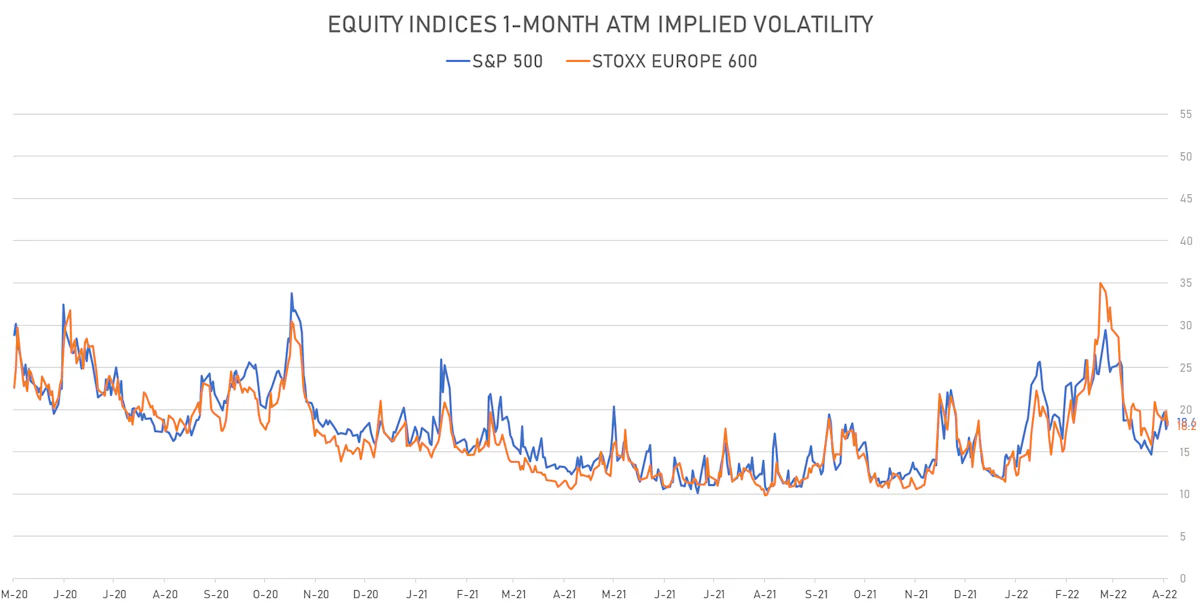
VOLATILITY
- 1-month at-the-money implied volatility on the S&P 500 at 18.6%, up from 17.7%
- 1-month at-the-money implied volatility on the Europe Stoxx 600 at 18.2%, down from 19.8%
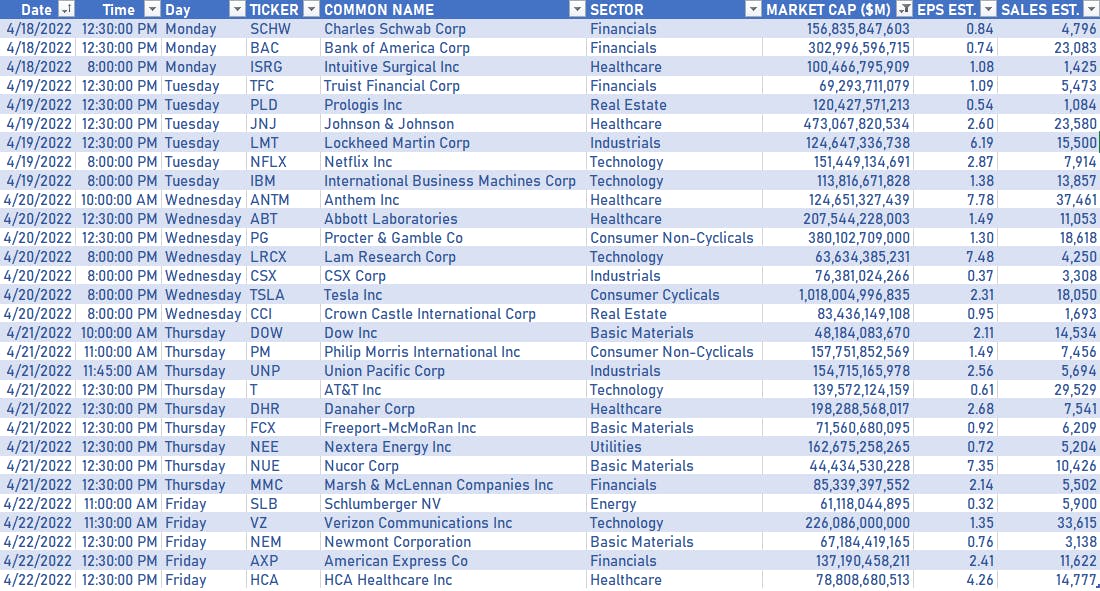
US EARNINGS IN THE WEEK AHEAD
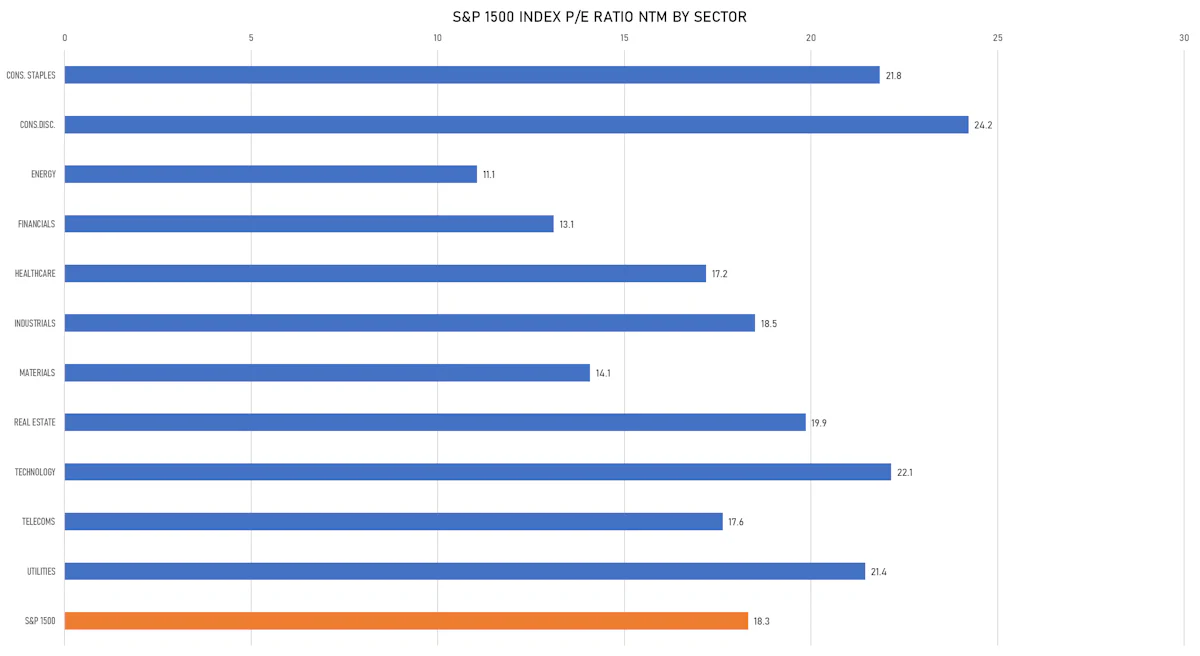
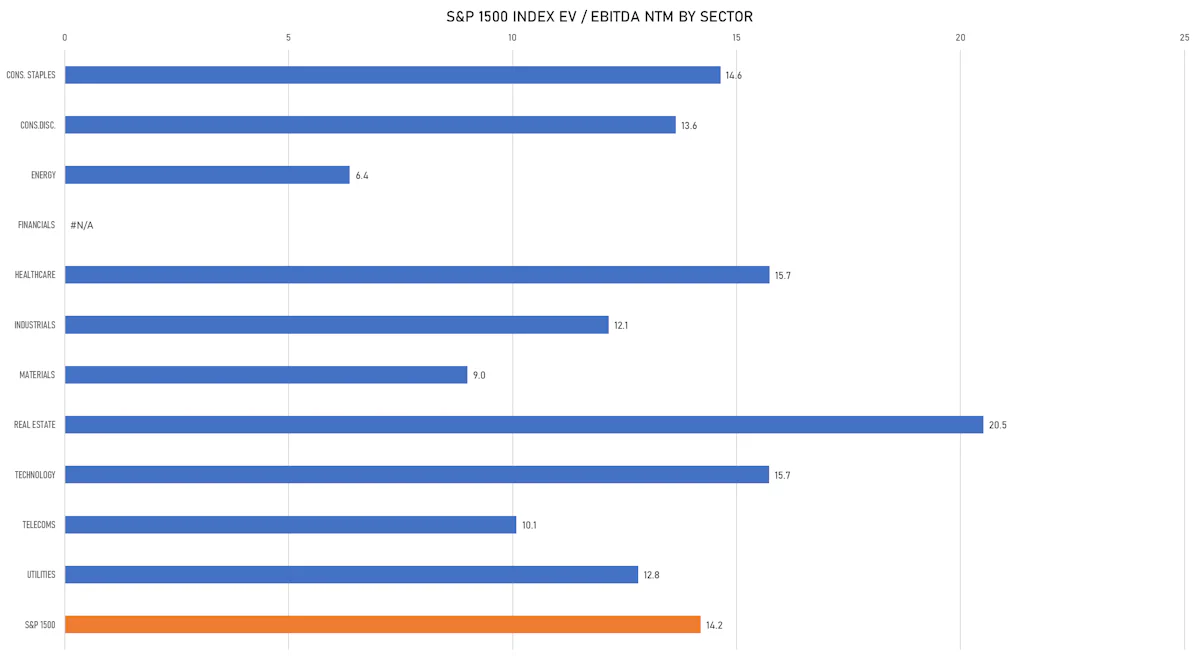
VALUATION MULTIPLES BY SECTORS
WEEKLY PERFORMANCE OF THE LARGEST GLOBAL MARKETS
TOP / BOTTOM PERFORMING COUNTRIES THIS YEAR
WORLD MARKET CAP, BROKEN DOWN BY COUNTRY