Equities
US Equities Keep Rising With Improved Breadth, Though Some Tactical Signals Point To Froth
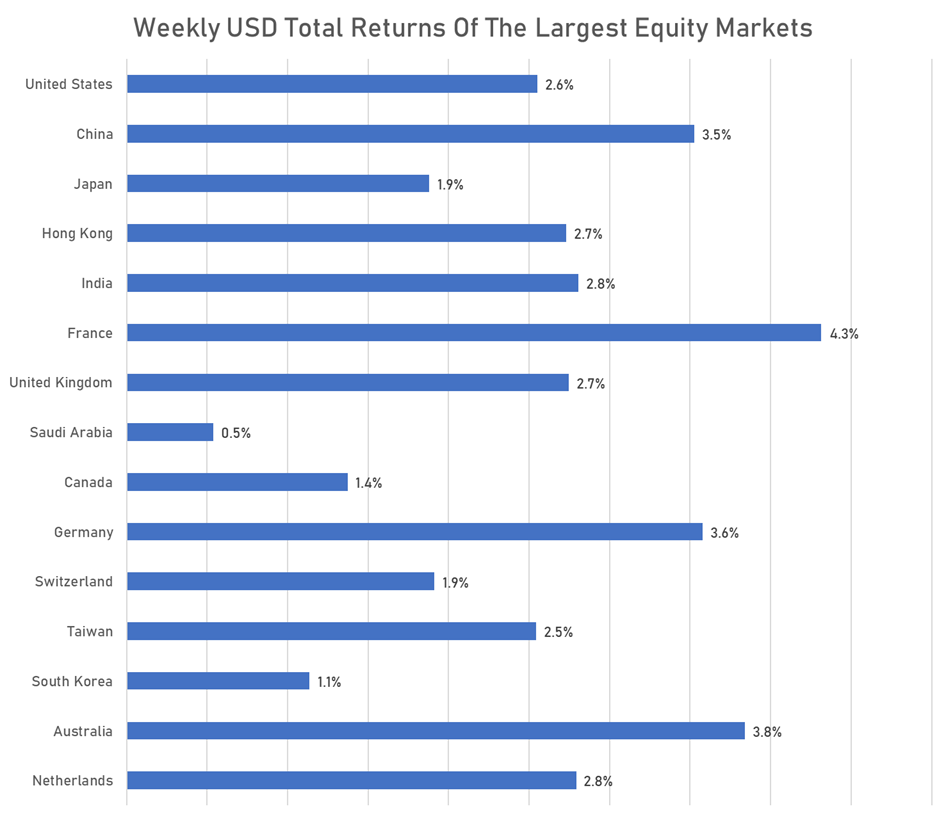
Easy to overlook after months of underperformance, Chinese equities have done well over the past week, generating US$ total returns of 4.3% (vs 2.6% for US equities)
Published ET
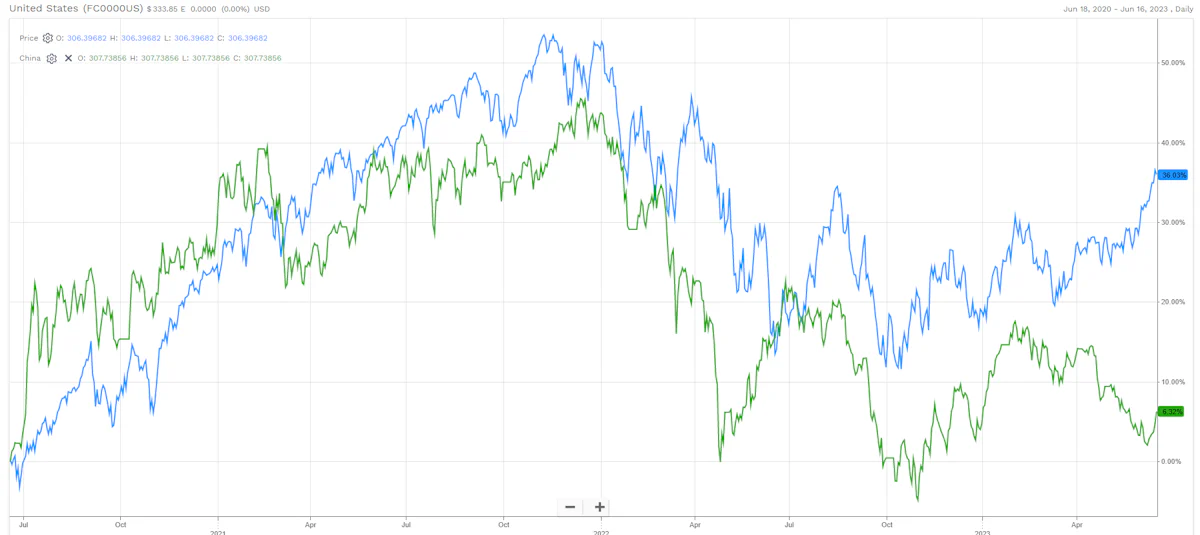
FactSet US vs China USD Total Returns Over The Past 3 Years | Source: FactSet
DAILY SUMMARY
- Daily performance of US indices: S&P 500 down -0.37%; Nasdaq Composite down -0.68%; Wilshire 5000 down -0.05%
- 43.3% of S&P 500 stocks were up today, with 61.2% of stocks above their 200-day moving average (DMA) and 68.0% above their 50-DMA
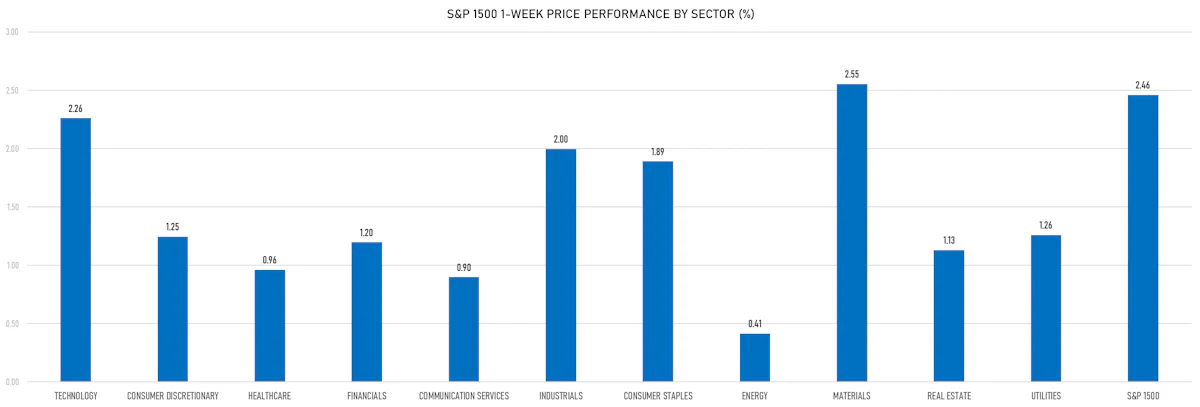
- Top performing sectors in the S&P 500: utilities up 0.53% and materials up 0.11%
- Bottom performing sectors in the S&P 500: communication services down -1.00% and technology down -0.83%
- The number of shares in the S&P 500 traded today was 2046m for a total turnover of US$ 211 bn
- The S&P 500 Value Index Index was down -0.3%, while the S&P 500 Growth Index Index was down -0.4%; the S&P small caps index was down -0.4% and mid caps were down -0.4%
- The volume on CME's INX (S&P 500 Index) was 4195.4m (3-month z-score: 4.1); the 3-month average volume is 2506.6m and the 12-month range is 903.0 - 5761.3m
- Daily performance of international indices: Europe Stoxx 600 up 0.53%; UK FTSE 100 up 0.19%; Hang Seng SH-SZ-HK 300 Index up 0.91%; Japan's TOPIX 500 up 0.26%
VOLATILITY TODAY
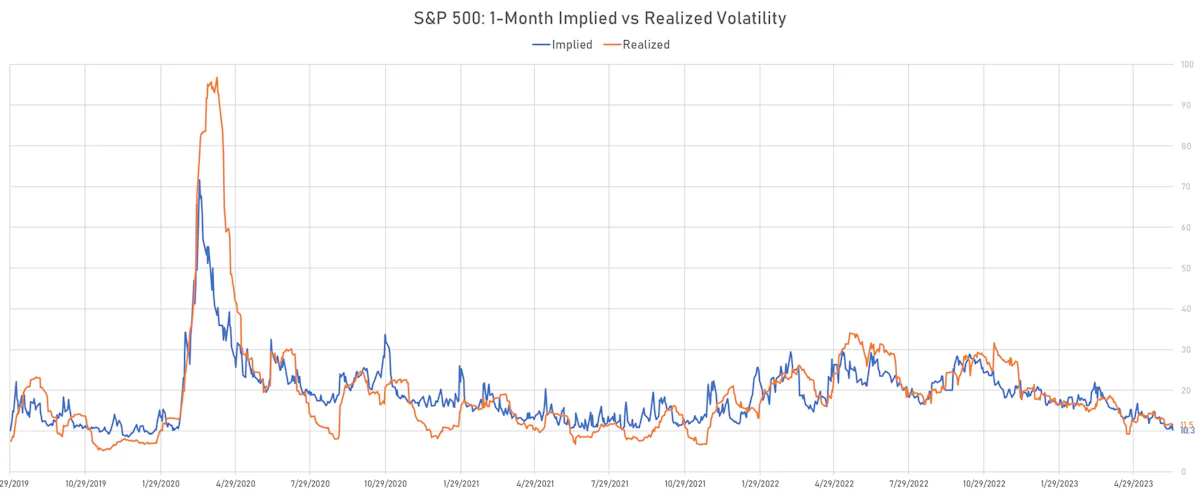
- 3-month at-the-money implied volatility on the S&P 500 at 10.3%, down from 11.7%
- 3-month at-the-money implied volatility on the STOXX Europe 600 at 9.5%, down from 9.5%
TOP WINNERS TODAY
- Bitdeer Technologies Group (BTDR), up 50.9% to $11.41 / 12-Month Price Range: $ 4.60-14.75 / Short interest (% of float): 0.3%; days to cover: 1.3
- TMC the metals company Inc (TMC), up 24.5% to $1.37 / YTD price return: +77.9% / 12-Month Price Range: $ 0.51-1.61 / Short interest (% of float): 3.6%; days to cover: 8.1
- nCino Inc (NCNO), up 24.5% to $31.69 / YTD price return: +19.9% / 12-Month Price Range: $ 19.58-39.83 / Short interest (% of float): 7.1%; days to cover: 10.2
- Cipher Mining Inc (CIFR), up 22.5% to $3.05 / YTD price return: +444.6% / 12-Month Price Range: $ 0.38-3.32 / Short interest (% of float): 22.3%; days to cover: 9.1
- iRobot Corp (IRBT), up 21.2% to $51.00 / YTD price return: +6.0% / 12-Month Price Range: $ 31.37-60.25 / Short interest (% of float): 11.0%; days to cover: 6.2
- Lanzatech Global Inc (LNZA), up 19.9% to $5.30 / YTD price return: -46.9% / 12-Month Price Range: $ 2.63-10.80 / Short interest (% of float): 0.1%; days to cover: 1.7
- Abcam PLC (ABCM), up 17.1% to $22.31 / YTD price return: +43.4% / 12-Month Price Range: $ 12.48-22.31 / Short interest (% of float): 0.5%; days to cover: 1.1
- Zura Bio Ltd (ZURA), up 16.7% to $9.48 / YTD price return: -7.1% / 12-Month Price Range: $ 4.87-37.55 / Short interest (% of float): 2.9%; days to cover: 0.2
- Virgin Galactic Holdings Inc (SPCE), up 16.5% to $4.73 / YTD price return: +35.9% / 12-Month Price Range: $ 2.98-8.56
- Peakstone Realty Trust (PKST), up 14.3% to $39.65 / 12-Month Price Range: $ 8.00-47.00 / Short interest (% of float): 0.3%; days to cover: 0.4
BIGGEST LOSERS TODAY
- Coherus BioSciences Inc (CHRS), down 23.4% to $4.13 / YTD price return: -47.9% / 12-Month Price Range: $ 3.60-14.11 / Short interest (% of float): 14.5%; days to cover: 5.5 (the stock is currently on the short sale restriction list)
- Duff & Phelps Utility and Infrastructure Fund Inc (DPG), down 20.4% to $10.13 / YTD price return: -25.0% / 12-Month Price Range: $ 10.13-15.59 / Short interest (% of float): 0.3%; days to cover: 2.0 (the stock is currently on the short sale restriction list)
- Lyell Immunopharma Inc (LYEL), down 17.4% to $3.19 / YTD price return: -8.1% / 12-Month Price Range: $ 1.77-8.74 / Short interest (% of float): 10.7%; days to cover: 21.1 (the stock is currently on the short sale restriction list)
- Orchestra Biomed Holdings Inc (OBIO), down 16.3% to $9.13 / YTD price return: -8.5% / 12-Month Price Range: $ 7.49-23.39 / Short interest (% of float): 1.0%; days to cover: 4.1 (the stock is currently on the short sale restriction list)
- Gracell Biotechnologies Inc (GRCL), down 15.9% to $4.91 / YTD price return: +113.5% / 12-Month Price Range: $ 1.40-6.99 / Short interest (% of float): 0.5%; days to cover: 1.7 (the stock is currently on the short sale restriction list)
- Nikola Corp (NKLA), down 15.0% to $1.19 / YTD price return: -44.9% / 12-Month Price Range: $ .52-8.97 / Short interest (% of float): 18.3%; days to cover: 3.5 (the stock is currently on the short sale restriction list)
- Lottery.com Inc (LTRY), down 15.0% to $.22 / YTD price return: +25.2% / 12-Month Price Range: $ .08-1.38 / Short interest (% of float): 2.6%; days to cover: 0.6 (the stock is currently on the short sale restriction list)
- Olema Pharmaceuticals Inc (OLMA), down 13.7% to $7.84 / YTD price return: +220.0% / 12-Month Price Range: $ 2.19-9.87 / Short interest (% of float): 2.7%; days to cover: 5.7 (the stock is currently on the short sale restriction list)
- Genesis Growth Tech Acquisition Corp (GGAA), down 13.4% to $11.61 / YTD price return: +12.1% / 12-Month Price Range: $ 9.99-27.37 / Short interest (% of float): 0.0%; days to cover: 0.1 (the stock is currently on the short sale restriction list)
- Amyris Inc (AMRS), down 12.3% to $1.14 / YTD price return: -25.5% / 12-Month Price Range: $ .55-4.86 / Short interest (% of float): 25.2%; days to cover: 11.9 (the stock is currently on the short sale restriction list)
TOP S&P 500 PERFORMERS THIS WEEK
- Carnival Corp (CCL), up 20.7% to $15.80 / YTD price return: +96.0% / 12-Month Price Range: $ 6.12-16.16 / Short interest (% of float): 11.8%; days to cover: 3.6
- Intel Corp (INTC), up 16.0% to $36.37 / YTD price return: +37.6% / 12-Month Price Range: $ 24.59-40.73 / Short interest (% of float): 1.6%; days to cover: 1.5
- Estee Lauder Companies Inc (EL), up 15.5% to $203.95 / YTD price return: -17.8% / 12-Month Price Range: $ 175.15-284.27 / Short interest (% of float): 18.7%; days to cover: 1.3
- Oracle Corp (ORCL), up 14.2% to $125.46 / YTD price return: +53.5% / 12-Month Price Range: $ 60.79-127.54 / Short interest (% of float): 1.0%; days to cover: 2.1
- Catalent Inc (CTLT), up 13.7% to $44.11 / YTD price return: -2.0% / 12-Month Price Range: $ 31.49-115.26
- Southwest Airlines Co (LUV), up 11.9% to $34.25 / YTD price return: +1.7% / 12-Month Price Range: $ 28.40-41.76
- Norwegian Cruise Line Holdings Ltd (NCLH), up 11.4% to $19.13 / YTD price return: +56.3% / 12-Month Price Range: $ 10.31-19.68 / Short interest (% of float): 10.5%; days to cover: 3.1
- Hewlett Packard Enterprise Co (HPE), up 11.3% to $17.57 / YTD price return: +10.1% / 12-Month Price Range: $ 11.91-17.57
- Domino's Pizza Inc (DPZ), up 11.2% to $331.41 / YTD price return: -4.3% / 12-Month Price Range: $ 285.90-425.59
- Ball Corp (BALL), up 11.1% to $58.43 / YTD price return: +14.3% / 12-Month Price Range: $ 46.01-74.35 / Short interest (% of float): 5.5%; days to cover: 10.4
BOTTOM S&P 500 PERFORMERS THIS WEEK
- Humana Inc (HUM), down 13.2% to $445.65 / YTD price return: -13.0% / 12-Month Price Range: $ 419.18-571.30
- Nasdaq Inc (NDAQ), down 11.4% to $51.22 / YTD price return: -16.5% / 12-Month Price Range: $ 48.91-69.21 / Short interest (% of float): 1.2%; days to cover: 1.7
- Bath & Body Works Inc (BBWI), down 7.8% to $38.95 / YTD price return: -7.6% / 12-Month Price Range: $ 25.80-49.54 / Short interest (% of float): 3.9%; days to cover: 2.4
- Warner Bros Discovery Inc (WBD), down 7.5% to $12.80 / YTD price return: +35.0% / 12-Month Price Range: $ 8.83-17.65 / Short interest (% of float): 4.2%; days to cover: 4.7
- Zions Bancorporation NA (ZION), down 7.3% to $28.63 / YTD price return: -41.8% / 12-Month Price Range: $ 18.26-59.74 / Short interest (% of float): 9.1%; days to cover: 1.7
- UnitedHealth Group Inc (UNH), down 7.1% to $458.49 / YTD price return: -13.5% / 12-Month Price Range: $ 445.82-558.10
- KeyCorp (KEY), down 7.0% to $9.93 / YTD price return: -43.0% / 12-Month Price Range: $ 8.54-20.30
- Elevance Health Inc (ELV), down 5.7% to $443.21 / YTD price return: -13.6% / 12-Month Price Range: $ 429.87-549.35
- CVS Health Corp (CVS), down 5.6% to $67.72 / YTD price return: -27.3% / 12-Month Price Range: $ 66.36-107.24
- Centene Corp (CNC), down 4.8% to $65.66 / YTD price return: -19.9% / 12-Month Price Range: $ 61.35-98.52
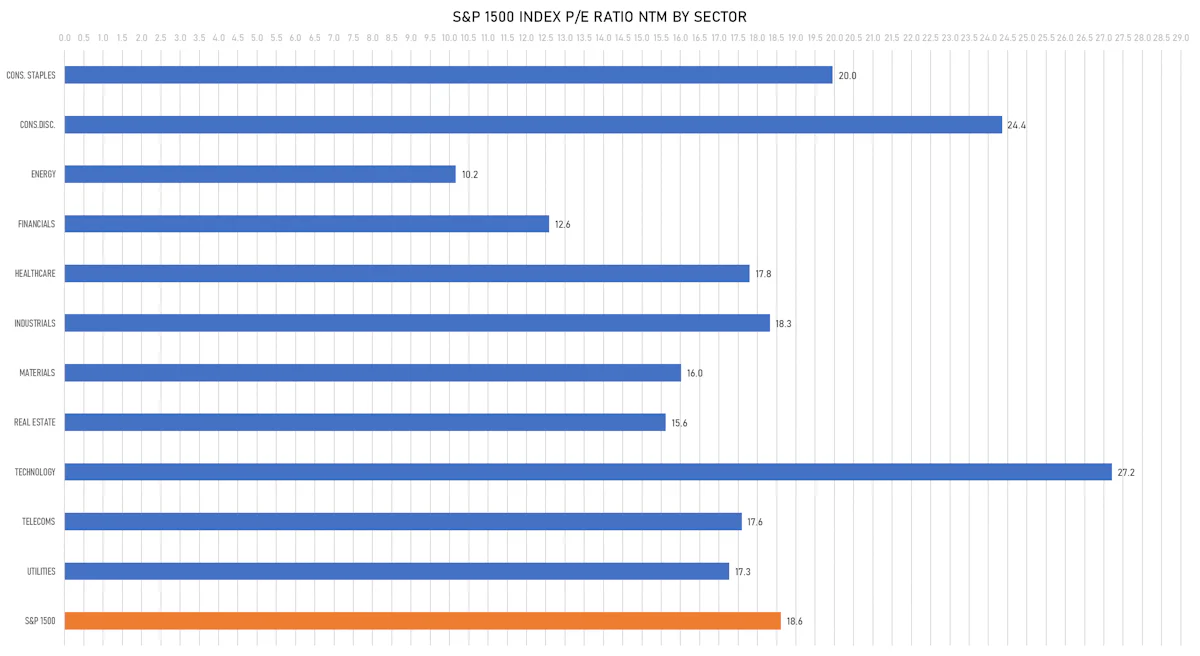
VALUATION MULTIPLES BY SECTORS
WEEKLY TOTAL RETURNS OF MAJOR GLOBAL EQUITY MARKETS
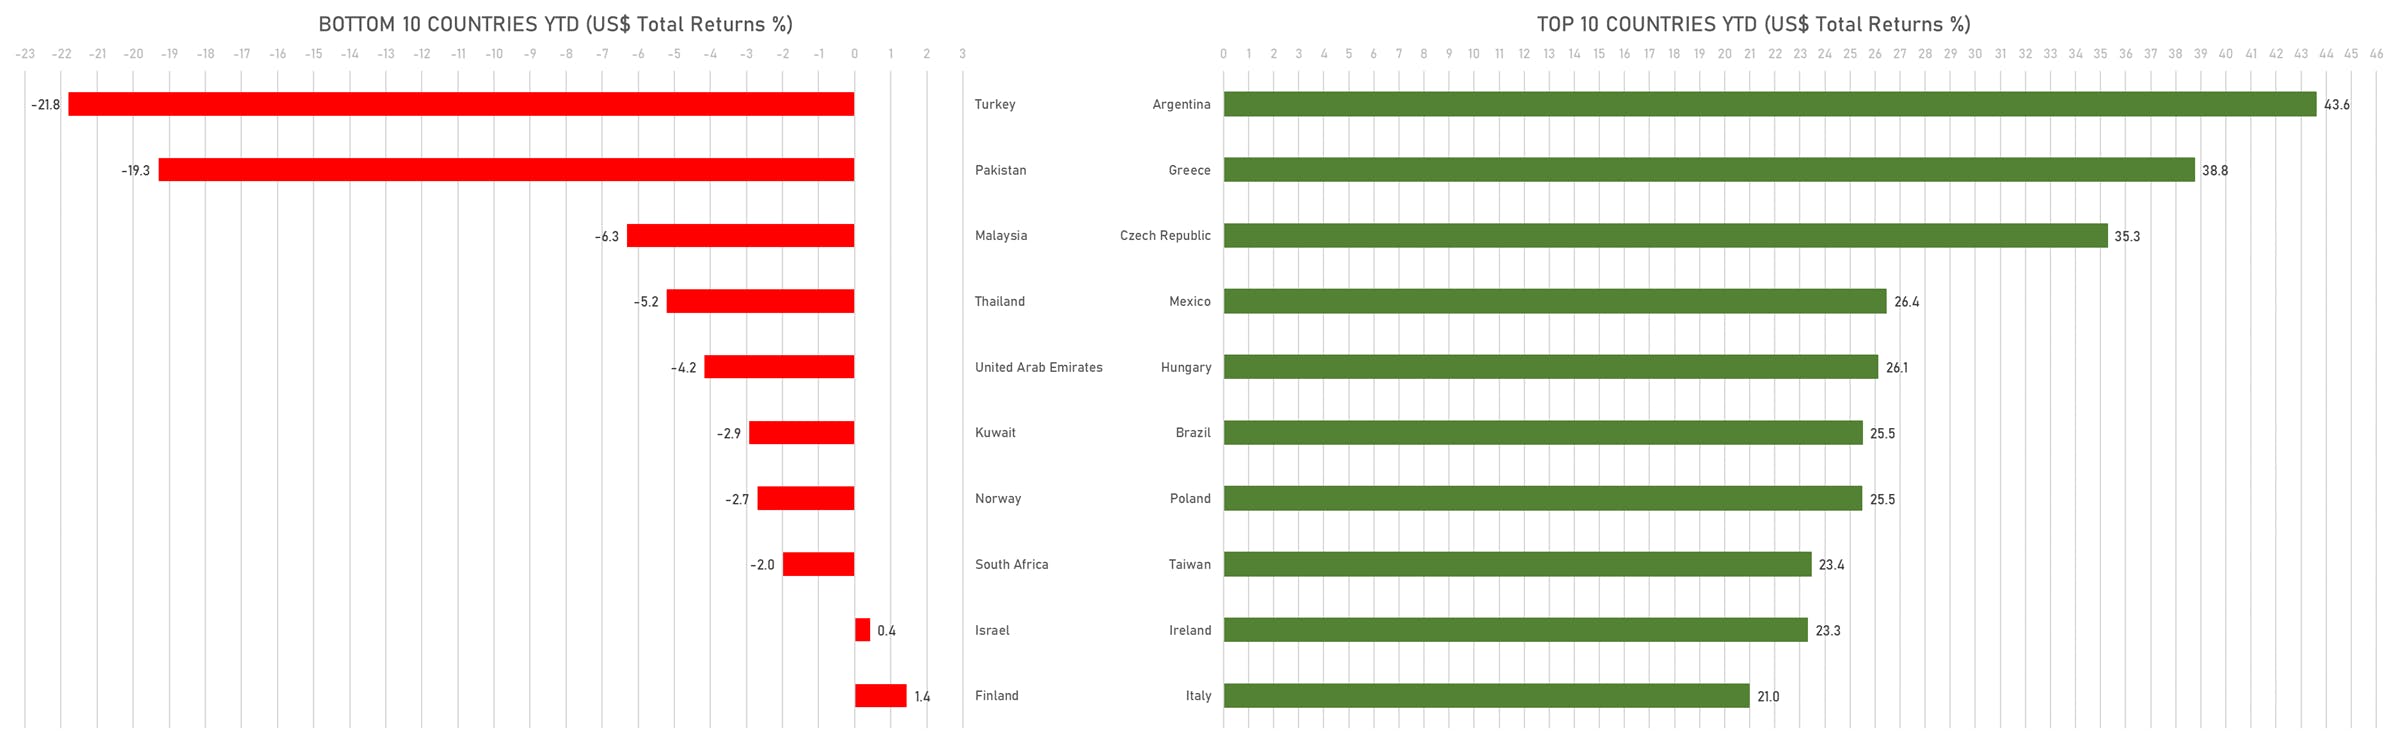
TOP / BOTTOM PERFORMING WORLD MARKETS YTD
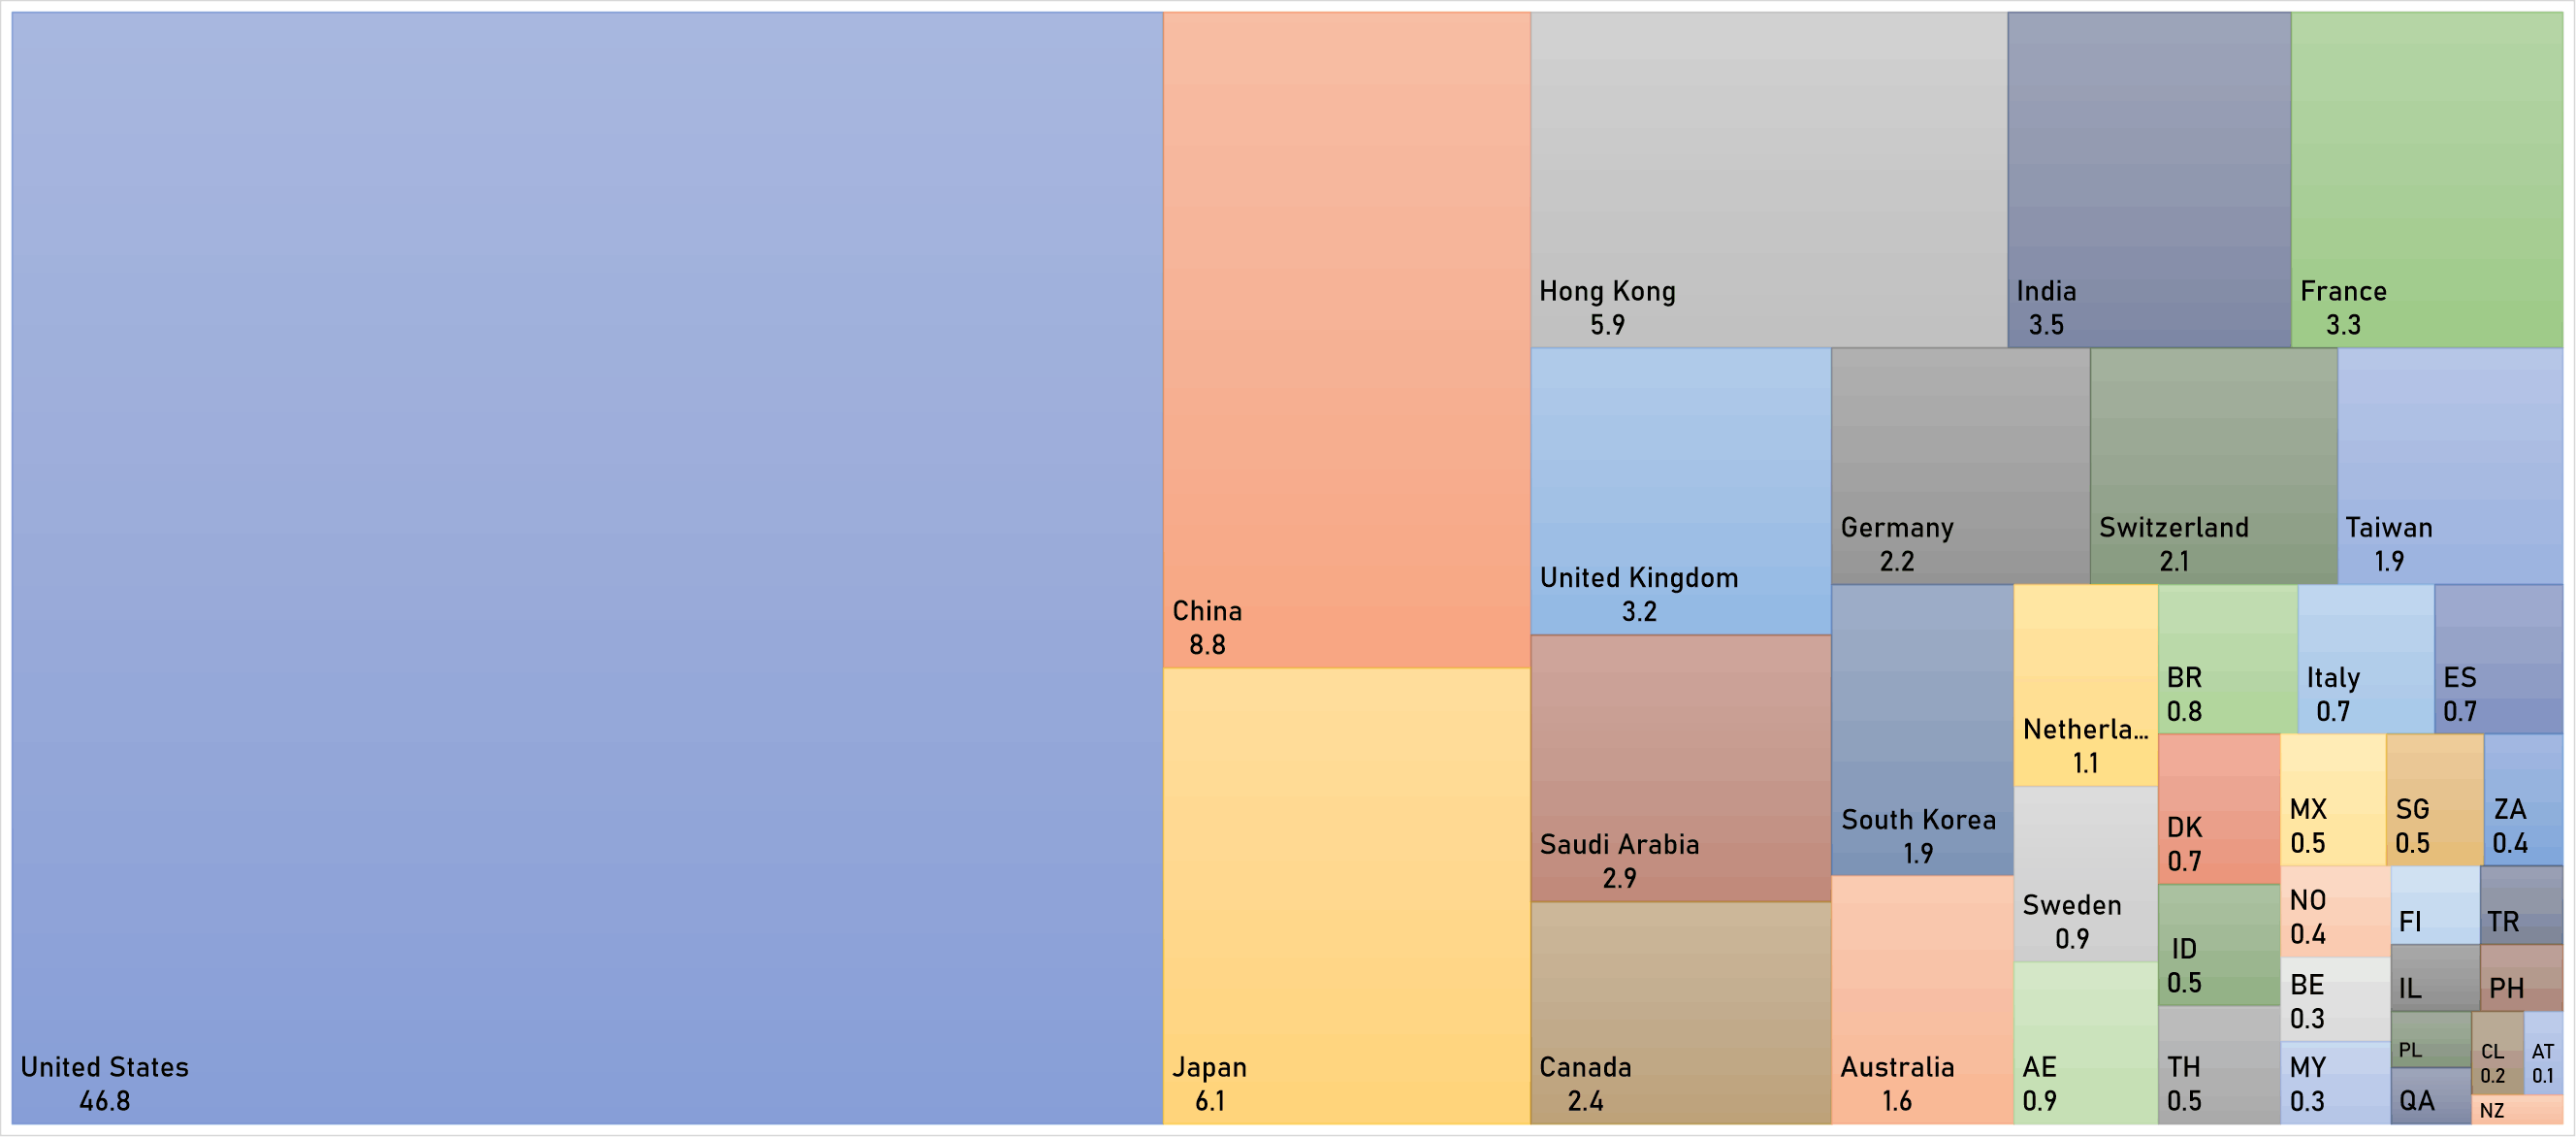
WORLD MARKET CAPITALIZATION (US$ Trillion)