Equities
Although Momentum Remains Strong, The Performance Of US Tech Is Unlikely To Be Repeated in 2H23
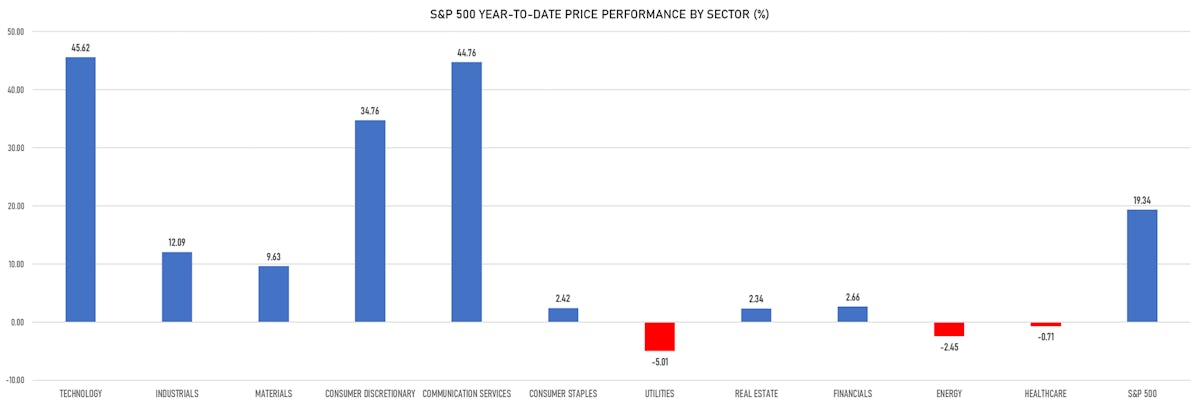
At current levels, with the S&P 500 Technology sector up 46% YTD, a couple of things make sense: 1) hedging US equities with cheap gamma; 2) look for a continuation of the cycle in EM stocks that have underperformed (Chinese ADRs for example)
Published ET
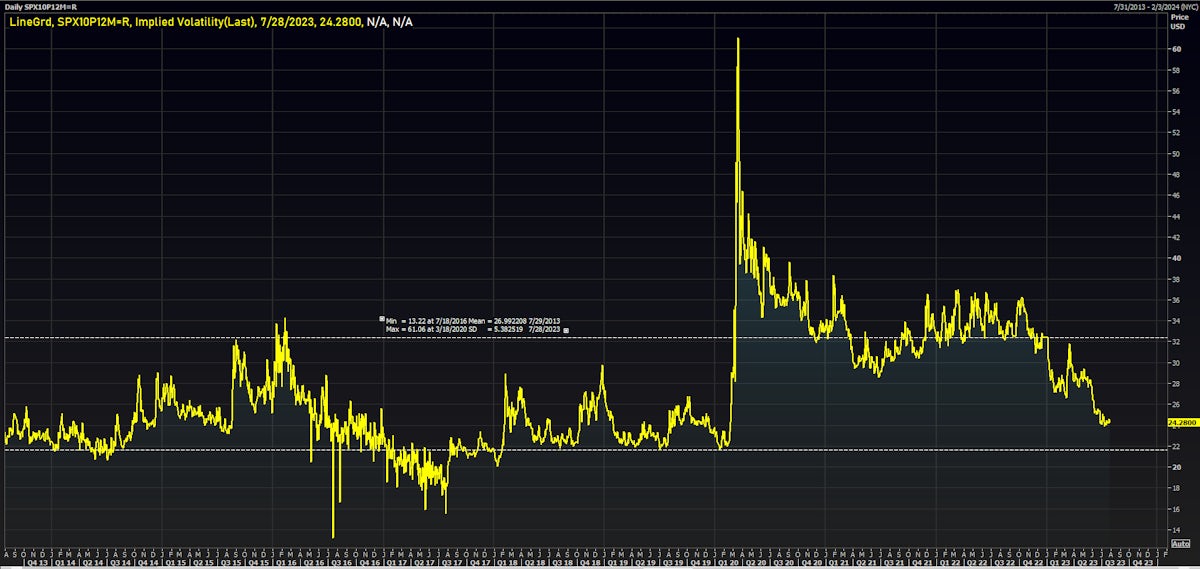
Implied volatility of a 1-year 10-delta put on the S&P 500 | Source: Refinitiv
DAILY SUMMARY
- Daily performance of US indices: S&P 500 up 0.99%; Nasdaq Composite up 1.90%; Wilshire 5000 up 0.78%
- 67.4% of S&P 500 stocks were up today, with 70.2% of stocks above their 200-day moving average (DMA) and 80.7% above their 50-DMA
- Top performing sectors in the S&P 500: communication services up 2.30% and consumer discretionary up 1.85%
- Bottom performing sectors in the S&P 500: utilities down -0.26% and real estate down -0.25%
- The number of shares in the S&P 500 traded today was 647m for a total turnover of US$ 73 bn
- The S&P 500 Value Index Index was up 0.8%, while the S&P 500 Growth Index Index was up 1.1%; the S&P small caps index was up 0.9% and mid-caps were up 0.8%
- The volume on CME's INX (S&P 500 Index) was 2,359.8m (3-month z-score: -0.2); the 3-month average volume is 2,448.5m and the 12-month range is 903.0 - 5,761.3m
- Daily performance of international indices: Europe Stoxx 600 down -0.20%; UK FTSE 100 up 0.02%; Hang Seng SH-SZ-HK 300 Index up 2.28%; Japan's TOPIX 500 down -0.22%
VOLATILITY TODAY
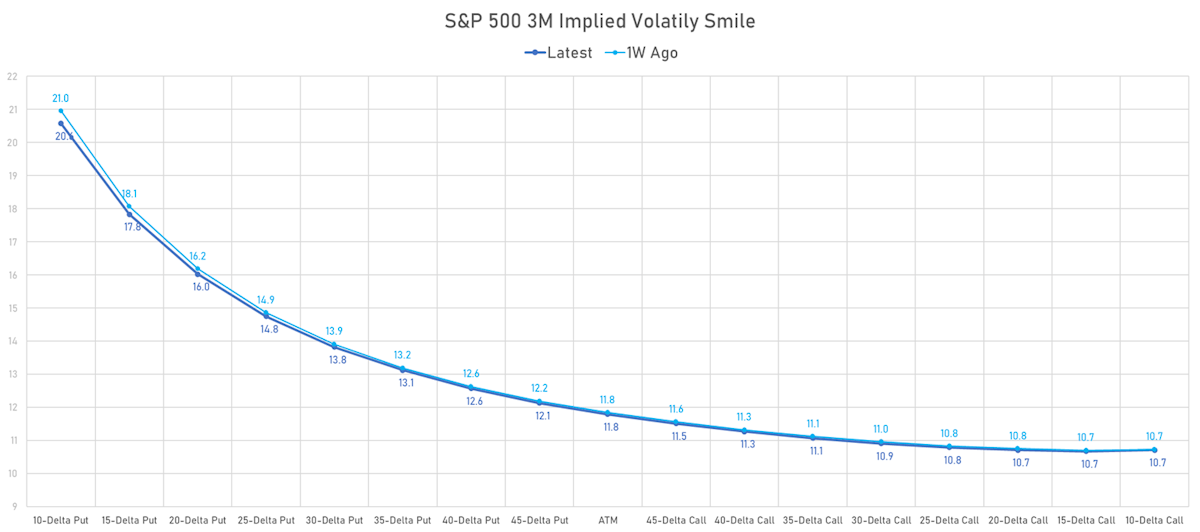
- 3-month at-the-money implied volatility on the S&P 500 at 10.4%, down from 10.6%
- 3-month at-the-money implied volatility on the STOXX Europe 600 at 10.1%, up from 10.0%
TOP WINNERS TODAY
- Aurora Acquisition Corp (AURC), up 113.2% to $44.05 / YTD price return: +336.6% / 12-Month Price Range: $ 9.83-44.05 / Short interest (% of float): 3.3%; days to cover: 58.8
- Reata Pharmaceuticals Inc (RETA), up 54.0% to $167.19 / YTD price return: +340.1% / 12-Month Price Range: $ 18.47-167.19 / Short interest (% of float): 13.0%; days to cover: 5.6
- Roku Inc (ROKU), up 31.4% to $89.61 / YTD price return: +120.2% / 12-Month Price Range: $ 38.26-89.61 / Short interest (% of float): 10.1%; days to cover: 1.7
- Beazer Homes USA Inc (BZH), up 27.7% to $35.43 / YTD price return: +177.7% / 12-Month Price Range: $ 9.47-35.43 / Short interest (% of float): 2.9%; days to cover: 2.3
- Urogen Pharma Ltd (URGN), up 26.4% to $22.61 / YTD price return: +154.9% / 12-Month Price Range: $ 6.87-22.61 / Short interest (% of float): 4.8%; days to cover: 3.8 (the stock is currently on the short sale restriction list)
- Pulse Biosciences Inc (PLSE), up 25.6% to $8.73 / YTD price return: +215.2% / 12-Month Price Range: $ 1.18-9.69 / Short interest (% of float): 2389.0%; days to cover: 10.6
- Gracell Biotechnologies Inc (GRCL), up 24.6% to $4.00 / YTD price return: +73.9% / 12-Month Price Range: $ 1.40-6.99 / Short interest (% of float): 1.9%; days to cover: 1.9
- TAL Education Group (TAL), up 24.4% to $8.00 / YTD price return: +13.5% / 12-Month Price Range: $ 2.81-10.45 / Short interest (% of float): 7.3%; days to cover: 5.1
- Quantumscape Corp (QS), up 23.9% to $13.27 / YTD price return: +134.0% / 12-Month Price Range: $ 5.11-13.86 / Short interest (% of float): 20.5%; days to cover: 9.4
- Business First Bancshares Inc (BFST), up 23.2% to $20.95 / YTD price return: -5.4% / 12-Month Price Range: $ 13.05-25.03 / Short interest (% of float): 1.1%; days to cover: 3.5
BIGGEST LOSERS TODAY
- Sleep Number Corp (SNBR), down 29.4% to $27.17 / YTD price return: +4.6% / 12-Month Price Range: $ 17.50-50.61 / Short interest (% of float): 12.1%; days to cover: 4.0 (the stock is currently on the short sale restriction list)
- Eos Energy Enterprises Inc (EOSE), down 14.7% to $2.26 / YTD price return: +52.7% / 12-Month Price Range: $ .96-5.67 / Short interest (% of float): 26.9%; days to cover: 3.9 (the stock is currently on the short sale restriction list)
- Moog Inc (MOGa), down 9.9% to $99.80 / YTD price return: +13.7% / 12-Month Price Range: $ 70.25-113.77 / Short interest (% of float): 1.5%; days to cover: 2.8 (the stock is currently on the short sale restriction list)
- TPI Composites Inc (TPIC), down 9.8% to $5.96 / YTD price return: -41.3% / 12-Month Price Range: $ 5.96-25.05 / Short interest (% of float): 20.1%; days to cover: 9.9 (the stock is currently on the short sale restriction list)
- Moog Inc (MOGb), down 9.5% to $100.00 / YTD price return: +15.0% / 12-Month Price Range: $ 69.94-113.45 / Short interest (% of float): 0.0%; days to cover: 1.4
- Genelux Corp (GNLX), down 9.4% to $21.17 / 12-Month Price Range: $ 5.35-40.98 / Short interest (% of float): 0.8%; days to cover: 3.3 (the stock is currently on the short sale restriction list)
- Gogo Inc (GOGO), down 9.0% to $15.82 / YTD price return: +7.2% / 12-Month Price Range: $ 11.57-19.29 / Short interest (% of float): 7.7%; days to cover: 8.9 (the stock is currently on the short sale restriction list)
- PennyMac Mortgage Investment Trust (PMT), down 8.9% to $12.93 / YTD price return: +4.4% / 12-Month Price Range: $ 10.78-15.78 / Short interest (% of float): 3.6%; days to cover: 4.4 (the stock is currently on the short sale restriction list)
- Sweetgreen Inc (SG), down 8.7% to $14.10 / YTD price return: +64.5% / 12-Month Price Range: $ 6.10-21.66 / Short interest (% of float): 12.4%; days to cover: 5.0 (the stock is currently on the short sale restriction list)
- Vanda Pharmaceuticals Inc (VNDA), down 8.0% to $5.94 / YTD price return: -19.6% / 12-Month Price Range: $ 5.75-11.30 / Short interest (% of float): 3.9%; days to cover: 3.5
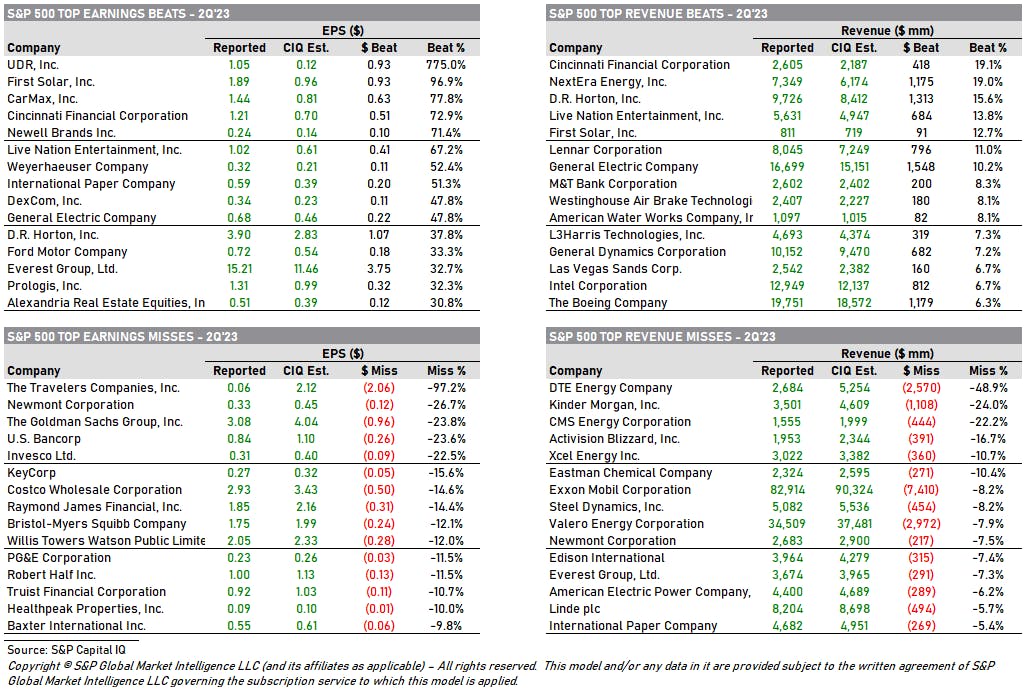
2Q 2023 EARNINGS DASHBOARD

2Q 2023 EARNINGS TOP BEATS AND MISSES
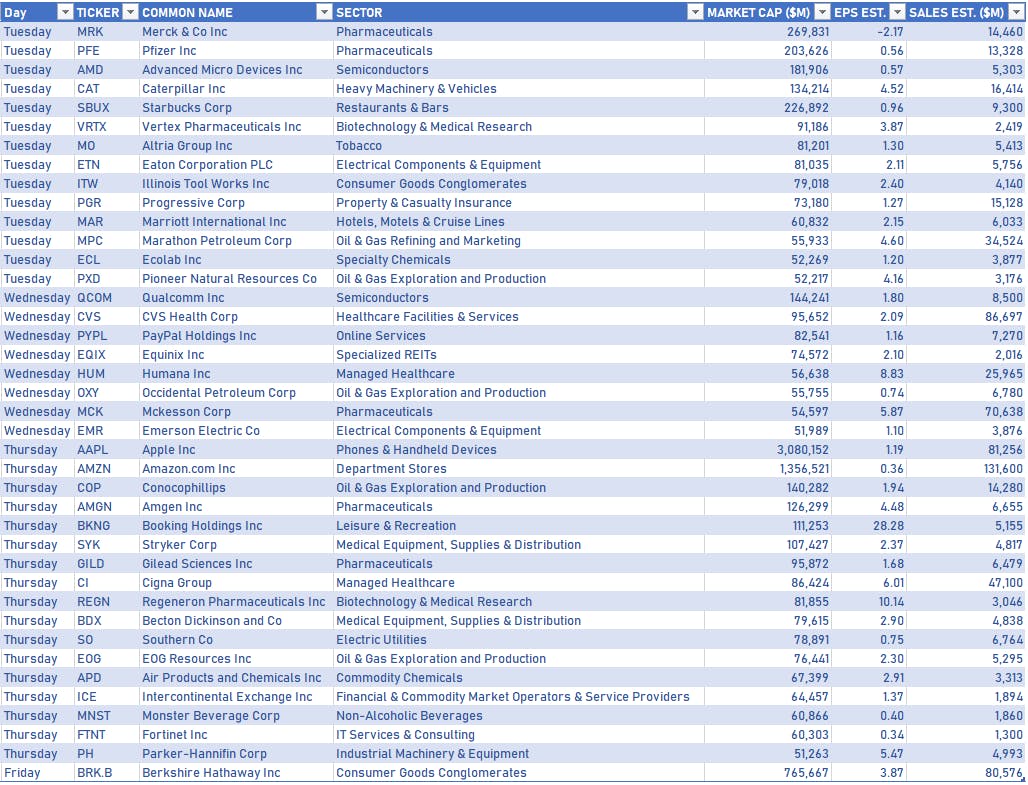
NOTABLE US EARNINGS RELEASES IN THE WEEK AHEAD
TOP S&P 500 PERFORMERS THIS WEEK
- Lam Research Corp (LRCX), up 15.7% to $721.26 / YTD price return: +71.6% / 12-Month Price Range: $ 299.63-721.26 / Short interest (% of float): 2.3%; days to cover: 2.5
- Align Technology Inc (ALGN), up 13.2% to $381.90 / YTD price return: +81.1% / 12-Month Price Range: $ 172.29-412.42 / Short interest (% of float): 3.6%; days to cover: 4.0
- Textron Inc (TXT), up 12.9% to $76.38 / YTD price return: +7.9% / 12-Month Price Range: $ 58.03-77.30 / Short interest (% of float): 2.8%; days to cover: 5.2
- Boeing Co (BA), up 12.7% to $238.69 / YTD price return: +25.3% / 12-Month Price Range: $ 120.99-238.69 / Short interest (% of float): 1.2%; days to cover: 1.3
- International Paper Co (IP), up 12.2% to $35.74 / YTD price return: +3.2% / 12-Month Price Range: $ 29.01-45.17 / Short interest (% of float): 2.7%; days to cover: 2.7
- KLA Corp (KLAC), up 11.4% to $511.01 / YTD price return: +35.5% / 12-Month Price Range: $ 250.74-511.01 / Short interest (% of float): 1.7%; days to cover: 2.4
- Applied Materials Inc (AMAT), up 11.4% to $151.93 / YTD price return: +56.0% / 12-Month Price Range: $ 71.18-151.93 / Short interest (% of float): 2.0%; days to cover: 3.0
- Packaging Corp of America (PKG), up 11.3% to $152.82 / YTD price return: +19.5% / 12-Month Price Range: $ 110.74-155.35 / Short interest (% of float): 2.7%; days to cover: 3.6
- Meta Platforms Inc (META), up 10.6% to $325.48 / YTD price return: +170.5% / 12-Month Price Range: $ 88.10-325.48 / Short interest (% of float): 1.3%; days to cover: 1.2
- Alphabet Inc (GOOG), up 10.6% to $133.01 / YTD price return: +49.9% / 12-Month Price Range: $ 83.46-133.60 / Short interest (% of float): 0.6%; days to cover: 1.3
BOTTOM S&P 500 PERFORMERS THIS WEEK
- Enphase Energy Inc (ENPH), down 13.0% to $154.33 / YTD price return: -41.8% / 12-Month Price Range: $ 152.15-339.88 / Short interest (% of float): 7.0%; days to cover: 2.7 (the stock is currently on the short sale restriction list)
- Arista Networks Inc (ANET), down 12.0% to $151.09 / YTD price return: +24.5% / 12-Month Price Range: $ 98.81-178.33 / Short interest (% of float): 1.8%; days to cover: 1.4
- Alaska Air Group Inc (ALK), down 11.1% to $48.12 / YTD price return: +12.1% / 12-Month Price Range: $ 37.20-57.16 / Short interest (% of float): 3.3%; days to cover: 2.8
- Willis Towers Watson PLC (WTW), down 10.5% to $209.10 / YTD price return: -14.5% / 12-Month Price Range: $ 197.48-258.43 / Short interest (% of float): 0.7%; days to cover: 1.3
- Solaredge Technologies Inc (SEDG), down 10.3% to $236.79 / YTD price return: -16.4% / 12-Month Price Range: $ 190.15-375.14 / Short interest (% of float): 6.7%; days to cover: 3.6
- CoStar Group Inc (CSGP), down 9.9% to $81.68 / YTD price return: +5.7% / 12-Month Price Range: $ 65.12-92.36 / Short interest (% of float): 2.7%; days to cover: 2.7
- Lamb Weston Holdings Inc (LW), down 9.6% to $102.08 / YTD price return: +14.2% / 12-Month Price Range: $ 74.92-115.99 / Short interest (% of float): 1.8%; days to cover: 2.4
- Edwards Lifesciences Corp (EW), down 9.5% to $83.74 / YTD price return: +12.2% / 12-Month Price Range: $ 67.14-107.91 / Short interest (% of float): 1.6%; days to cover: 3.6
- Southwest Airlines Co (LUV), down 9.5% to $33.70 / YTD price return: +.1% / 12-Month Price Range: $ 28.40-40.39 / Short interest (% of float): 3.2%; days to cover: 2.5
- RTX Corp (RTX), down 9.4% to $87.34 / YTD price return: -13.5% / 12-Month Price Range: $ 80.28-104.90 / Short interest (% of float): 0.6%; days to cover: 1.8
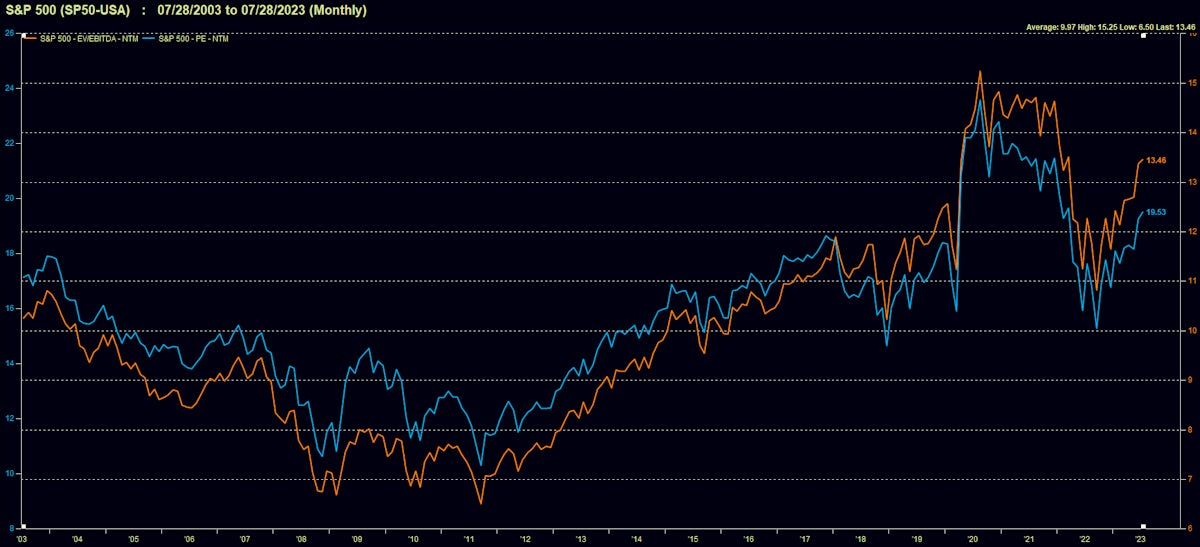
VALUATION MULTIPLES BY SECTORS

WEEKLY TOTAL RETURNS OF MAJOR GLOBAL EQUITY MARKETS

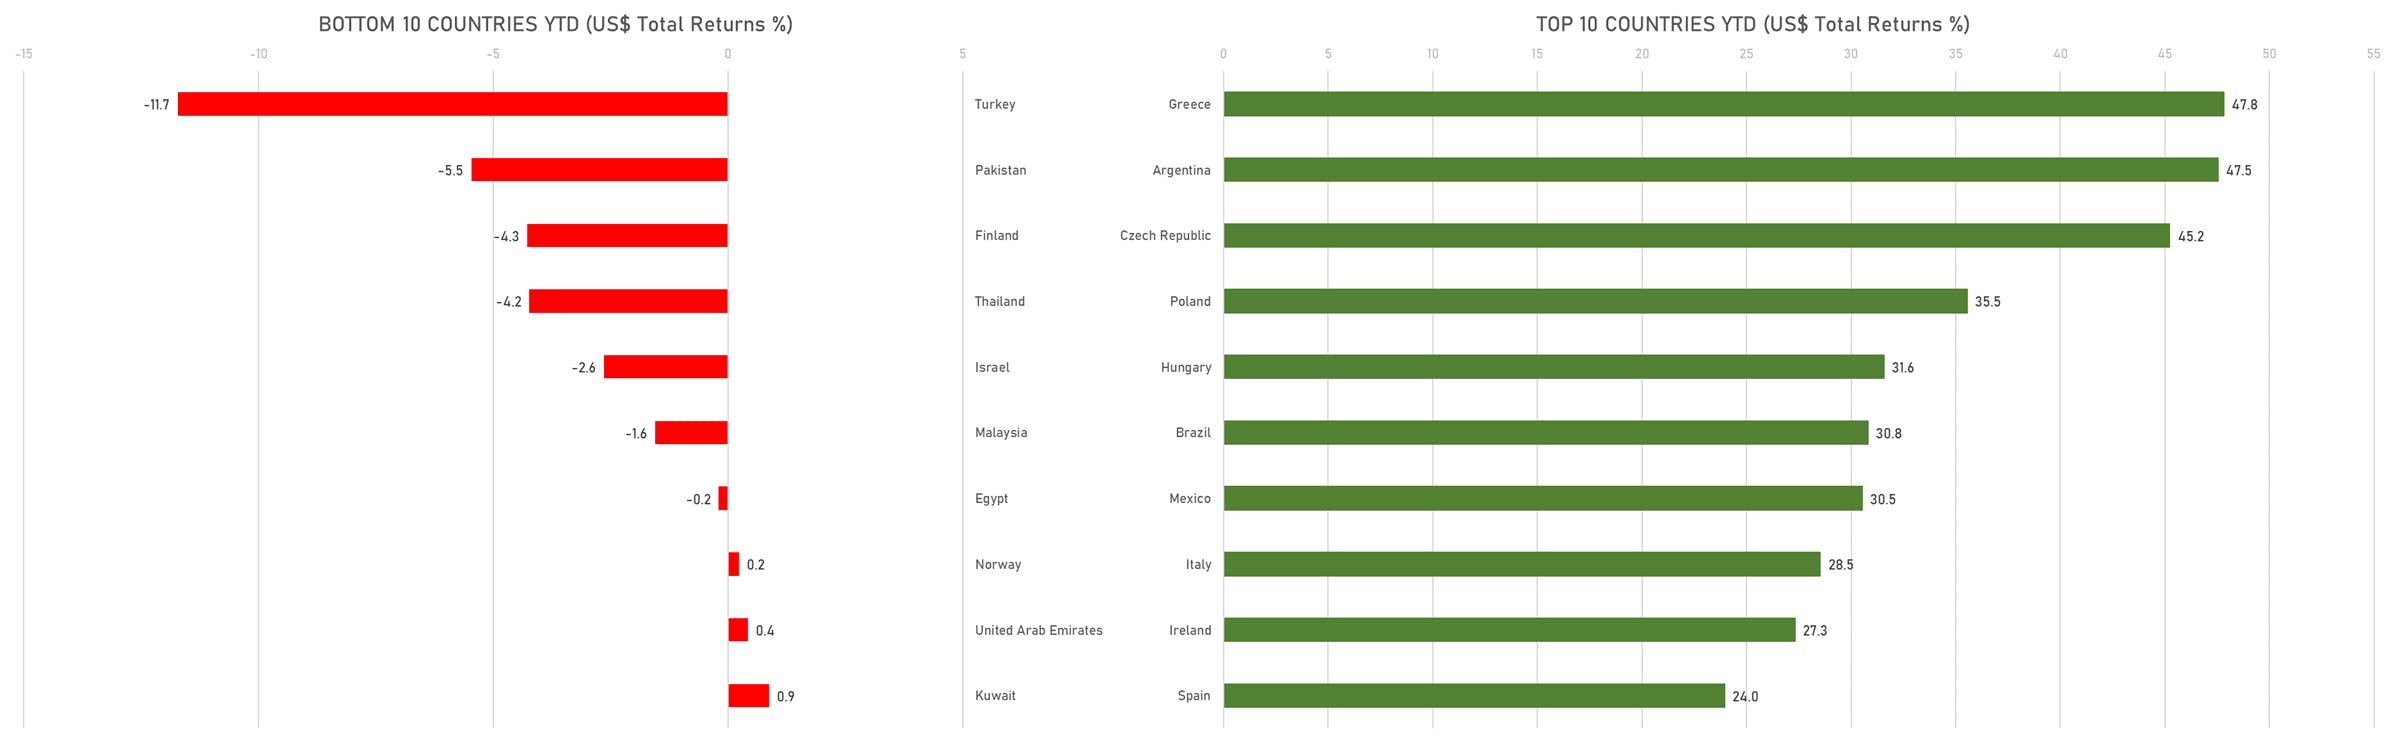
TOP / BOTTOM PERFORMING WORLD MARKETS YTD
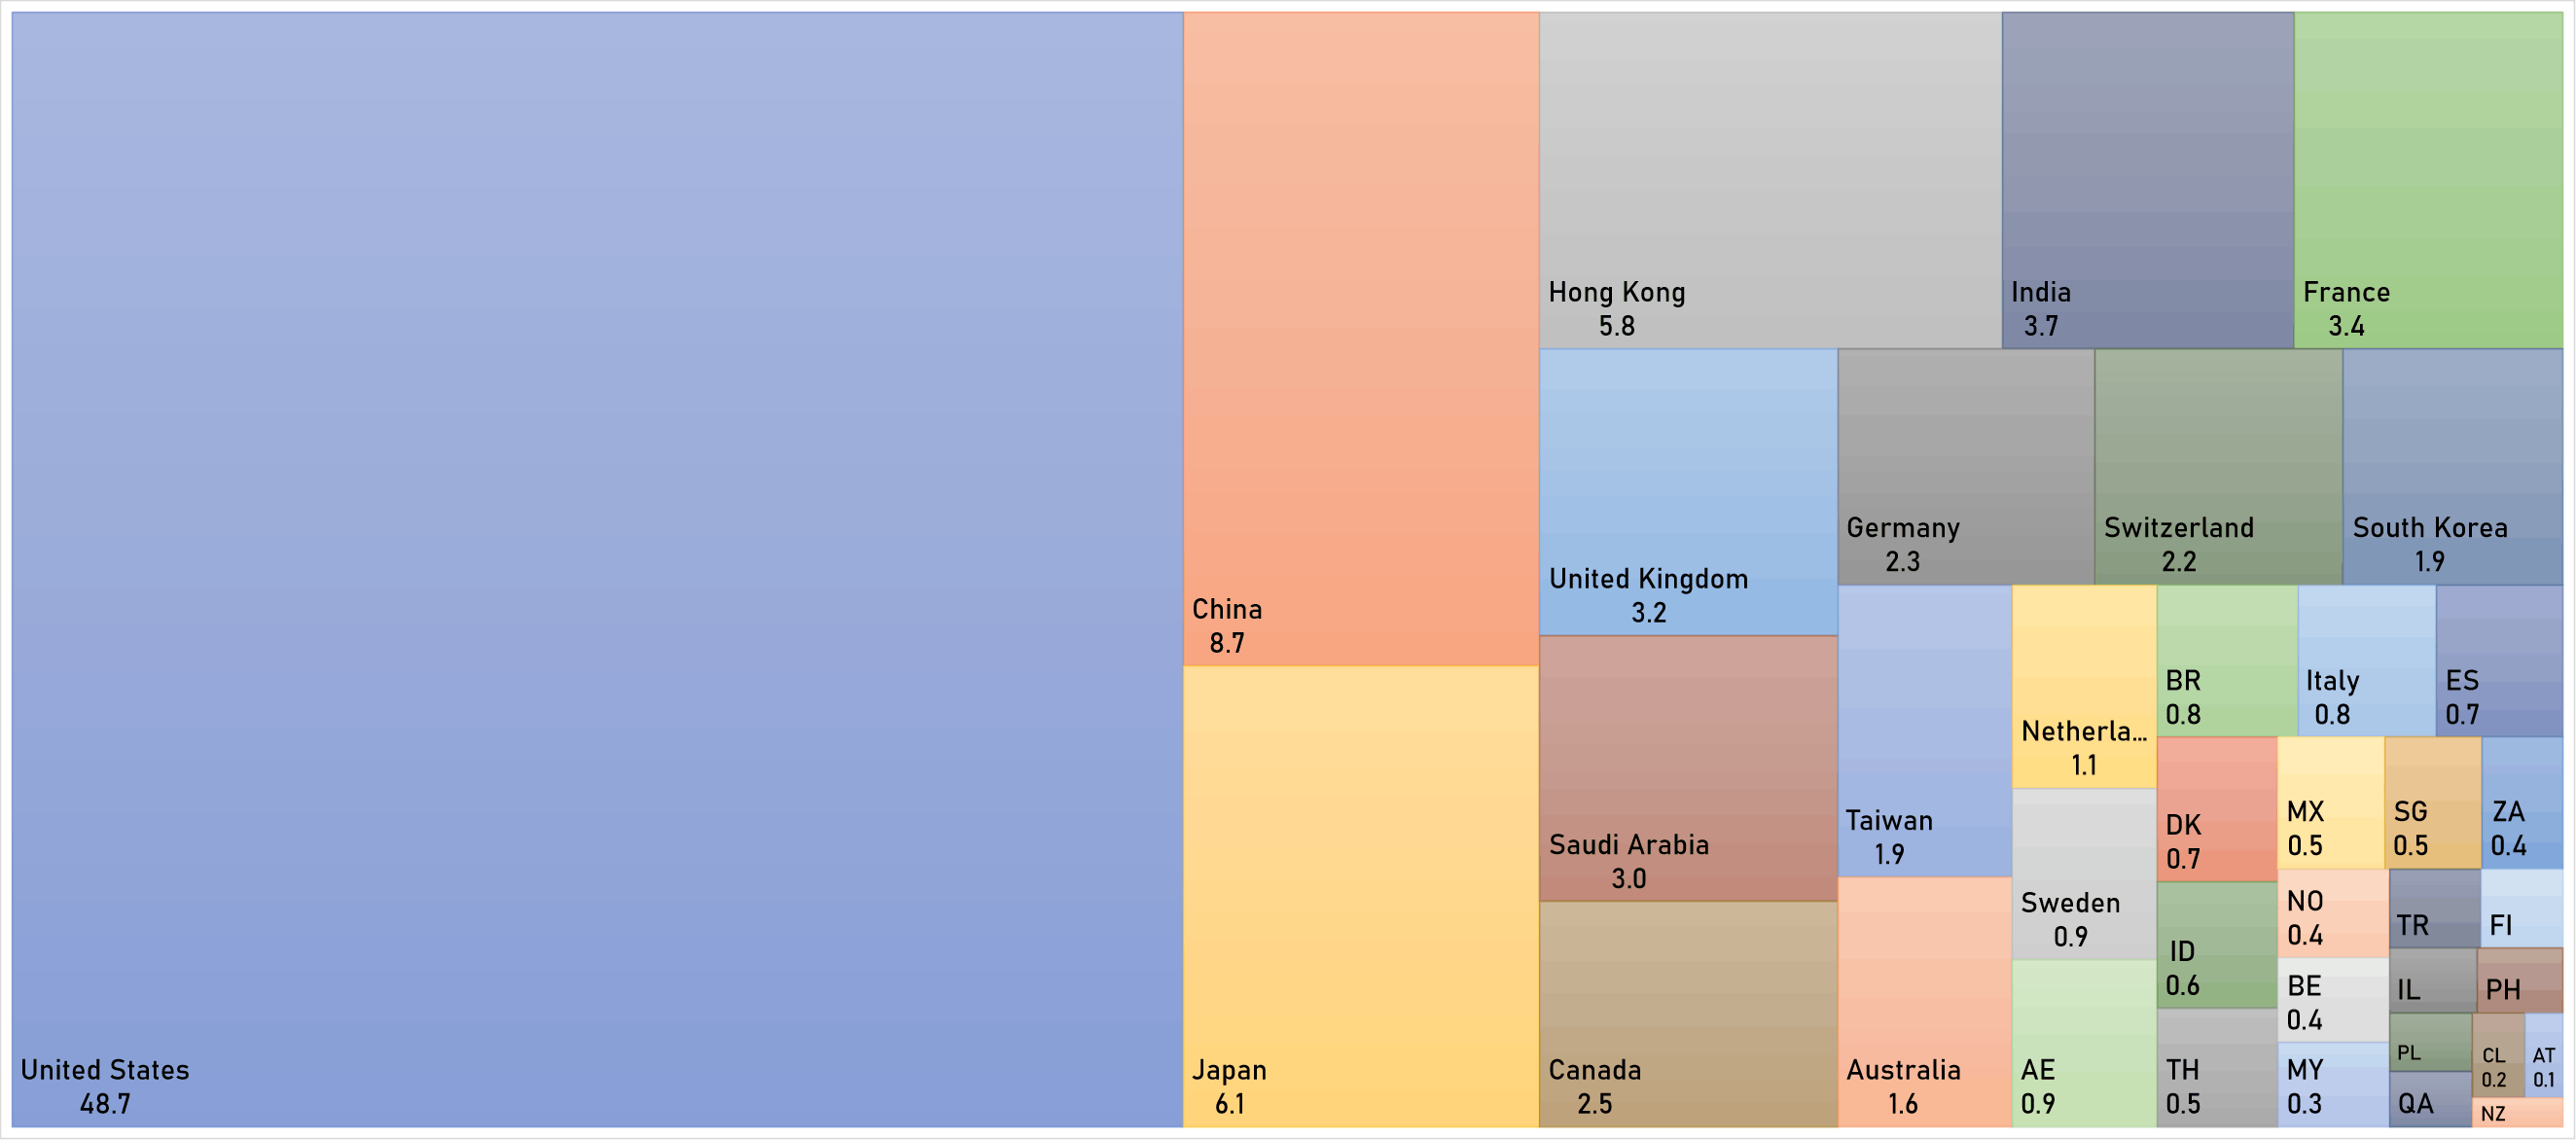
WORLD MARKET CAPITALIZATION (US$ Trillion)