Equities
Decent Rebound For US Equities This Week, With Healthier Hedge Fund Positioning Helping
The divergence in the macro outlook of major economic areas has become more apparent, and was reflected in the poor performance of Chinese and European equities over the past week
Published ET
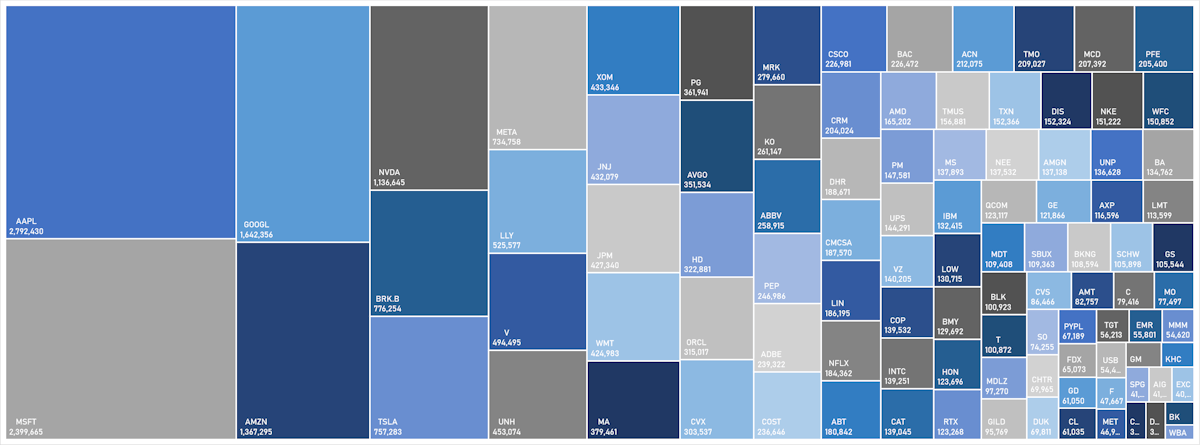
S&P 100 Market Cap (USD m) | Sources: phipost.com, Refinitiv data
DAILY SUMMARY
- Daily performance of US indices: S&P 500 up 0.67%; Nasdaq Composite up 0.94%; Wilshire 5000 up 0.06%
- 75.1% of S&P 500 stocks were up today, with 50.1% of stocks above their 200-day moving average (DMA) and 33.4% above their 50-DMA
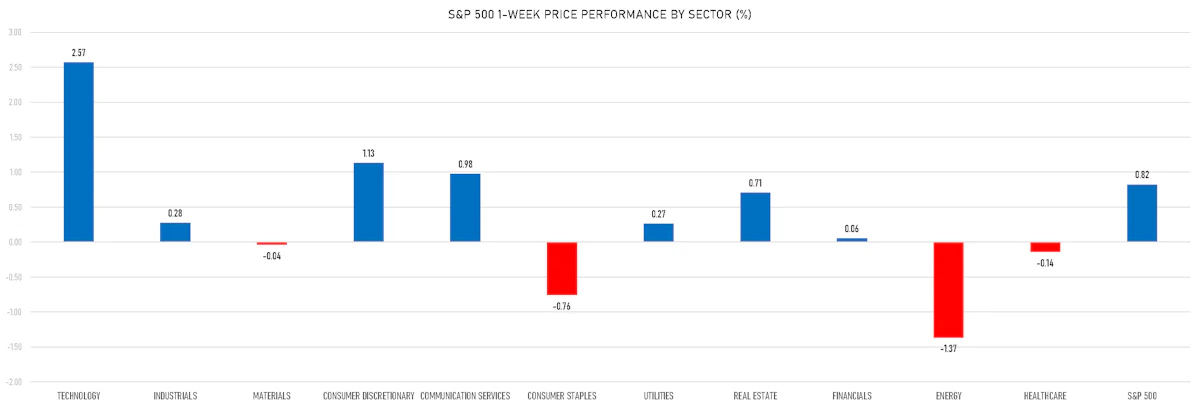
- Top performing sectors in the S&P 500: consumer discretionary up 1.10% and energy up 1.07%
- Bottom performing sectors in the S&P 500: communication services up 0.17% and materials up 0.27%
- The number of shares in the S&P 500 traded today was 561m for a total turnover of US$ 64 bn
- The S&P 500 Value Index Index was up 0.6%, while the S&P 500 Growth Index Index was up 0.7%; the S&P small caps index was down -0.1% and mid caps were up 0.1%
- The volume on CME's INX (S&P 500 Index) was 1,959.8m (3-month z-score: -0.9); the 3-month average volume is 2,365.9m and the 12-month range is 903.0 - 5,761.3m
- Daily performance of international indices: Europe Stoxx 600 down -0.04%; UK FTSE 100 up 0.07%; Hang Seng SH-SZ-HK 300 Index down -0.25%; Japan's TOPIX 500 down -0.93%
VOLATILITY TODAY
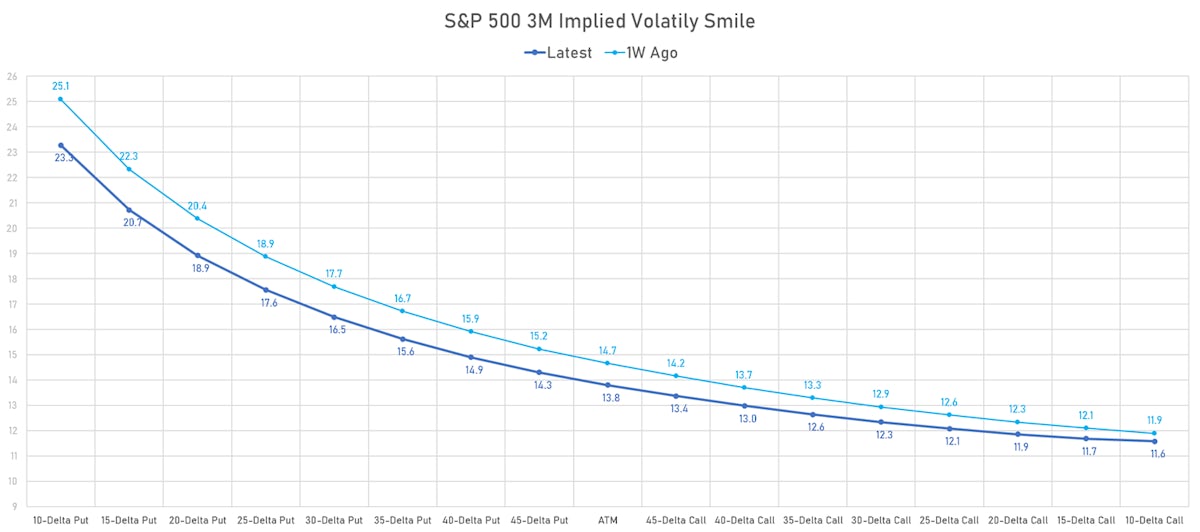
- 3-month at-the-money implied volatility on the S&P 500 at 12.5%, down from 13.5%
- 3-month at-the-money implied volatility on the STOXX Europe 600 at 13.2%, up from 13.0%
TOP WINNERS TODAY
- Affirm Holdings Inc (AFRM), up 28.8% to $17.79 / YTD price return: +84.0% / 12-Month Price Range: $ 8.62-31.42 / Short interest (% of float): 16.7%; days to cover: 2.6
- Hibbett Inc (HIBB), up 22.2% to $45.03 / YTD price return: -34.0% / 12-Month Price Range: $ 34.86-75.38 / Short interest (% of float): 14.8%; days to cover: 6.1
- Hostess Brands Inc (TWNK), up 21.7% to $27.00 / YTD price return: +20.3% / 12-Month Price Range: $ 21.59-29.00 / Short interest (% of float): 2.8%; days to cover: 3.8
- BlackBerry Ltd (BB), up 18.1% to $5.23 / YTD price return: +60.4% / 12-Month Price Range: $ 3.17-6.42 / Short interest (% of float): 2.5%; days to cover: 3.3
- Ubiquiti Inc (UI), up 15.3% to $177.59 / YTD price return: -35.1% / 12-Month Price Range: $ 153.38-350.63
- Beneficient (BENF), up 15.1% to $2.14 / YTD price return: -79.1% / 12-Month Price Range: $ 1.69-16.50 / Short interest (% of float): 0.1%; days to cover: 0.4
- Eos Energy Enterprises Inc (EOSE), up 13.6% to $3.51 / YTD price return: +137.2% / 12-Month Price Range: $ 0.96-5.67 / Short interest (% of float): 24.5%; days to cover: 3.5
- Precigen Inc (PGEN), up 13.1% to $1.73 / YTD price return: +13.8% / 12-Month Price Range: $ 0.81-2.90 / Short interest (% of float): 4.3%; days to cover: 6.0
- Ardelyx Inc (ARDX), up 12.3% to $3.94 / YTD price return: +38.2% / 12-Month Price Range: $ 0.82-5.13 / Short interest (% of float): 13.0%; days to cover: 7.7
- Intuitive Machines Inc (LUNR), up 11.3% to $4.44 / YTD price return: -55.6% / 12-Month Price Range: $ 3.81-136.00 / Short interest (% of float): 6.9%; days to cover: 2.0
BIGGEST LOSERS TODAY
- Domo Inc (DOMO), down 35.8% to $10.94 / YTD price return: -23.2% / 12-Month Price Range: $ 10.94-28.94 / Short interest (% of float): 4.6%; days to cover: 3.9 (the stock is currently on the short sale restriction list)
- Hawaiian Electric Industries Inc (HE), down 18.5% to $9.66 / YTD price return: -76.9% / 12-Month Price Range: $ 9.66-43.71 / Short interest (% of float): 1.8%; days to cover: 0.8 (the stock is currently on the short sale restriction list)
- Allego NV (ALLG), down 17.7% to $1.77 / YTD price return: -43.6% / 12-Month Price Range: $ 1.77-6.26 / Short interest (% of float): 0.1%; days to cover: 5.2 (the stock is currently on the short sale restriction list)
- Bioventus Inc (BVS), down 13.8% to $3.45 / YTD price return: +32.2% / 12-Month Price Range: $ .80-8.56 / Short interest (% of float): 2.8%; days to cover: 10.0 (the stock is currently on the short sale restriction list)
- AMC Entertainment Holdings Inc (AMC), down 13.5% to $12.43 / YTD price return: -65.4% / 12-Month Price Range: $ 12.43-115.15 / Short interest (% of float): 29.2%; days to cover: 3.3 (the stock is currently on the short sale restriction list)
- Archer Aviation Inc (ACHR), down 11.9% to $5.78 / YTD price return: +209.1% / 12-Month Price Range: $ 1.62-7.49 / Short interest (% of float): 16.4%; days to cover: 2.8 (the stock is currently on the short sale restriction list)
- Telesat Corp (TSAT), down 10.8% to $18.67 / YTD price return: +148.9% / 12-Month Price Range: $ 6.00-22.75 / Short interest (% of float): 3.6%; days to cover: 0.4 (the stock is currently on the short sale restriction list)
- ACELYRIN Inc (SLRN), down 10.4% to $24.51 / 12-Month Price Range: $ 16.60-29.88 / Short interest (% of float): 7.6%; days to cover: 8.8 (the stock is currently on the short sale restriction list)
- Extreme Networks Inc (EXTR), down 9.1% to $25.16 / YTD price return: +37.4% / 12-Month Price Range: $ 12.09-32.73 / Short interest (% of float): 8.1%; days to cover: 5.2 (the stock is currently on the short sale restriction list)
- WeWork Inc (WE), down 9.0% to $.13 / YTD price return: -91.2% / 12-Month Price Range: $ .11-4.69 / Short interest (% of float): 4.5%; days to cover: 1.4
TOP S&P 500 PERFORMERS THIS WEEK
- Tesla Inc (TSLA), up 10.7% to $238.59 / YTD price return: +93.7% / 12-Month Price Range: $ 101.83-313.80 / Short interest (% of float): 3.0%; days to cover: 0.7
- Moderna Inc (MRNA), up 10.1% to $111.93 / YTD price return: -37.7% / 12-Month Price Range: $ 95.02-217.20
- Palo Alto Networks Inc (PANW), up 10.0% to $230.76 / YTD price return: +65.4% / 12-Month Price Range: $ 132.28-258.87 / Short interest (% of float): 6.3%; days to cover: 3.7
- Hasbro Inc (HAS), up 9.3% to $69.68 / YTD price return: +14.2% / 12-Month Price Range: $ 45.75-84.06
- Autodesk Inc (ADSK), up 8.1% to $215.92 / YTD price return: +15.5% / 12-Month Price Range: $ 179.89-234.85
- Intuit Inc (INTU), up 6.8% to $519.05 / YTD price return: +33.4% / 12-Month Price Range: $ 352.66-519.05
- NVIDIA Corp (NVDA), up 6.3% to $460.18 / YTD price return: +214.9% / 12-Month Price Range: $ 108.14-502.30 / Short interest (% of float): 1.1%; days to cover: 0.6
- Cadence Design Systems Inc (CDNS), up 5.4% to $232.51 / YTD price return: +44.7% / 12-Month Price Range: $ 138.78-248.10
- Accenture PLC (ACN), up 5.2% to $318.76 / YTD price return: +19.5% / 12-Month Price Range: $ 242.86-327.43
- Gartner Inc (IT), up 4.4% to $342.49 / YTD price return: +1.9% / 12-Month Price Range: $ 272.60-377.37
BOTTOM S&P 500 PERFORMERS THIS WEEK
- Dollar Tree Inc (DLTR), down 13.7% to $123.31 / YTD price return: -12.8% / 12-Month Price Range: $ 123.31-170.36
- Insulet Corp (PODD), down 10.8% to $183.00 / YTD price return: -37.8% / 12-Month Price Range: $ 183.00-335.84 / Short interest (% of float): 4.1%; days to cover: 3.9
- Ulta Beauty Inc (ULTA), down 10.1% to $407.15 / YTD price return: -13.2% / 12-Month Price Range: $ 373.98-556.00
- Best Buy Co Inc (BBY), down 7.5% to $72.67 / YTD price return: -9.4% / 12-Month Price Range: $ 60.85-93.30
- Target Corp (TGT), down 7.2% to $121.79 / YTD price return: -18.3% / 12-Month Price Range: $ 121.79-181.66
- CF Industries Holdings Inc (CF), down 7.0% to $73.58 / YTD price return: -13.7% / 12-Month Price Range: $ 60.09-119.57
- VF Corp (VFC), down 5.7% to $18.87 / YTD price return: -31.7% / 12-Month Price Range: $ 16.78-44.85 / Short interest (% of float): 5.5%; days to cover: 3.7
- Nike Inc (NKE), down 5.7% to $98.84 / YTD price return: -15.5% / 12-Month Price Range: $ 82.23-131.25 / Short interest (% of float): 1.3%; days to cover: 2.6
- Illumina Inc (ILMN), down 5.5% to $158.08 / YTD price return: -21.8% / 12-Month Price Range: $ 158.08-248.48
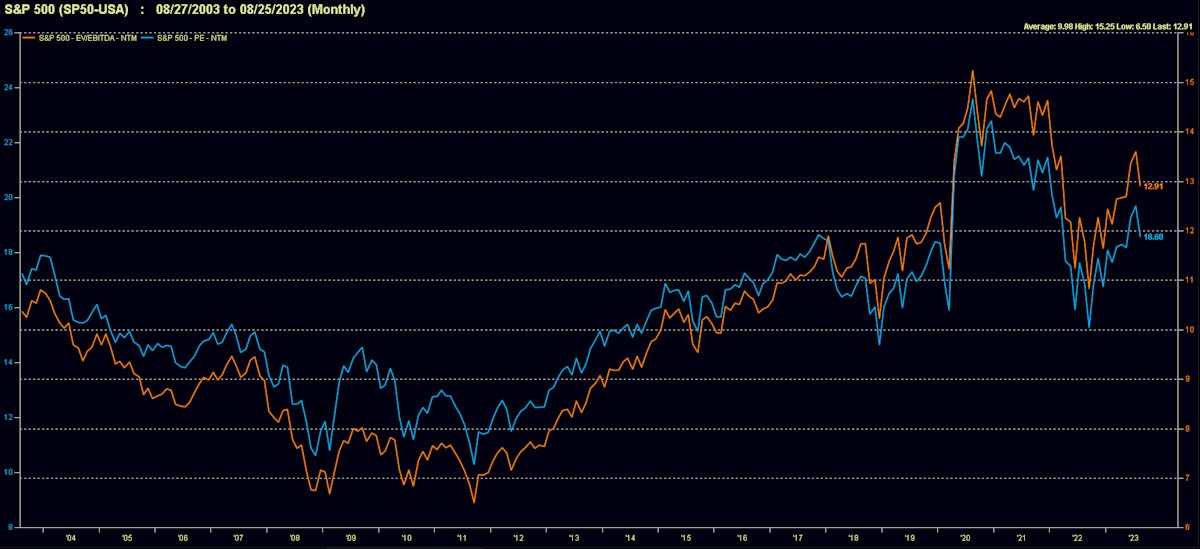
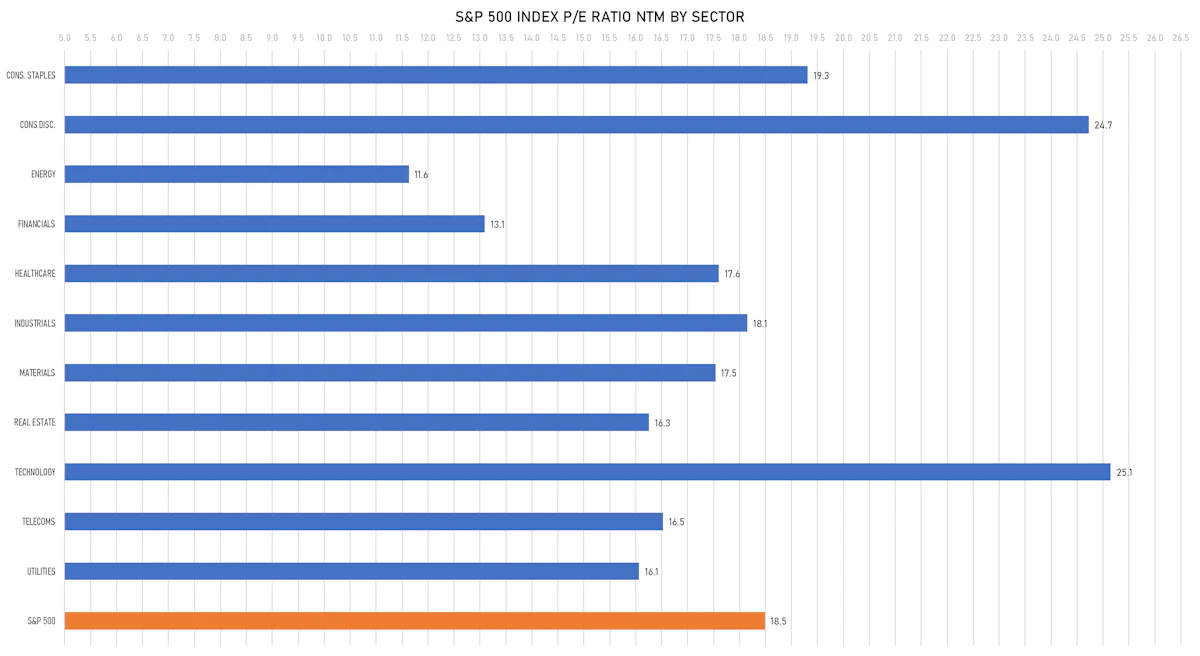
VALUATION MULTIPLES BY SECTORS
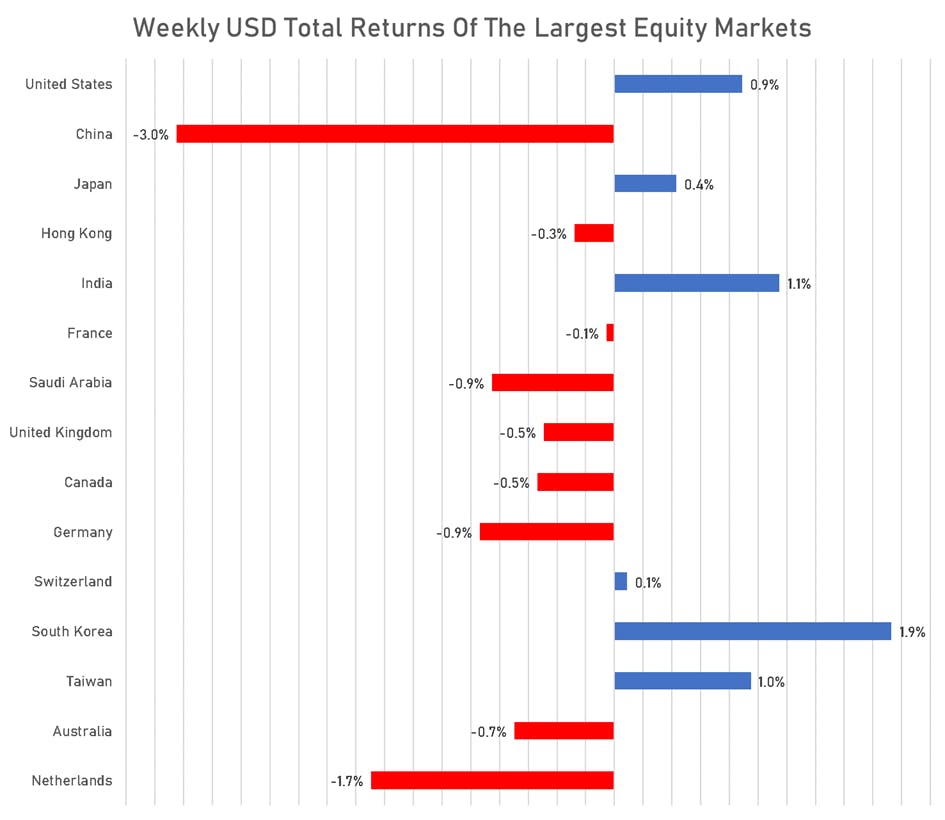
WEEKLY TOTAL RETURNS OF MAJOR GLOBAL EQUITY MARKETS
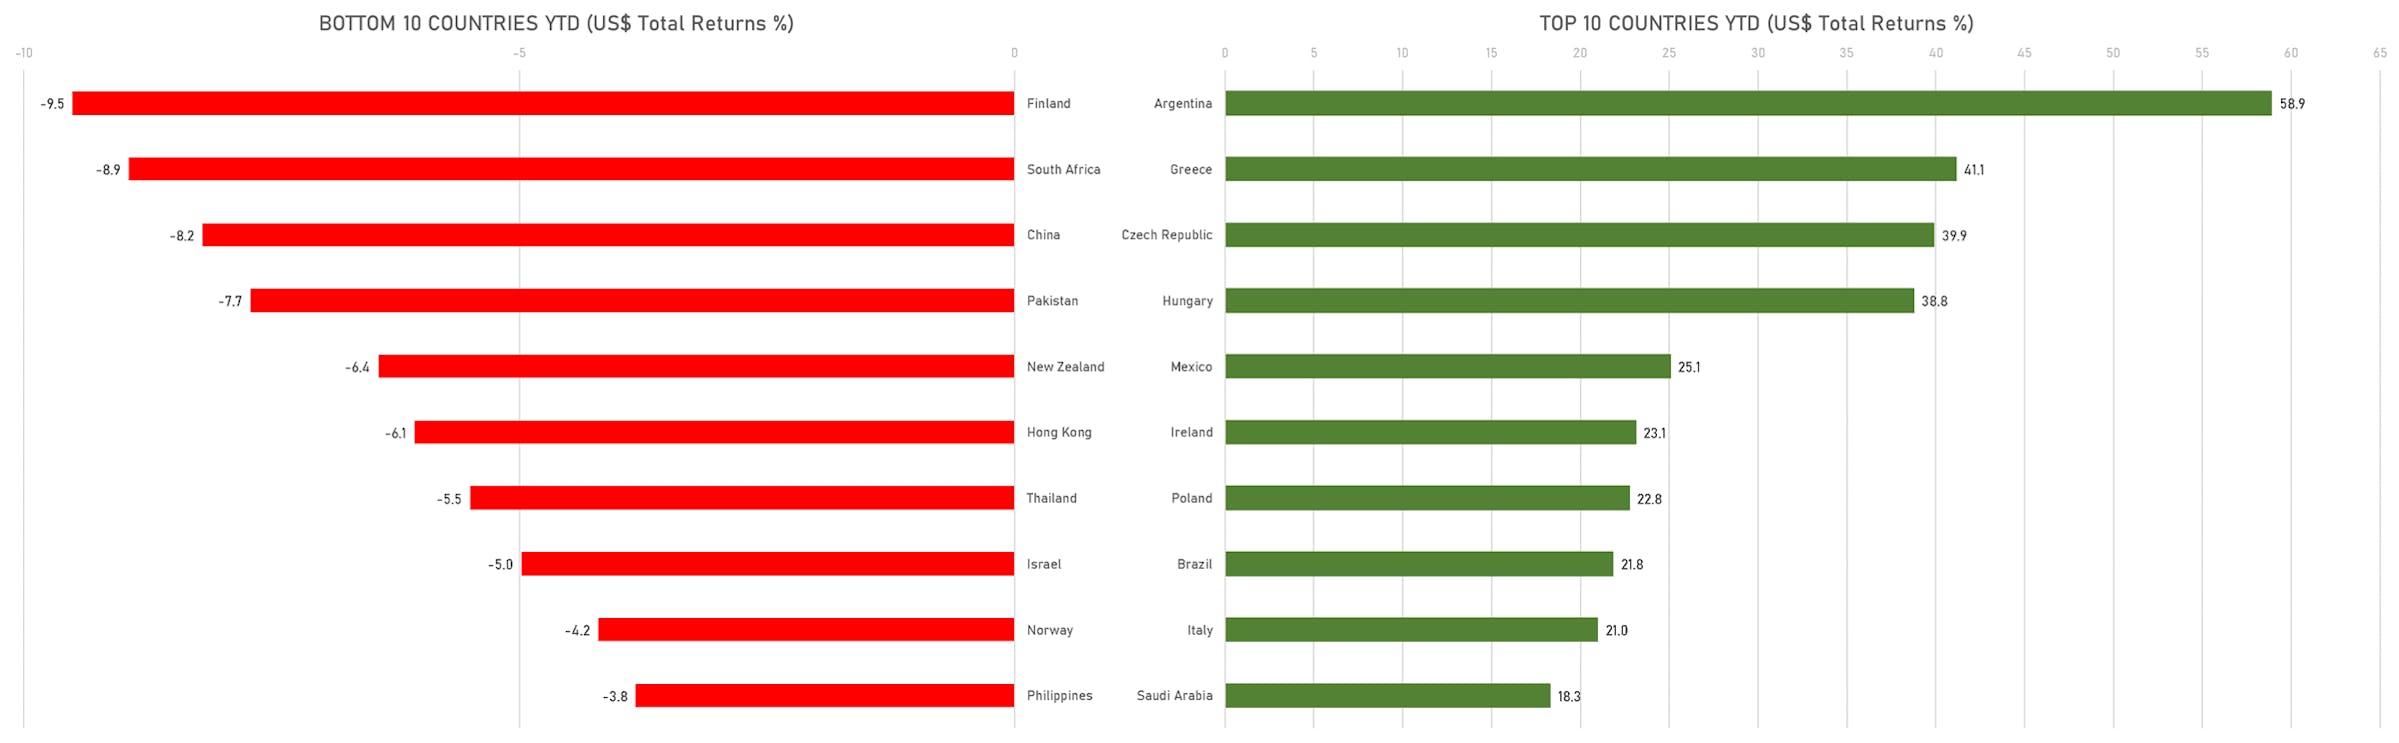
TOP / BOTTOM PERFORMING WORLD MARKETS YTD
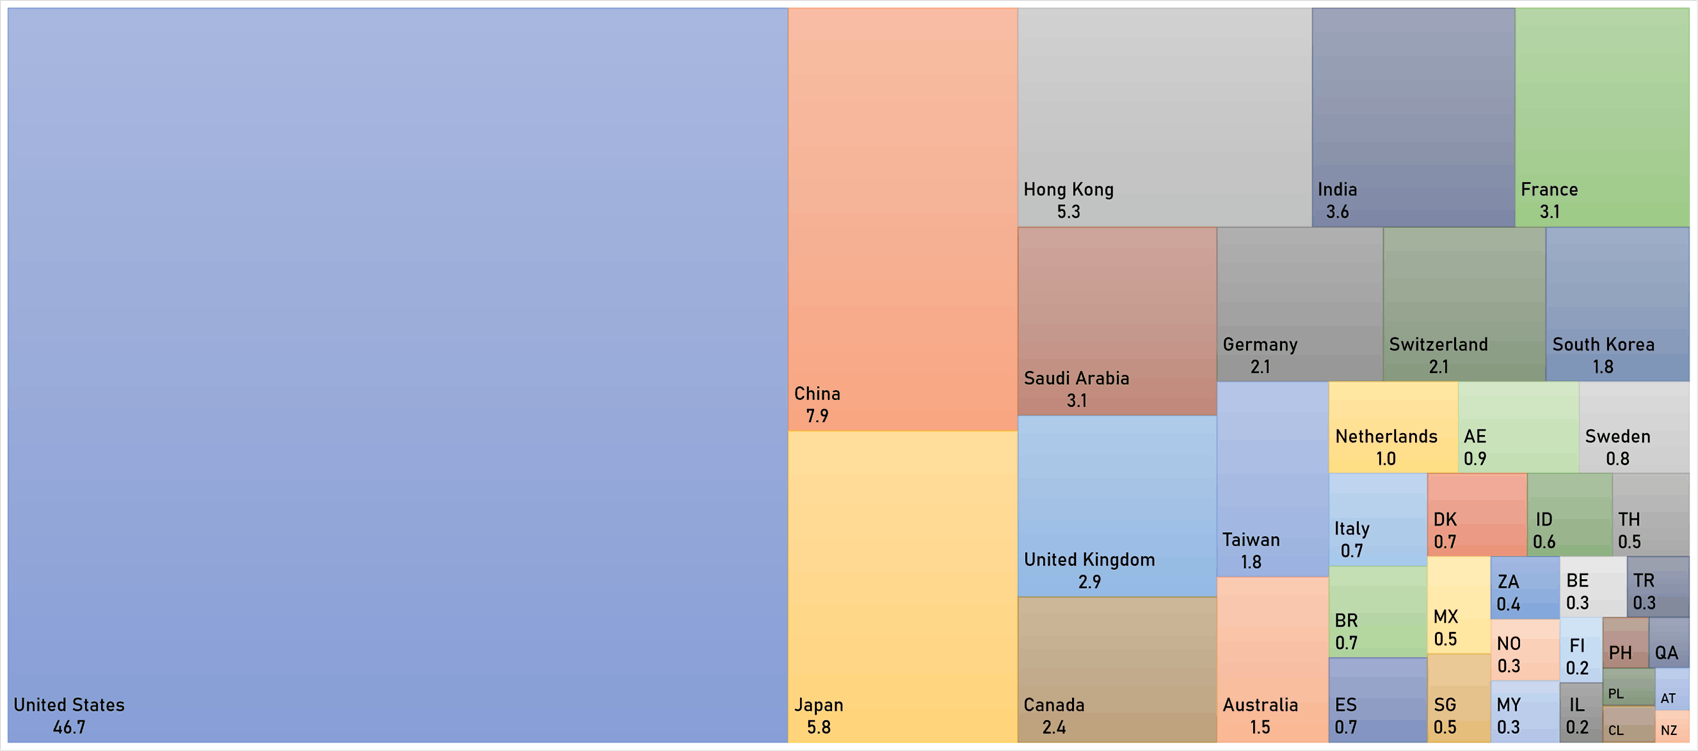
WORLD MARKET CAPITALIZATION (US$ Trillion)