Equities
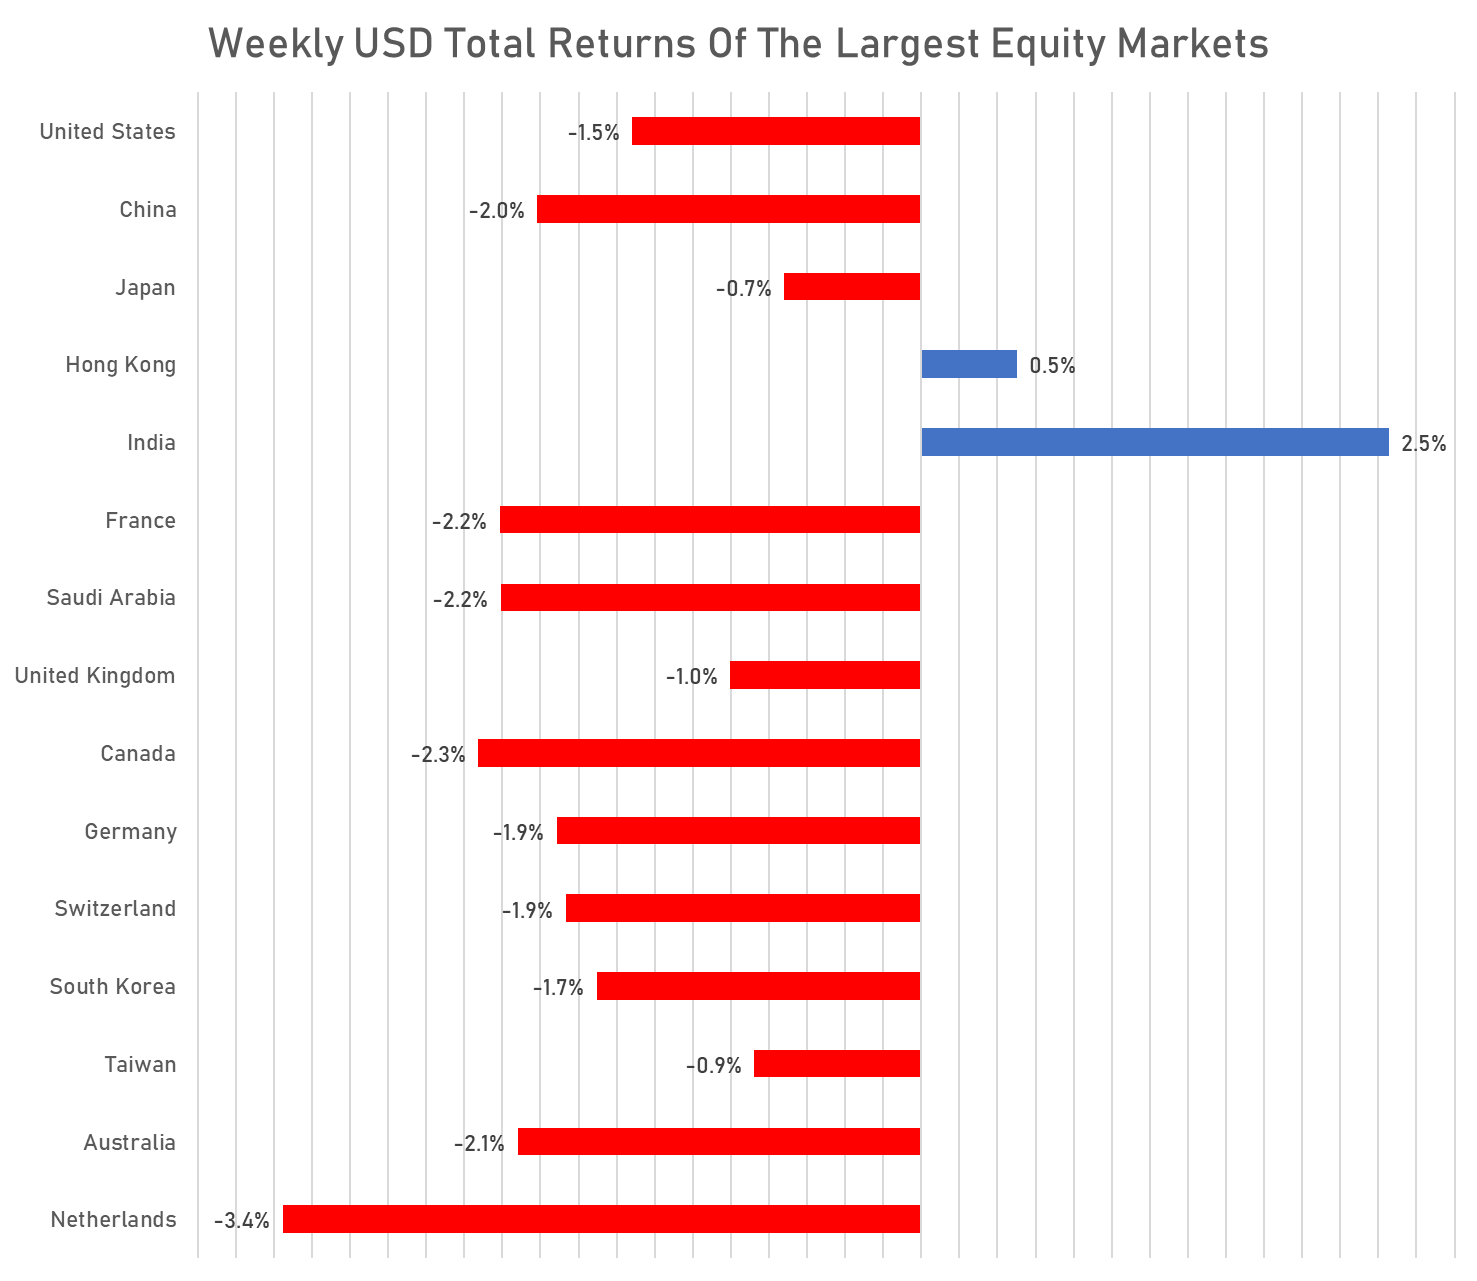
Pretty Grim Week For Global Equities: US Total Return -1.5%, China -2.0%, EZ -2.2%
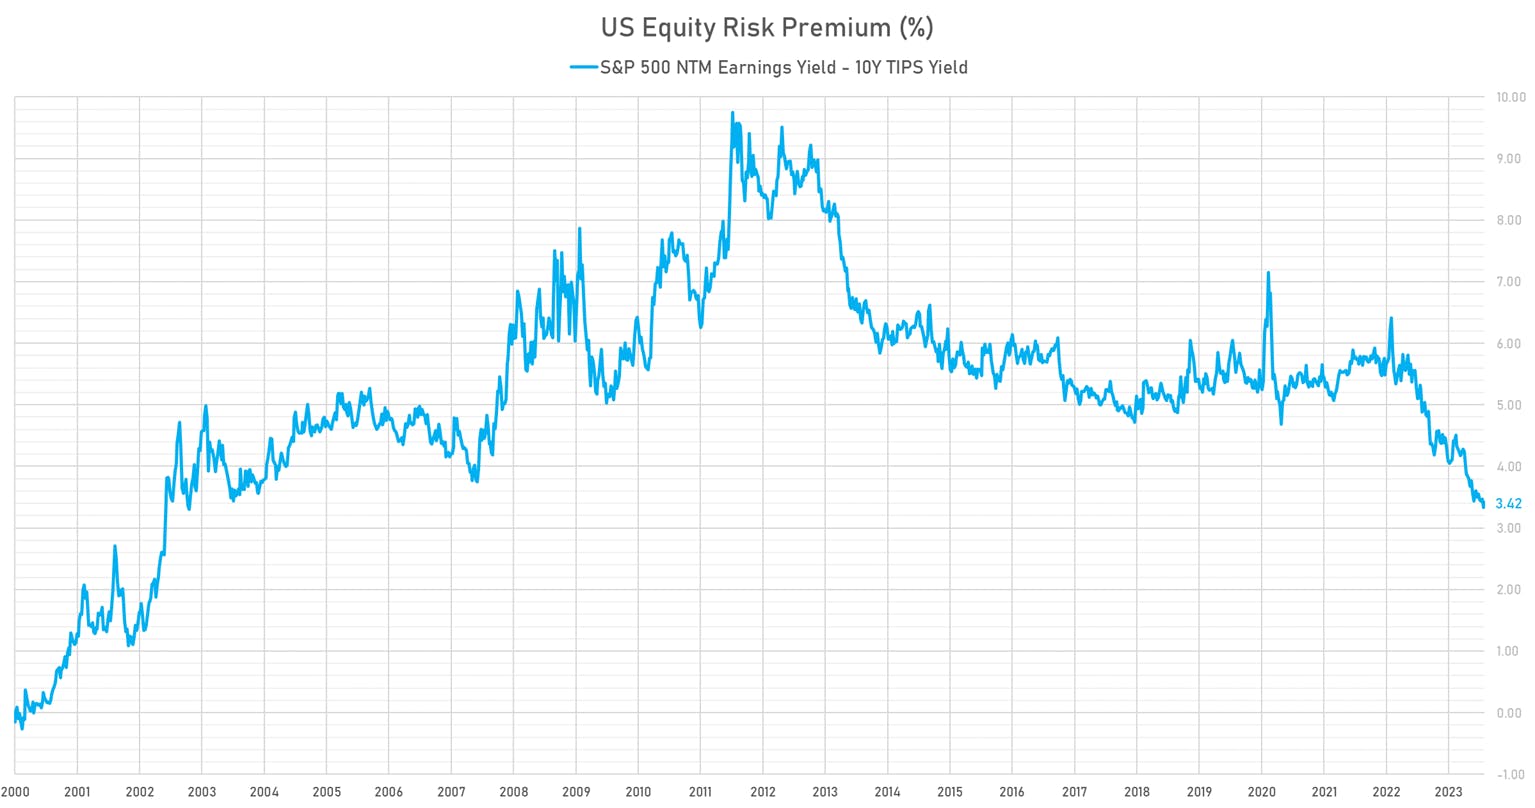
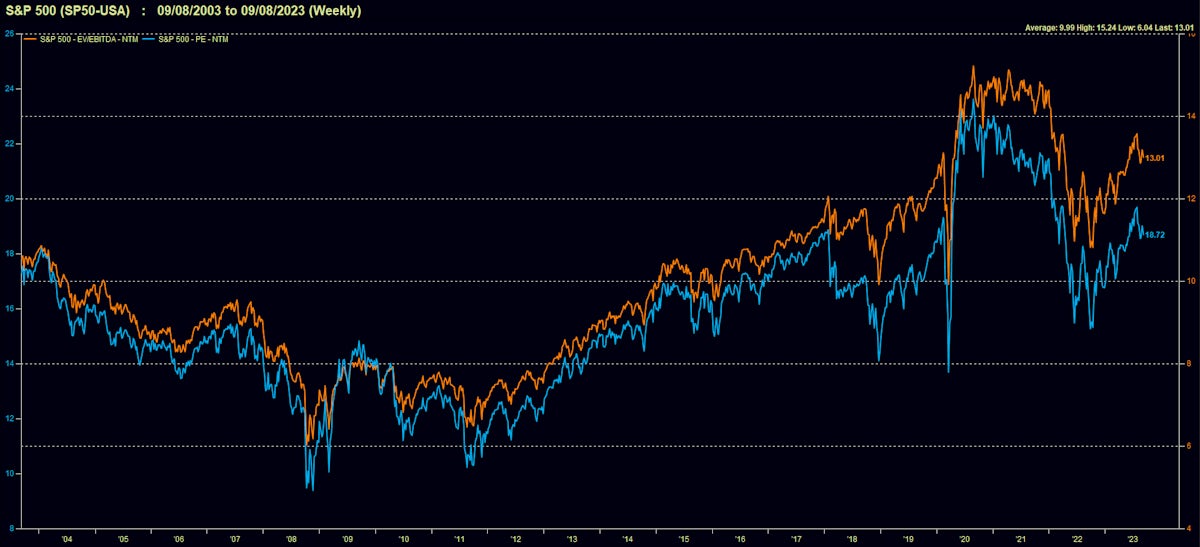
The rise in real yields mixed with an economic slowdown and tension between the US and China around technology have been driving valuations lower: the NTM P/E of Eurozone stocks is now back around 12x
Published ET
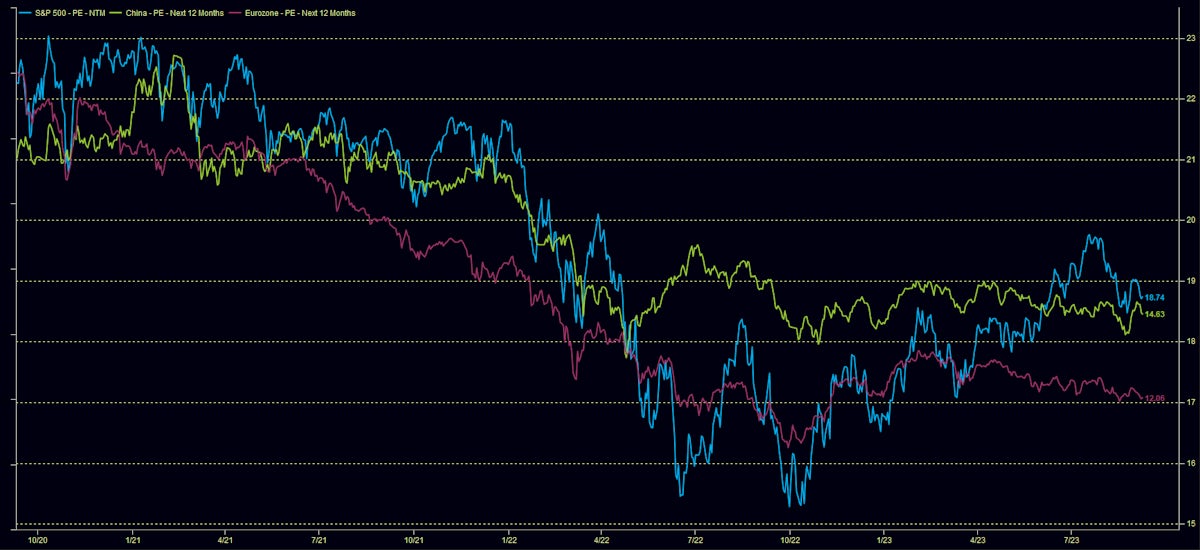
Global NTM P/E Multiples | Source: FactSet
DAILY SUMMARY
- Daily performance of US indices: S&P 500 up 0.14%; Nasdaq Composite up 0.09%; Wilshire 5000 up 0.06%
- 52.5% of S&P 500 stocks were up today, with 47.9% of stocks above their 200-day moving average (DMA) and 33.8% above their 50-DMA
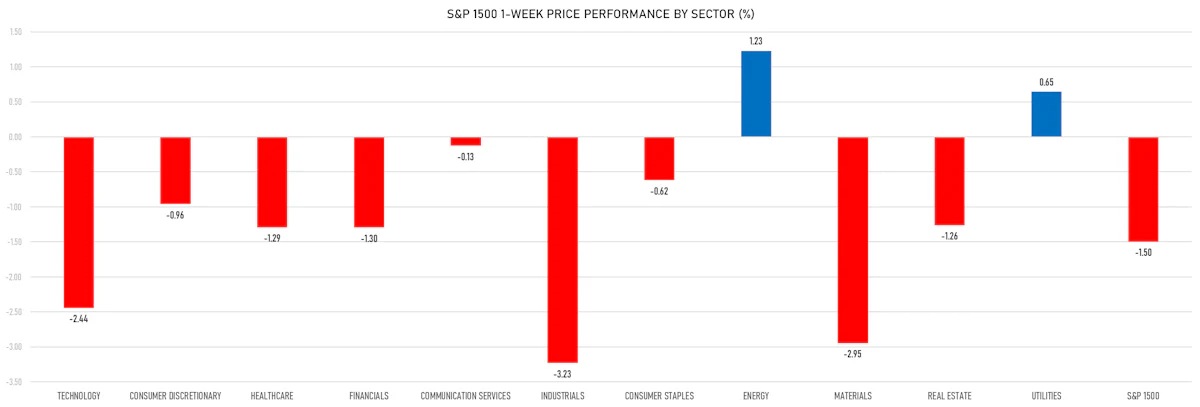
- Top performing sectors in the S&P 500: energy up 0.97% and utilities up 0.96%
- Bottom performing sectors in the S&P 500: real estate down -0.63% and industrials down -0.46%
- The number of shares in the S&P 500 traded today was 543m for a total turnover of US$ 56 bn
- The S&P 500 Value Index was up 0.2%, while the S&P 500 Growth Index was up 0.1%; the S&P small caps index was down -0.4% and mid-caps were down -0.2%
- The volume on CME's INX (S&P 500 Index) was 2,076.4m (3-month z-score: -0.5); the 3-month average volume is 2,267.0m and the 12-month range is 903.0 - 5,761.3m
- Daily performance of international indices: Europe Stoxx 600 up 0.22%; UK FTSE 100 up 0.49%; Hang Seng SH-SZ-HK 300 Index down -0.20%; Japan's TOPIX 500 down -1.02%
VOLATILITY TODAY
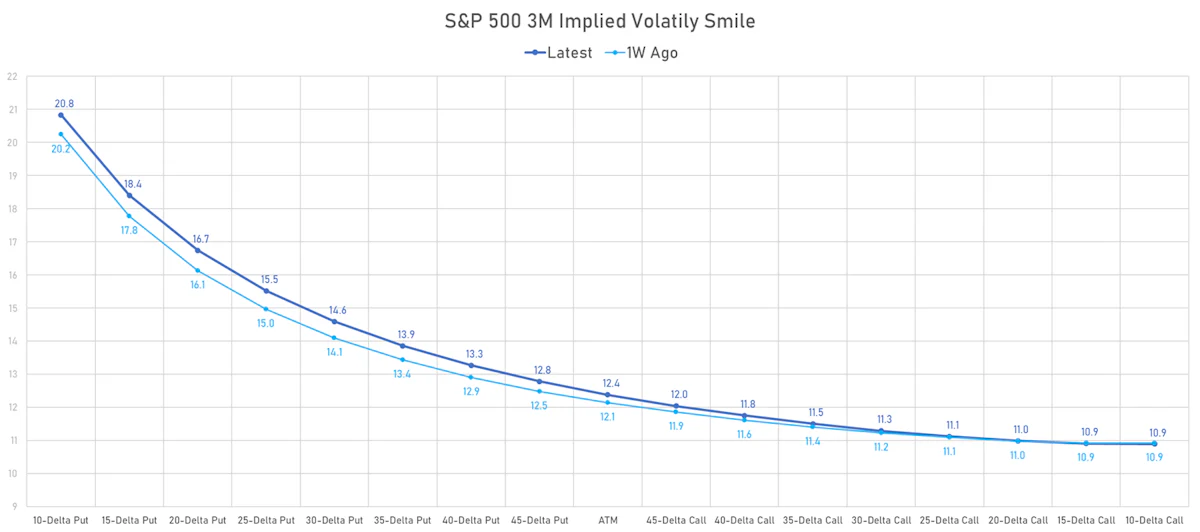
- 3-month at-the-money implied volatility on the S&P 500 at 11.0%, down from 11.5%
- 3-month at-the-money implied volatility on the STOXX Europe 600 at 11.5%, down from 11.9%
TOP WINNERS TODAY
- Canopy Growth Corp (CGC), up 22.6% to $0.93 / YTD price return: -59.7% / 12-Month Price Range: $ 0.35-4.77 / Short interest (% of float): 7.3%; days to cover: 1.0
- InnovAge Holding Corp (INNV), up 15.4% to $6.43 / YTD price return: -10.4% / 12-Month Price Range: $ 3.49-8.15 / Short interest (% of float): 2.4%; days to cover: 16.8
- SHENGFENG DEVELOPMENT Ltd (SFWL), up 14.9% to $8.73 / 12-Month Price Range: $ 2.94-12.45 / Short interest (% of float): 1.0%; days to cover: 0.3
- Burford Capital Ltd (BUR), up 14.7% to $15.91 / YTD price return: +95.2% / 12-Month Price Range: $ 6.09-15.91 / Short interest (% of float): 1.1%; days to cover: 3.8
- Trinseo PLC (TSE), up 12.9% to $8.59 / YTD price return: -62.2% / 12-Month Price Range: $ 7.43-30.54 / Short interest (% of float): 5.7%; days to cover: 4.3 (the stock is currently on the short sale restriction list)
- Controladora Vuela Compania de Aviacion SAB de CV (VLRS), up 12.2% to $10.19 / YTD price return: +21.9% / 12-Month Price Range: $ 6.86-15.05 / Short interest (% of float): 0.6%; days to cover: 1.4
- Pharvaris NV (PHVS), up 11.7% to $21.22 / YTD price return: +88.6% / 12-Month Price Range: $ 1.77-26.86 / Short interest (% of float): 0.1%; days to cover: 0.2
- Priority Technology Holdings Inc (PRTH), up 11.5% to $3.48 / YTD price return: -33.8% / 12-Month Price Range: $ 2.62-6.16 / Short interest (% of float): 1.0%; days to cover: 7.4
- GigaCloud Technology Inc (GCT), up 11.0% to $16.40 / YTD price return: +188.2% / 12-Month Price Range: $ 4.14-22.65 / Short interest (% of float): 1.7%; days to cover: 0.7
- Guidewire Software Inc (GWRE), up 11.0% to $94.15 / YTD price return: +50.5% / 12-Month Price Range: $ 52.08-94.15 / Short interest (% of float): 2.8%; days to cover: 4.9
BIGGEST LOSERS TODAY
- Karat Packaging Inc (KRT), down 19.3% to $20.38 / YTD price return: +47.4% / 12-Month Price Range: $ 12.02-26.69 / Short interest (% of float): 0.6%; days to cover: 0.9 (the stock is currently on the short sale restriction list)
- IHS Holding Ltd (IHS), down 18.6% to $5.95 / YTD price return: -3.3% / 12-Month Price Range: $ 4.91-10.13 / Short interest (% of float): 0.3%; days to cover: 1.7 (the stock is currently on the short sale restriction list)
- RH (RH), down 15.6% to $310.95 / YTD price return: +16.4% / 12-Month Price Range: $ 227.00-406.38 / Short interest (% of float): 20.1%; days to cover: 4.0 (the stock is currently on the short sale restriction list)
- Nikola Corp (NKLA), down 15.4% to $.88 / YTD price return: -59.3% / 12-Month Price Range: $ .52-5.58 / Short interest (% of float): 20.8%; days to cover: 1.6 (the stock is currently on the short sale restriction list)
- Calavo Growers Inc (CVGW), down 14.6% to $28.08 / YTD price return: -4.5% / 12-Month Price Range: $ 22.64-38.97 / Short interest (% of float): 4.3%; days to cover: 5.3 (the stock is currently on the short sale restriction list)
- Rackspace Technology Inc (RXT), down 12.8% to $1.88 / YTD price return: -36.4% / 12-Month Price Range: $ 1.05-6.45 / Short interest (% of float): 3.4%; days to cover: 3.6 (the stock is currently on the short sale restriction list)
- Marathon Digital Holdings Inc (MARA), down 11.7% to $10.91 / YTD price return: +219.0% / 12-Month Price Range: $ 3.11-19.88 (the stock is currently on the short sale restriction list)
- AMC Entertainment Holdings Inc (AMC), down 11.6% to $7.18 / YTD price return: -80.0% / 12-Month Price Range: $ 7.18-94.85 / Short interest (% of float): 10.8%; days to cover: 3.3 (the stock is currently on the short sale restriction list)
- Planet Labs PBC (PL), down 11.0% to $2.74 / YTD price return: -37.0% / 12-Month Price Range: $ 2.74-7.52 / Short interest (% of float): 4.3%; days to cover: 6.5 (the stock is currently on the short sale restriction list)
- Zumiez Inc (ZUMZ), down 10.2% to $16.76 / YTD price return: -22.9% / 12-Month Price Range: $ 13.19-28.97 (the stock is currently on the short sale restriction list)
TOP S&P 500 PERFORMERS THIS WEEK
- Centene Corp (CNC), up 6.8% to $65.41 / YTD price return: -20.2% / 12-Month Price Range: $ 60.84-93.57 / Short interest (% of float): 1.1%; days to cover: 1.7
- Marathon Petroleum Corp (MPC), up 6.4% to $155.31 / YTD price return: +33.4% / 12-Month Price Range: $ 89.40-155.31 / Short interest (% of float): 3.1%; days to cover: 3.7
- Valero Energy Corp (VLO), up 6.3% to $142.06 / YTD price return: +12.0% / 12-Month Price Range: $ 97.76-150.34 / Short interest (% of float): 3.2%; days to cover: 3.1
- CF Industries Holdings Inc (CF), up 5.7% to $83.74 / YTD price return: -1.7% / 12-Month Price Range: $ 60.09-112.17 / Short interest (% of float): 2.0%; days to cover: 1.6
- Eli Lilly and Co (LLY), up 5.3% to $586.46 / YTD price return: +60.3% / 12-Month Price Range: $ 296.32-586.46 / Short interest (% of float): 0.5%
- Fortinet Inc (FTNT), up 5.3% to $64.07 / YTD price return: +31.0% / 12-Month Price Range: $ 42.69-81.23 / Short interest (% of float): 1.6%; days to cover: 1.4
- Westrock Co (WRK), up 5.2% to $34.57 / YTD price return: -1.7% / 12-Month Price Range: $ 26.84-41.76 / Short interest (% of float): 1.4%; days to cover: 1.4
- Oracle Corp (ORCL), up 4.5% to $126.32 / YTD price return: +54.5% / 12-Month Price Range: $ 60.79-127.54
- Phillips 66 (PSX), up 4.3% to $122.23 / YTD price return: +17.4% / 12-Month Price Range: $ 74.02-122.23 / Short interest (% of float): 2.1%; days to cover: 2.9
- Intel Corp (INTC), up 3.8% to $38.01 / YTD price return: +43.8% / 12-Month Price Range: $ 24.59-38.34 / Short interest (% of float): 1.4%; days to cover: 1.6
BOTTOM S&P 500 PERFORMERS THIS WEEK
- Organon & Co (OGN), down 12.9% to $19.29 / YTD price return: -30.9% / 12-Month Price Range: $ 18.88-32.43 / Short interest (% of float): 2.7%; days to cover: 3.0
- FMC Corp (FMC), down 12.3% to $75.46 / YTD price return: -39.5% / 12-Month Price Range: $ 74.85-134.38 / Short interest (% of float): 1.7%; days to cover: 1.4
- Align Technology Inc (ALGN), down 11.4% to $332.26 / YTD price return: +57.5% / 12-Month Price Range: $ 172.29-412.42 / Short interest (% of float): 3.2%; days to cover: 2.8
- Seagate Technology Holdings PLC (STX), down 11.3% to $65.37 / YTD price return: +24.3% / 12-Month Price Range: $ 47.47-74.51 / Short interest (% of float): 7.1%; days to cover: #N/A
- Las Vegas Sands Corp (LVS), down 11.0% to $48.87 / YTD price return: +1.7% / 12-Month Price Range: $ 33.39-65.58 / Short interest (% of float): 3.2%; days to cover: 2.6
- Insulet Corp (PODD), down 10.5% to $171.92 / YTD price return: -41.6% / 12-Month Price Range: $ 170.87-335.84 / Short interest (% of float): 4.1%; days to cover: 3.9
- ETSY Inc (ETSY), down 10.1% to $67.13 / YTD price return: -44.0% / 12-Month Price Range: $ 67.13-149.84 / Short interest (% of float): 6.9%
- Skyworks Solutions Inc (SWKS), down 9.4% to $99.38 / YTD price return: +9.1% / 12-Month Price Range: $ 76.17-123.69 / Short interest (% of float): 1.6%; days to cover: 1.6
- Bio Rad Laboratories Inc (BIO), down 9.3% to $357.91 / YTD price return: -14.9% / 12-Month Price Range: $ 344.63-513.65 / Short interest (% of float): 2.0%; days to cover: 1.8
- Sealed Air Corp (SEE), down 8.9% to $33.96 / YTD price return: -31.9% / 12-Month Price Range: $ 33.48-56.42 / Short interest (% of float): 2.1%; days to cover: 1.6
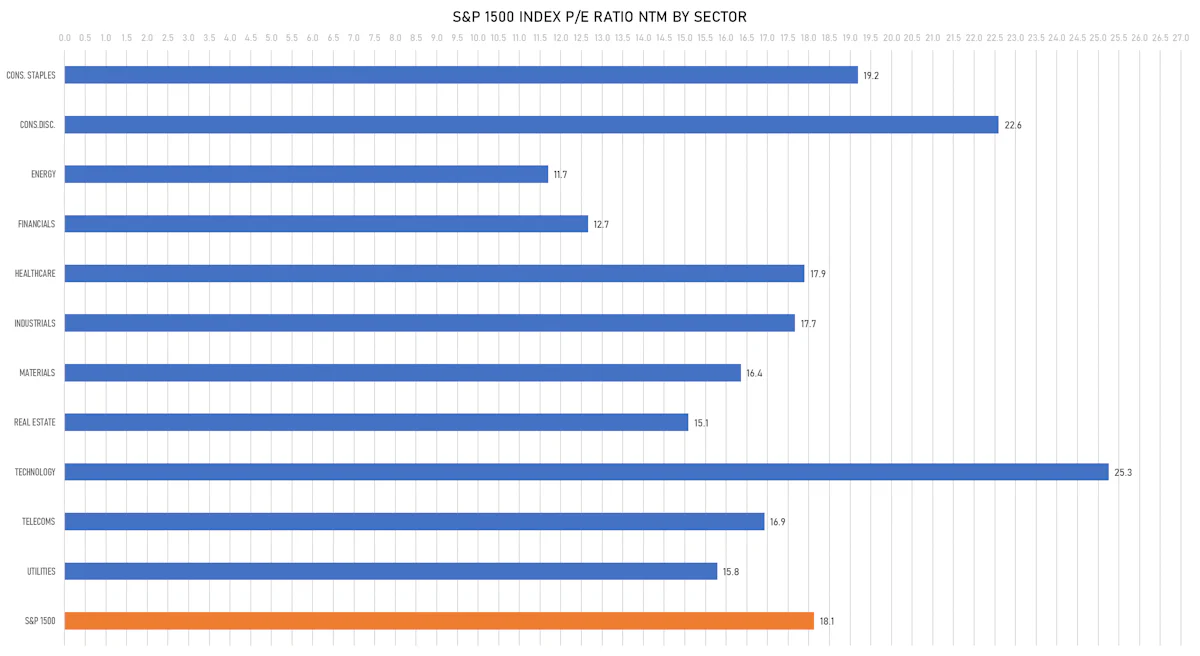
VALUATION MULTIPLES BY SECTORS
WEEKLY TOTAL RETURNS OF MAJOR GLOBAL EQUITY MARKETS
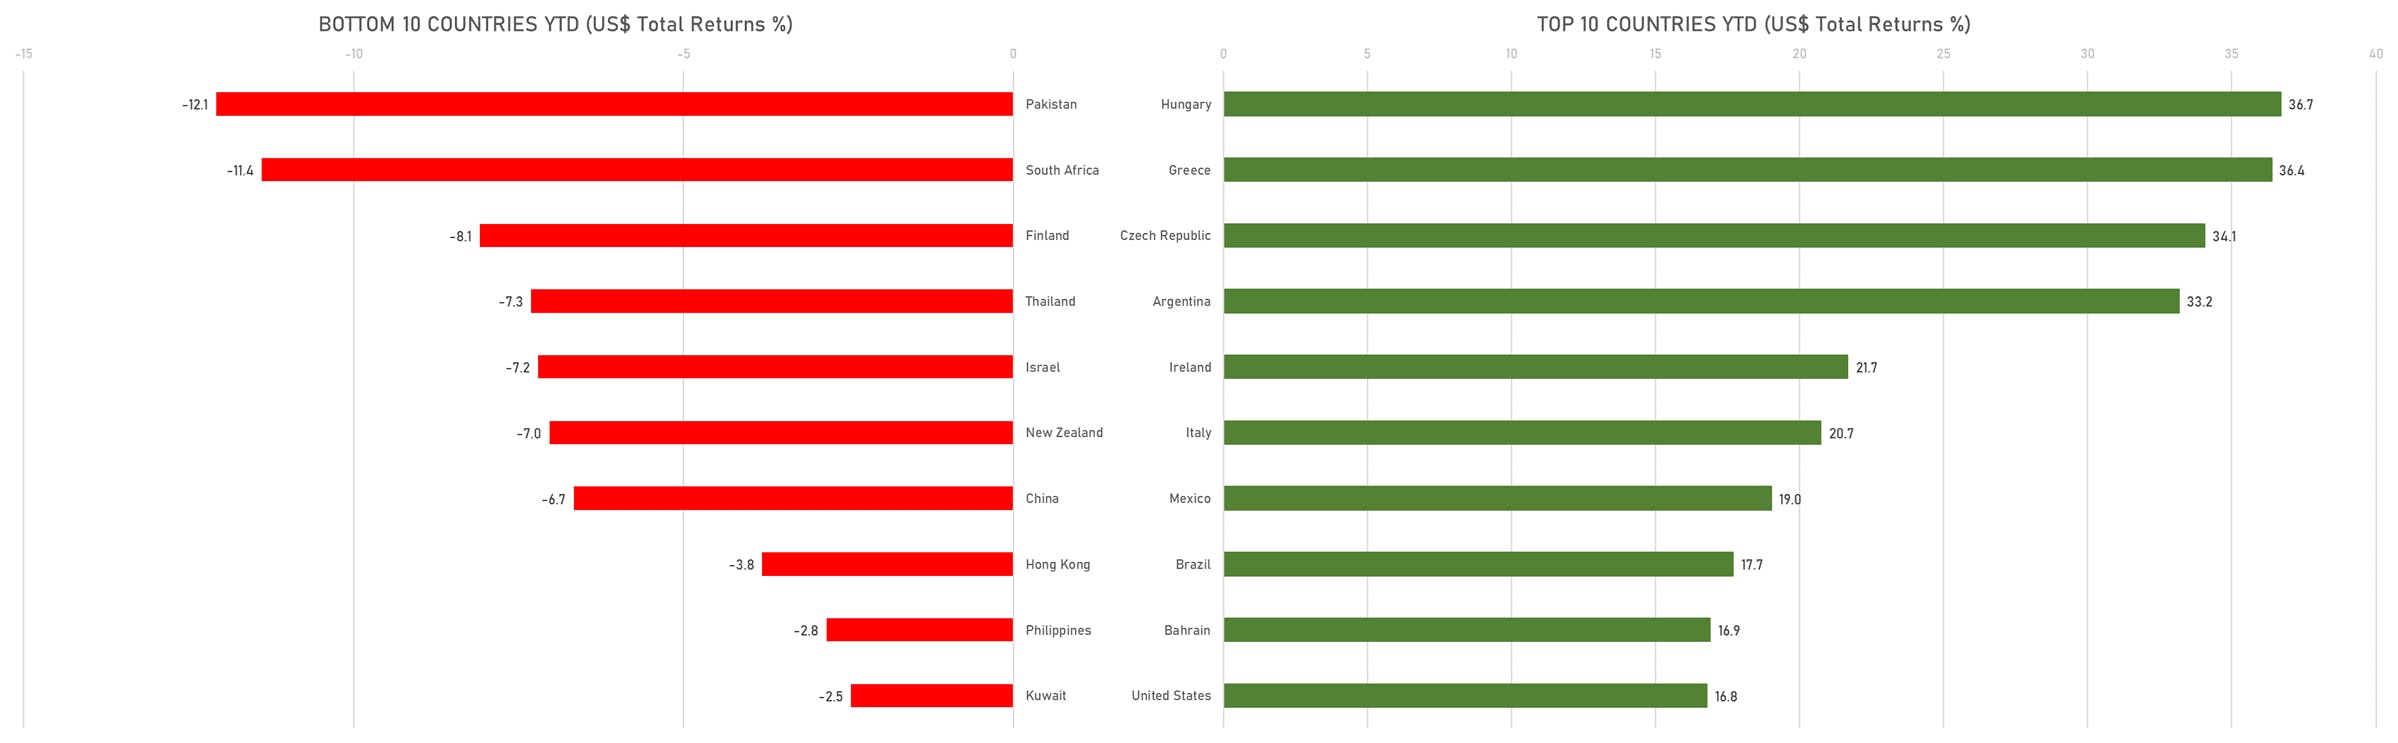
TOP / BOTTOM PERFORMING WORLD MARKETS YTD
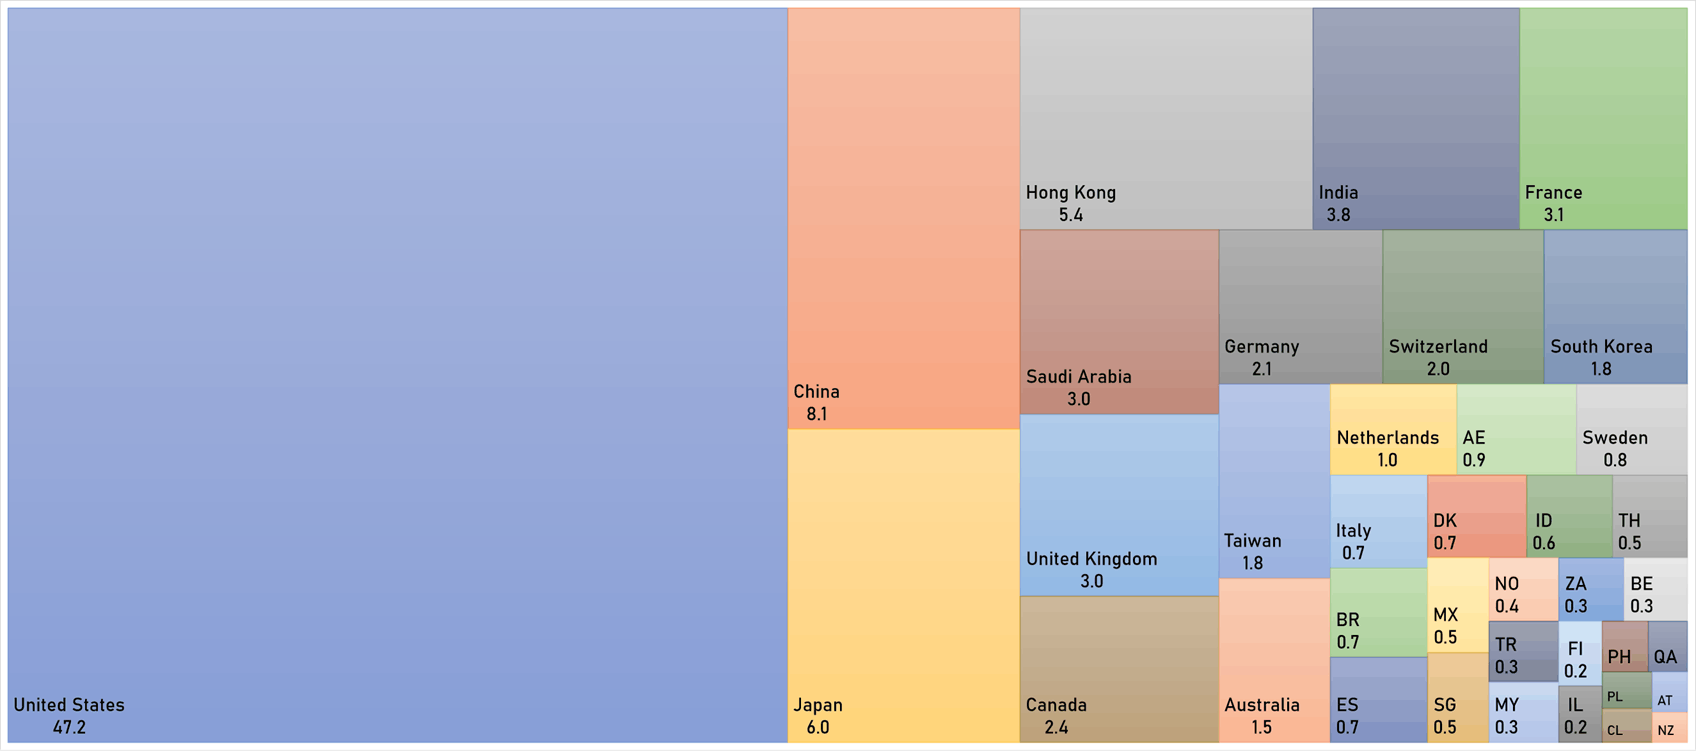
WORLD MARKET CAPITALIZATION (US$ Trillion)