Equities
US Equities Close Slightly Lower On Global Growth Concerns
Renewed lockdowns across Asia-Pacific as well as lukewarm US ISM data led stocks to take a small pause close to all-time highs
Published ET

S&P 100 Market Caps | Sources: ϕpost, FactSet data
QUICK SUMMARY
- Daily performance of US indices: S&P 500 down -0.18%; Nasdaq Composite up 0.06%; Wilshire 5000 down -0.13%
- 42.0% of S&P 500 stocks were up today, with 85.3% of stocks above their 200-day moving average (DMA) and 54.3% above their 50-DMA
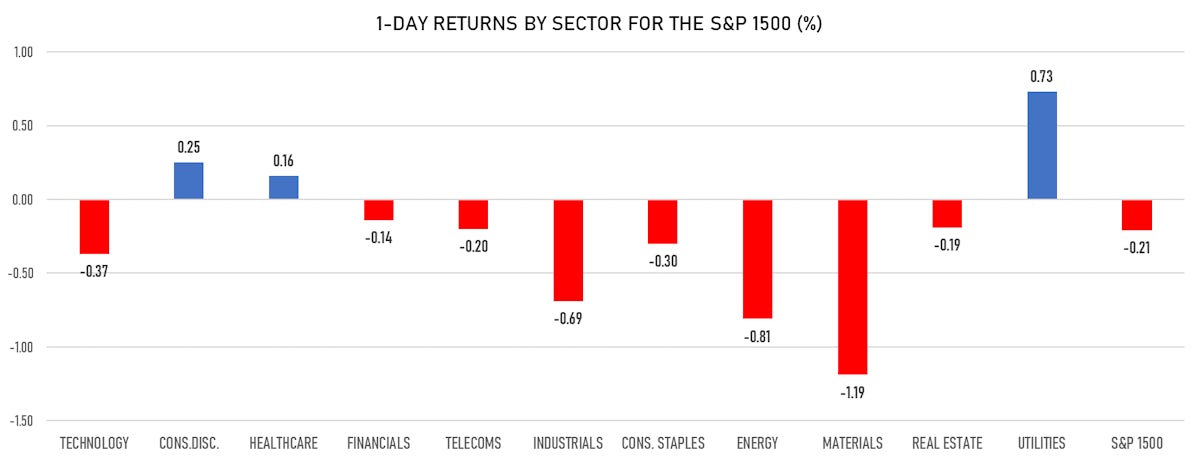
- Top performing sectors in the S&P 500: utilities up 0.75% and consumer discretionary up 0.28%
- Bottom performing sectors in the S&P 500: materials down -1.17% and industrials down -0.73%
- The number of shares in the S&P 500 traded today was 505m for a total turnover of US$ 61 bn
- The S&P 500 Value Index was down -0.3%, while the S&P 500 Growth Index was down -0.1%; the S&P small caps index was down -0.5% and mid caps were down -0.4%
- The volume on CME's INX (S&P 500 Index) was 2.0m (3-month z-score: -0.3); the 3-month average volume is 2.1m and the 12-month range is 0.8 - 5.1m
- Daily performance of international indices: Europe Stoxx 600 up 0.59%; UK FTSE 100 up 0.70%; tonight in Asia, China's CSI 300 is unchanged and Japan's TOPIX 500 down -0.77%
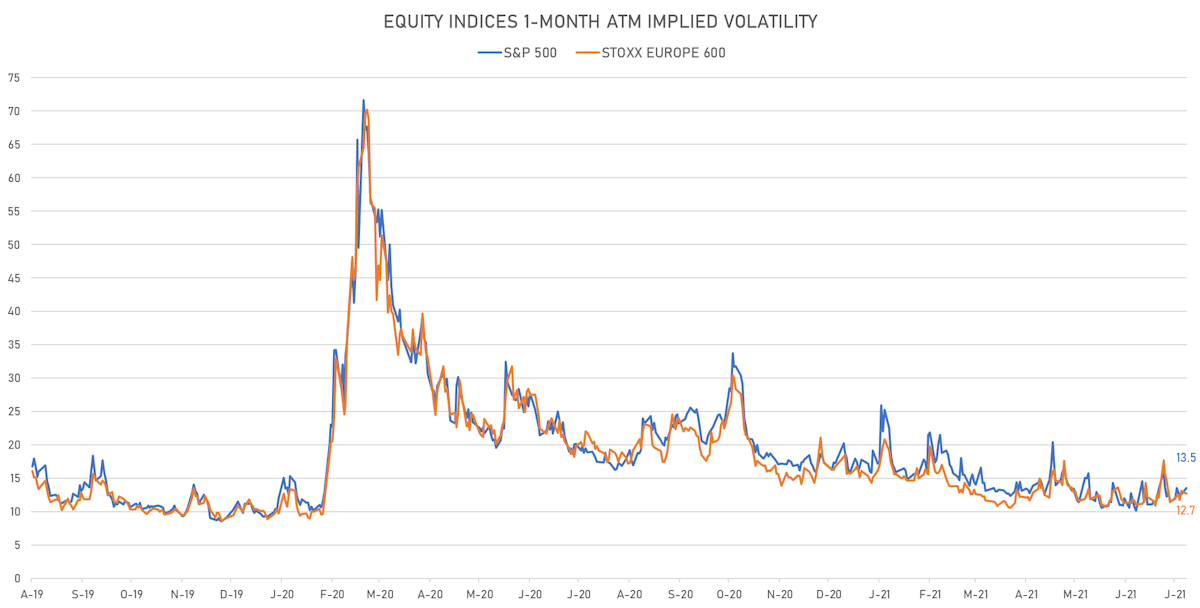
VOLATILITY
- 1-month at-the-money implied volatility on the S&P 500 at 13.5%, up from 12.6%
- 1-month at-the-money implied volatility on the Europe Stoxx 600 at 12.7%, down from 13.1%
NOTABLE S&P 500 EARNINGS RELEASES
- Microsoft Corp (Technology): beat on EPS (2.17 act. vs. 1.92 est.) and beat on revenue (46,152m act. vs. 44,243m est.)
- Qualcomm Inc (Technology): beat on EPS (1.92 act. vs. 1.68 est.) and beat on revenue (7,995m act. vs. 7,579m est.)
- 3M Co (Consumer Non-Cyclicals): beat on EPS (2.59 act. vs. 2.28 est.) and beat on revenue (8,950m act. vs. 8,565m est.)
- Prologis Inc (Real Estate): beat on EPS (0.81 act. vs. 0.44 est.) and missed on revenue (1,015m act. vs. 1,024m est.)
- Global Payments Inc (Industrials): beat on EPS (2.04 act. vs. 1.90 est.) and beat on revenue (1,941m act. vs. 1,858m est.)
- TransDigm Group Inc (Industrials): beat on EPS (2.58 act. vs. 2.51 est.) and beat on revenue (1,194m act. vs. 1,175m est.)
- American Water Works Company Inc (Utilities): beat on EPS (1.14 act. vs. 0.73 est.) and beat on revenue (999m act. vs. 847m est.)
- Williams Companies Inc (Energy): missed on EPS (0.27 act. vs. 0.28 est.) and beat on revenue (2,283m act. vs. 2,068m est.)
- Arista Networks Inc (Technology): beat on EPS (2.72 act. vs. 2.54 est.) and beat on revenue (707m act. vs. 688m est.)
- ONEOK Inc (Energy): beat on EPS (0.86 act. vs. 0.77 est.) and beat on revenue (3,195m act. vs. 2,776m est.)
- Take-Two Interactive Software Inc (Consumer Cyclicals): beat on EPS (1.40 act. vs. 0.89 est.) and beat on revenue (785m act. vs. 688m est.)
- Eastman Chemical Co (Basic Materials): beat on EPS (2.13 act. vs. 2.04 est.) and beat on revenue (2,409m act. vs. 2,330m est.)
- Diamondback Energy Inc (Energy): beat on EPS (2.40 act. vs. 2.19 est.) and beat on revenue (1,681m act. vs. 1,353m est.)
- Wynn Resorts Ltd (Consumer Cyclicals): missed on EPS (-2.41 act. vs. -1.98 est.) and missed on revenue (726m act. vs. 758m est.)
- Nielsen Holdings PLC (Consumer Cyclicals): beat on EPS (0.43 act. vs. 0.36 est.) and beat on revenue (861m act. vs. 851m est.)
- Vornado Realty Trust (Real Estate): beat on EPS (0.14 act. vs. 0.10 est.) and beat on revenue (379m act. vs. 379m est.)
- Leggett & Platt Inc (Consumer Cyclicals): beat on EPS (0.66 act. vs. 0.43 est.) and beat on revenue (1,270m act. vs. 1,140m est.)
TOP WINNERS
- Clear Secure Inc (YOU), up 25.6% to $62.10 / 12-Month Price Range: $ 38.26-53.97 / Short interest (% of float): 2.9%; days to cover: 0.1
- Full Truck Alliance Co Ltd (YMM), up 23.5% to $11.70 / 12-Month Price Range: $ 7.95-22.80 / Short interest (% of float): 1.1%; days to cover: 1.2
- Nuvalent Inc (NUVL), up 20.1% to $21.91 / 12-Month Price Range: $ 17.00-21.39
- Cassava Sciences Inc (SAVA), up 15.0% to $79.98 / YTD price return: +1,072.7% / 12-Month Price Range: $ 2.78-146.16 / Short interest (% of float): 11.8%; days to cover: 1.4
- Affirm Holdings Inc (AFRM), up 14.9% to $64.71 / 12-Month Price Range: $ 46.50-146.90
- Canaan Inc (CAN), up 12.5% to $7.74 / YTD price return: +30.5% / 12-Month Price Range: $ 1.80-39.10 / Short interest (% of float): 4.9%; days to cover: 1.0
- ON Semiconductor Corp (ON), up 11.7% to $43.64 / YTD price return: +33.3% / 12-Month Price Range: $ 19.75-44.59 / Short interest (% of float): 4.0%; days to cover: 3.4
- Betterware de Mexico SAB de CV (BWMX), up 10.9% to $47.15 / 12-Month Price Range: $ 11.02-50.11 / Short interest (% of float): 1.0%; days to cover: 0.9
- Faraday Future Intelligent Electric Inc (FFIE), up 10.9% to $13.40 / YTD price return: +34.0% / 12-Month Price Range: $ 9.65-20.75 / Short interest (% of float): 2.3%; days to cover: 7.6
- Upstart Holdings Inc (UPST), up 10.5% to $133.41 / YTD price return: +227.4% / 12-Month Price Range: $ 22.61-191.89 / Short interest (% of float): 4.2%; days to cover: 0.5
BIGGEST LOSERS
- TG Therapeutics Inc (TGTX), down 21.6% to $27.42 / YTD price return: -47.3% / 12-Month Price Range: $ 17.67-56.74 / Short interest (% of float): 8.4%; days to cover: 12.0 (the stock is currently on the short sale restriction list)
- EVgo Inc (EVGO), down 16.2% to $9.96 / YTD price return: -7.0% / 12-Month Price Range: $ 9.75-24.34 / Short interest (% of float): 2.1%; days to cover: 4.1 (the stock is currently on the short sale restriction list)
- Blue Owl Capital Inc (OWL), down 12.5% to $12.47 / YTD price return: +9.6% / 12-Month Price Range: $ 9.35-17.36 / Short interest (% of float): 1.7%; days to cover: 5.1 (the stock is currently on the short sale restriction list)
- Global Payments Inc (GPN), down 11.2% to $171.79 / YTD price return: -20.3% / 12-Month Price Range: $ 153.33-220.81 / Short interest (% of float): 2.4%; days to cover: 4.4 (the stock is currently on the short sale restriction list)
- OppFi Inc (OPFI), down 10.3% to $8.92 / 12-Month Price Range: $ 9.54-11.60 / Short interest (% of float): 0.9%; days to cover: 3.1 (the stock is currently on the short sale restriction list)
- Telephone and Data Systems Inc (TDS), down 9.8% to $20.16 / YTD price return: +8.6% / 12-Month Price Range: $ 16.38-26.51 / Short interest (% of float): 3.5%; days to cover: 2.3 (the stock is currently on the short sale restriction list)
- United States Cellular Corp (USM), down 9.5% to $32.91 / YTD price return: +7.2% / 12-Month Price Range: $ 28.19-39.96 / Short interest (% of float): 5.0%; days to cover: 3.0
- Erasca Inc (ERAS), down 8.2% to $19.28 / 12-Month Price Range: $ 14.51-21.31
- Quantum-Si Inc (QSI), down 8.2% to $8.65 / 12-Month Price Range: $ 7.85-25.00 / Short interest (% of float): 5.6%; days to cover: 3.4
- Establishment Labs Holdings Inc (ESTA), down 8.0% to $72.91 / YTD price return: +93.7% / 12-Month Price Range: $ 16.27-88.66 / Short interest (% of float): 1.3%; days to cover: 2.6
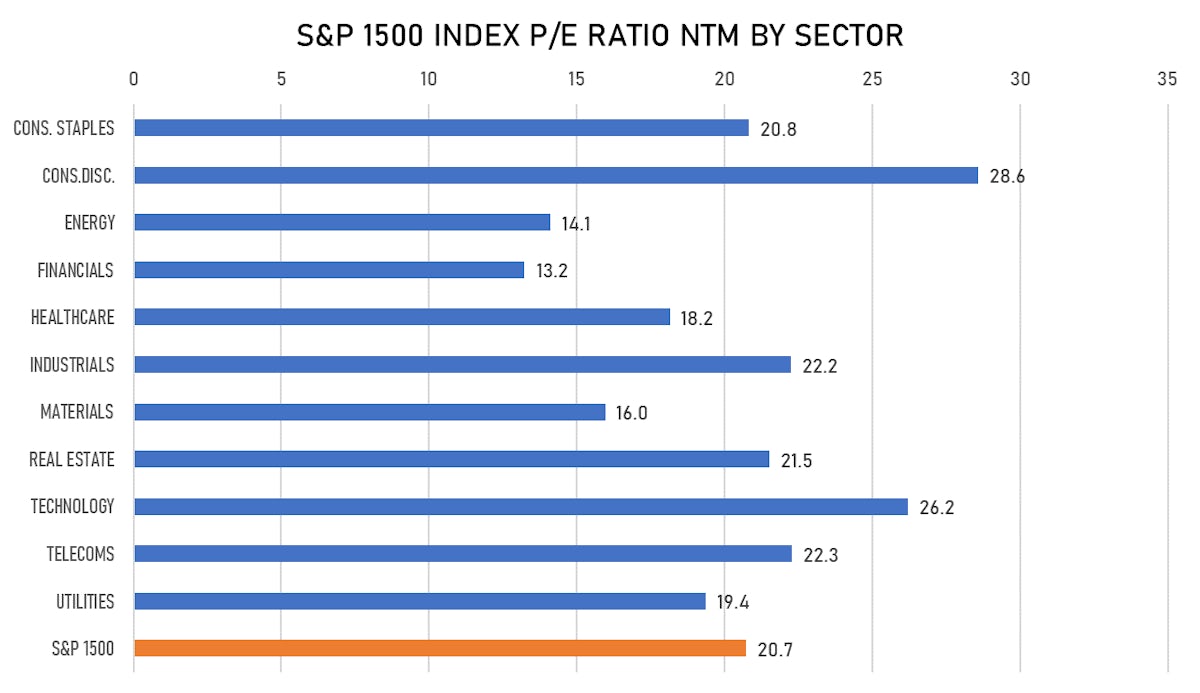
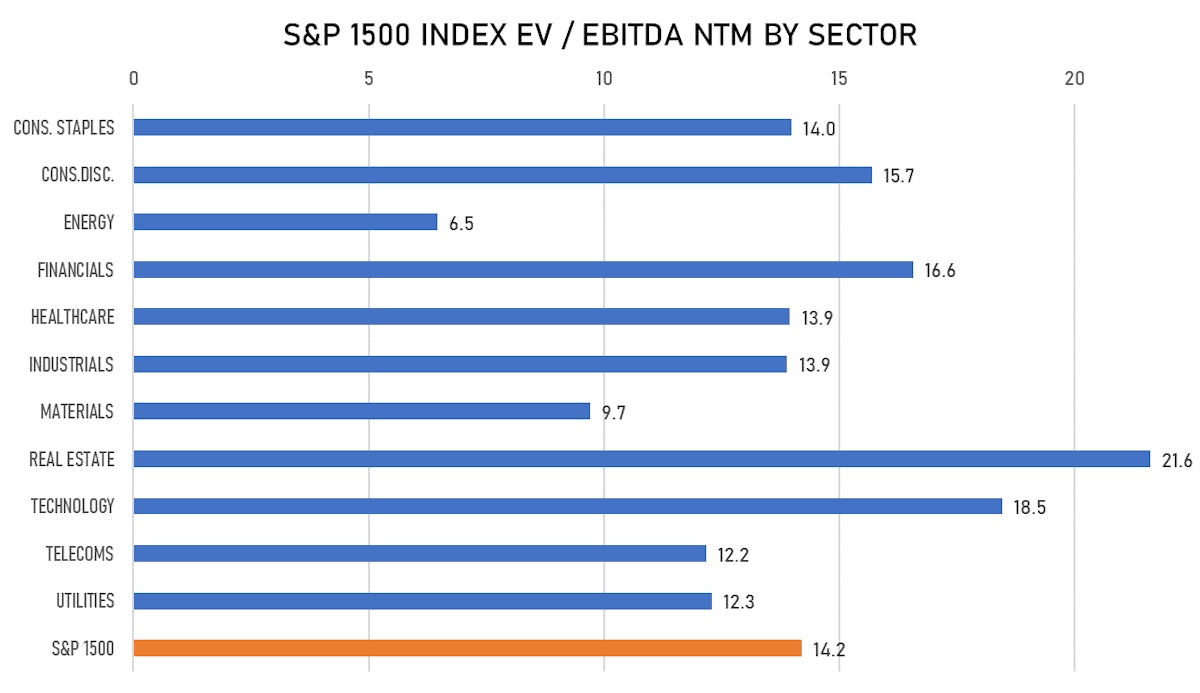
VALUATION MULTIPLES BY SECTORS
EQUITY FOLLOW-ONS / SECONDARY OFFERINGS
- Money Forward Inc / Japan - High Technology / Listing Exchange: Tokyo 1 / Ticker: 3994 / Gross proceeds (including overallotment): US$ 290.34m (offering in Japanese Yen) / Bookrunners: Goldman Sachs International, Merrill Lynch International Ltd, Mizuho International PLC
- AEON REIT Investment Corp / Japan - Real Estate / Listing Exchange: Tokyo / Ticker: 3292 / Gross proceeds (including overallotment): US$ 235.81m (offering in Japanese Yen) / Bookrunners: Nomura Securities Co Ltd, Daiwa Securities Group Inc, Mizuho Securities Co Ltd, SMBC Nikko Securities Inc