Equities
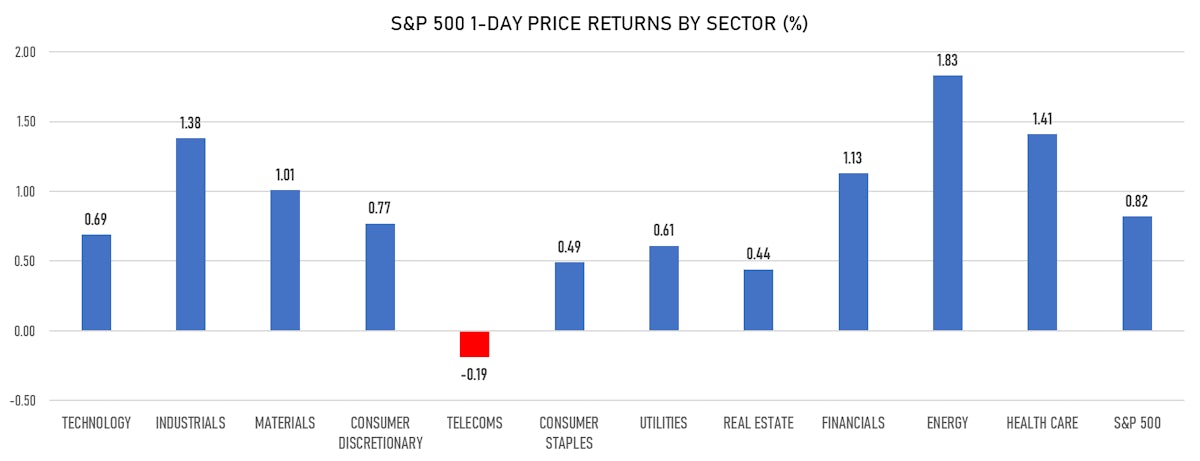
Broad Rise In US Stocks, Led By The Energy And Healthcare Sectors
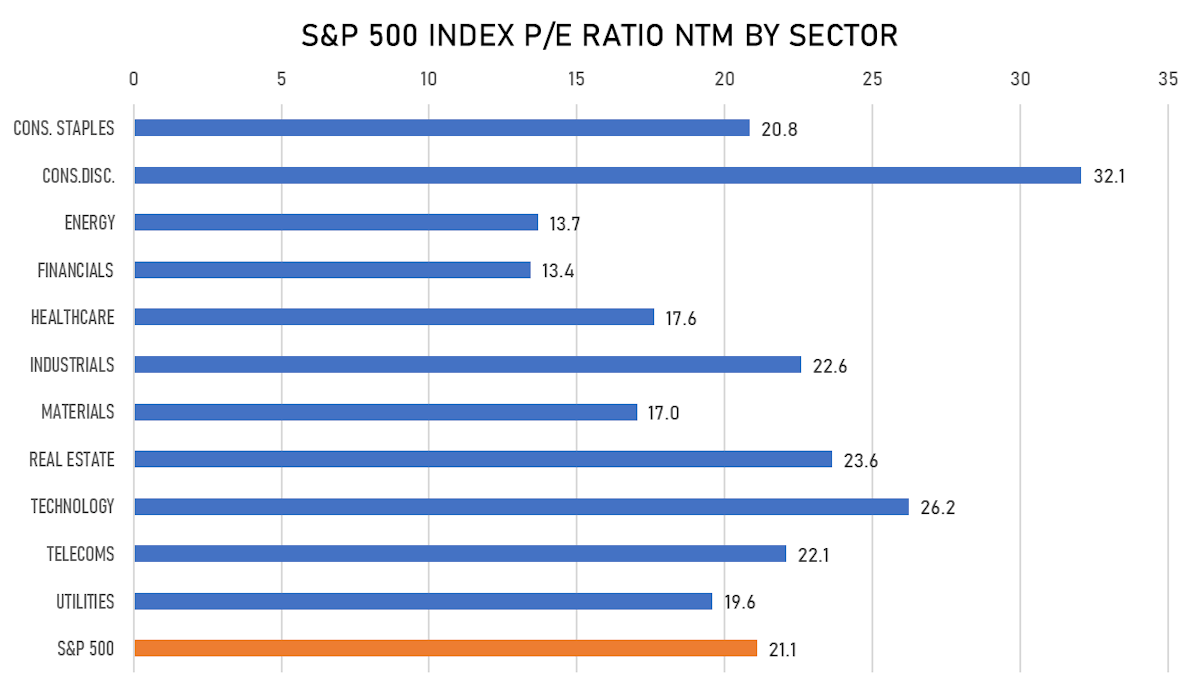
Almost 80% of the S&P 500 market capitalization has now reported earnings for Q2, and total returns in the past months have been driven by EPS expansion as P/E multiples have contracted slightly
Published ET

S& 500 1-Month Volatility Smile Has Gotten Slightly Steeper Over The Past Couple Of Weeks | Sources: ϕpost, Refinitiv data
QUICK SUMMARY
- Daily performance of US indices: S&P 500 up 0.82%; Nasdaq Composite up 0.55%; Wilshire 5000 up 0.68%
- 77.0% of S&P 500 stocks were up today, with 86.7% of stocks above their 200-day moving average (DMA) and 59.4% above their 50-DMA
- Top performing sectors in the S&P 500: energy up 1.83% and healthcare up 1.41%
- Bottom performing sectors in the S&P 500: telecoms down -0.19% and real estate up 0.44%
- The number of shares in the S&P 500 traded today was 559m for a total turnover of US$ 62 bn
- The S&P 500 Value Index was up 0.9%, while the S&P 500 Growth Index was up 0.8%; the S&P small caps index was up 0.8% and mid caps were up 0.6%
- The volume on CME's INX (S&P 500 Index) was 2.2m (3-month z-score: 0.3); the 3-month average volume is 2.1m and the 12-month range is 0.8 - 5.1m
- Daily performance of international indices: Europe Stoxx 600 up 0.20%; UK FTSE 100 up 0.34%; tonight in Asia, China CSI 300 down -0.23% and Japan's TOPIX 500 down -0.19%
VOLATILITY
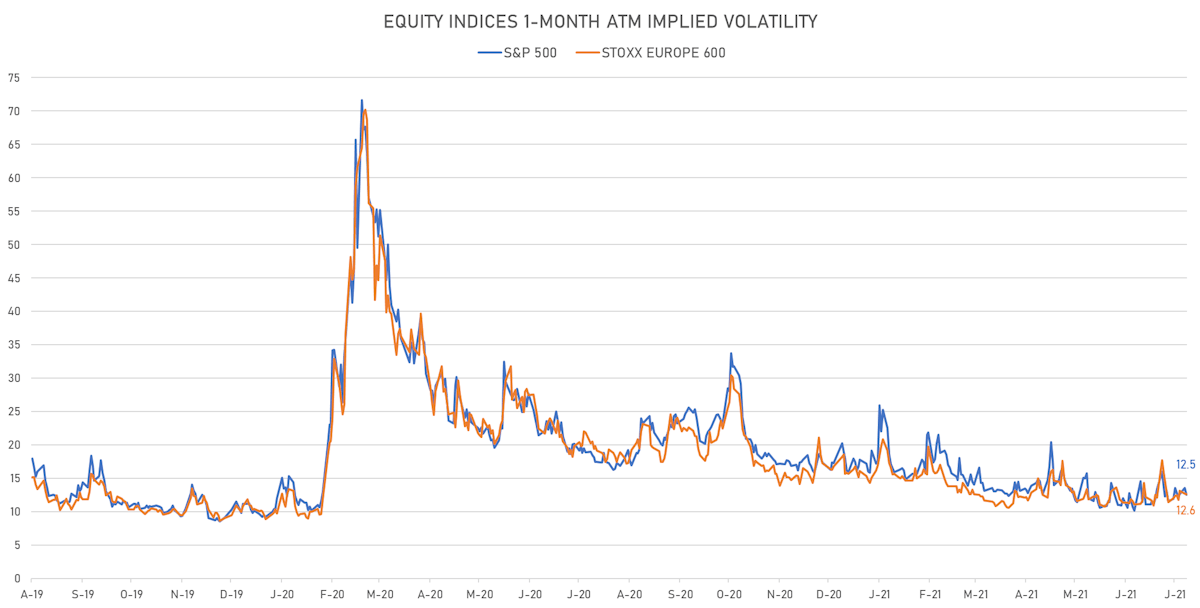
- 1-month at-the-money implied volatility on the S&P 500 at 12.5%, down from 13.5%
- 1-month at-the-money implied volatility on the Europe Stoxx 600 at 12.6%, down from 12.7%
NOTABLE S&P 500 EARNINGS RELEASES
- Eli Lilly and Co (Healthcare): missed on EPS (1.87 act. vs. 2.13 est.) and missed on revenue (6,740m act. vs. 6,988m est.)
- Amgen Inc (Healthcare): beat on EPS (4.38 act. vs. 4.05 est.) and beat on revenue (6,526m act. vs. 6,253m est.)
- Fidelity National Information Services Inc (Technology): beat on EPS (1.61 act. vs. 1.25 est.) and beat on revenue (3,475m act. vs. 3,161m est.)
- ConocoPhillips (Energy): beat on EPS (1.27 act. vs. 0.51 est.) and beat on revenue (9,953m act. vs. 8,069m est.)
- Activision Blizzard Inc (Technology): beat on EPS (1.21 act. vs. 0.70 est.) and beat on revenue (2,296m act. vs. 1,781m est.)
- Eaton Corporation PLC (Industrials): beat on EPS (1.72 act. vs. 1.23 est.) and beat on revenue (5,215m act. vs. 4,546m est.)
- Progressive Corp (Financials): missed on EPS (0.72 act. vs. 1.08 est.) and missed on revenue (11,480m act. vs. 11,522m est.)
- Public Storage (Real Estate): beat on EPS (1.97 act. vs. 1.77 est.) and missed on revenue (662m act. vs. 732m est.)
- Marriott International Inc (Consumer Cyclicals): beat on EPS (0.79 act. vs. 0.03 est.) and beat on revenue (3,149m act. vs. 2,361m est.)
- L3harris Technologies Inc (Industrials): beat on EPS (3.26 act. vs. 2.94 est.) and beat on revenue (4,668m act. vs. 4,541m est.)

- Microchip Technology Inc (Technology): beat on EPS (1.98 act. vs. 1.74 est.) and beat on revenue (1,569m act. vs. 1,456m est.)
- Dupont De Nemours Inc (Basic Materials): beat on EPS (1.06 act. vs. 0.76 est.) and beat on revenue (4,135m act. vs. 3,848m est.)
- Prudential Financial Inc (Financials): beat on EPS (3.79 act. vs. 2.76 est.) and missed on revenue (13,771m act. vs. 14,352m est.)
- Zimmer Biomet Holdings Inc (Healthcare): beat on EPS (1.90 act. vs. 1.53 est.) and beat on revenue (2,027m act. vs. 1,758m est.)
- Cummins Inc (Consumer Cyclicals): beat on EPS (4.15 act. vs. 3.47 est.) and beat on revenue (6,111m act. vs. 5,356m est.)
- Phillips 66 (Energy): beat on EPS (0.74 act. vs. -1.40 est.) and beat on revenue (24,756m act. vs. 18,566m est.)
- AMETEK Inc (Industrials): beat on EPS (1.15 act. vs. 1.01 est.) and beat on revenue (1,386m act. vs. 1,171m est.)
- Public Service Enterprise Group Inc (Utilities): missed on EPS (0.70 act. vs. 1.12 est.) and missed on revenue (1,874m act. vs. 3,268m est.)
- Verisk Analytics Inc (Technology): missed on EPS (1.17 act. vs. 1.25 est.) and beat on revenue (748m act. vs. 726m est.)
- WEC Energy Group Inc (Utilities): missed on EPS (0.87 act. vs. 1.47 est.) and missed on revenue (1,676m act. vs. 2,336m est.)
TOP WINNERS
- Arcturus Therapeutics Holdings Inc (ARCT), up 68.1% to $58.25 / YTD price return: +34.3% / 12-Month Price Range: $ 24.87-129.71
- Translate Bio Inc (TBIO), up 29.2% to $37.67 / YTD price return: +104.4% / 12-Month Price Range: $ 11.91-36.98
- Hollysys Automation Technologies Ltd (HOLI), up 28.2% to $19.87 / YTD price return: +35.3% / 12-Month Price Range: $ 9.83-16.31
- Robinhood Markets Inc (HOOD), up 24.2% to $46.80 / 12-Month Price Range: $ 33.25-40.25
- Harmonic Inc (HLIT), up 23.0% to $10.63 / YTD price return: +43.8% / 12-Month Price Range: $ 5.20-9.20
- Solaredge Technologies Inc (SEDG), up 16.3% to $299.81 / YTD price return: -6.1% / 12-Month Price Range: $ 162.60-377.00
- Myriad Genetics Inc (MYGN), up 14.2% to $35.23 / YTD price return: +78.2% / 12-Month Price Range: $ 11.76-34.02
- Ree Automotive Holding Inc (REE), up 13.2% to $10.01 / 12-Month Price Range: $ 7.81-16.66
- Atkore Inc (ATKR), up 13.2% to $83.93 / YTD price return: +104.2% / 12-Month Price Range: $ 20.42-90.08
- Traeger Inc (COOK), up 11.9% to $27.07 / 12-Month Price Range: $ 21.95-24.88
BIGGEST LOSERS
- Bright Health Group Inc (BHG), down 22.3% to $8.49 / 12-Month Price Range: $ 10.23-17.93 / Short interest (% of float): 0.6%; days to cover: 1.6 (the stock is currently on the short sale restriction list)
- IPG Photonics Corp (IPGP), down 18.3% to $177.69 / YTD price return: -20.6% / 12-Month Price Range: $ 149.51-262.55 (the stock is currently on the short sale restriction list)
- Clear Secure Inc (YOU), down 16.0% to $52.14 / 12-Month Price Range: $ 38.26-62.51 / Short interest (% of float): 2.9%; days to cover: 0.1 (the stock is currently on the short sale restriction list)
- Ultra Clean Holdings Inc (UCTT), down 14.2% to $46.43 / YTD price return: +49.1% / 12-Month Price Range: $ 19.08-65.33 (the stock is currently on the short sale restriction list)
- Scholar Rock Holding Corp (SRRK), down 11.9% to $30.27 / YTD price return: -37.6% / 12-Month Price Range: $ 11.33-70.00 (the stock is currently on the short sale restriction list)
- NetEase Inc (NTES), down 11.4% to $93.06 / YTD price return: -2.8% / 12-Month Price Range: $ 82.50-134.33 / Short interest (% of float): 6.7%; days to cover: 2.5 (the stock is currently on the short sale restriction list)
- Leidos Holdings Inc (LDOS), down 10.9% to $95.39 / YTD price return: -9.3% / 12-Month Price Range: $ 79.15-113.75 / Short interest (% of float): 0.9%; days to cover: 2.0 (the stock is currently on the short sale restriction list)
- Bausch Health Companies Inc (BHC), down 10.8% to $26.44 / YTD price return: +27.1% / 12-Month Price Range: $ 14.86-34.80 / Short interest (% of float): 5.0%; days to cover: 9.9 (the stock is currently on the short sale restriction list)
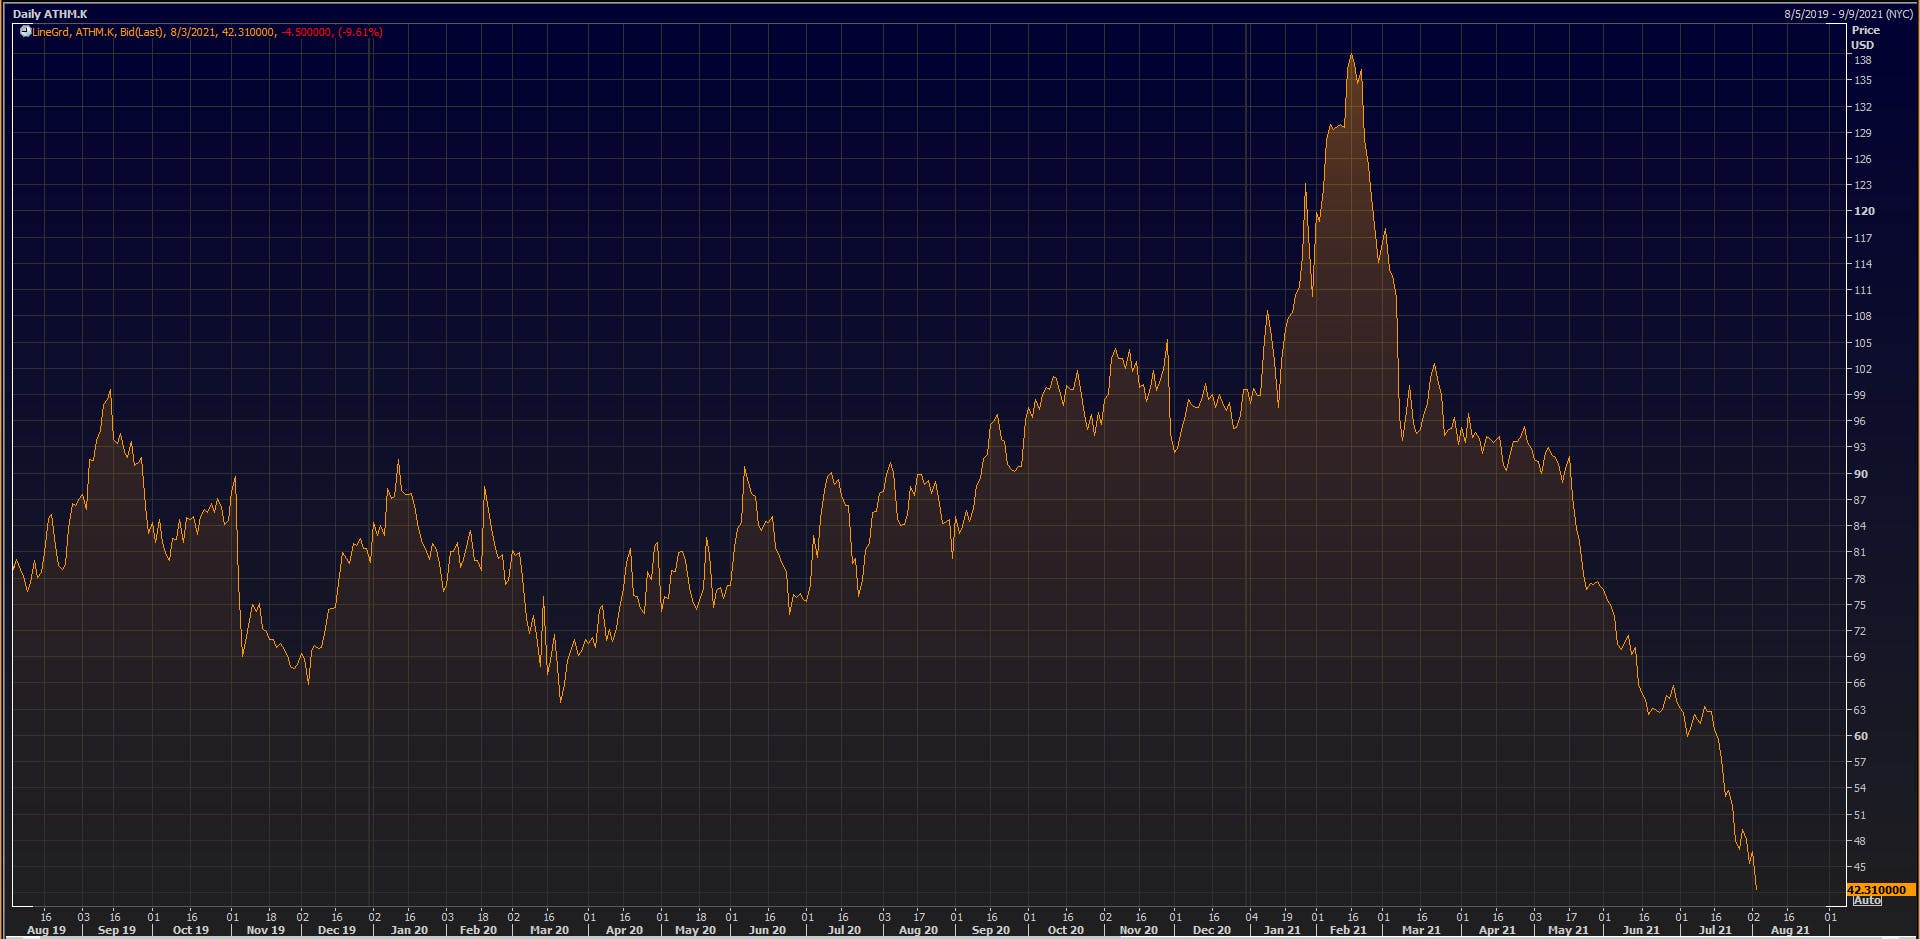
- Autohome Inc (ATHM), down 9.6% to $42.32 / YTD price return: -57.5% / 12-Month Price Range: $ 43.04-147.67 (the stock is currently on the short sale restriction list)
- Clorox Co (CLX), down 9.5% to $164.06 / YTD price return: -18.7% / 12-Month Price Range: $ 170.50-239.87 / Short interest (% of float): 6.0%; days to cover: 5.8 (the stock is currently on the short sale restriction list)
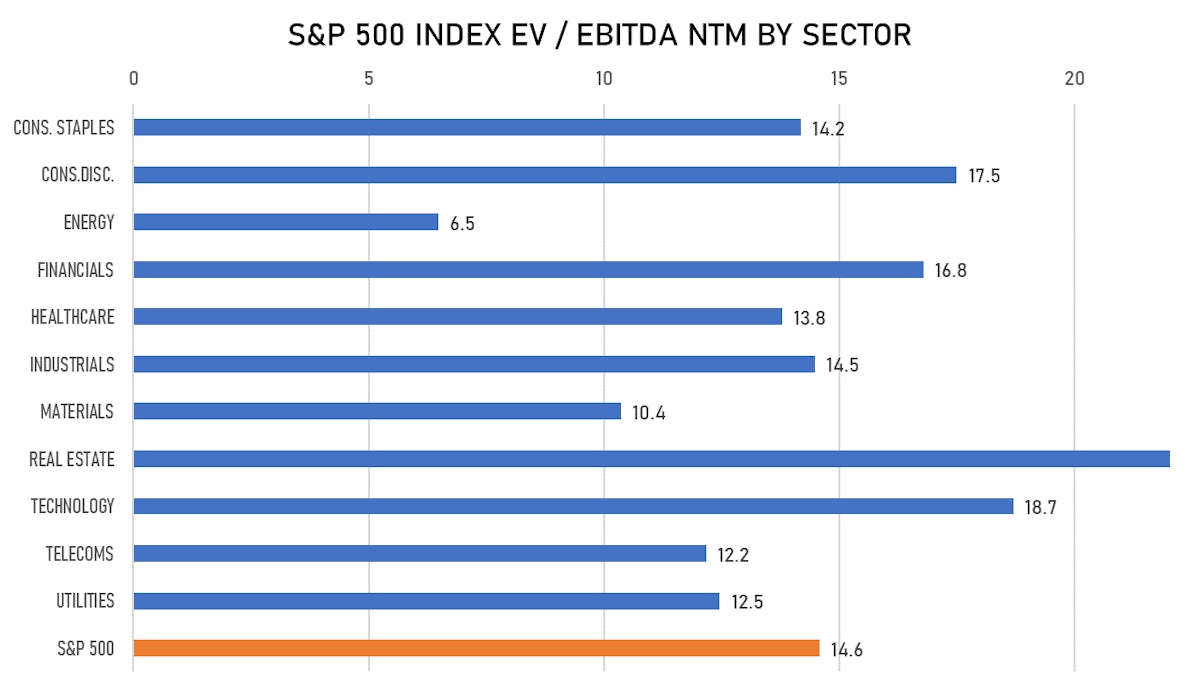
VALUATION MULTIPLES BY SECTORS
NEW IPOs ANNOUNCED OR PRICED
- Healthwell Acquisition Corp I / United States of America - Financials / Listing Exchange: Nasdaq / Ticker: HWELU / Gross proceeds (including overallotment): US$ 250.00m (offering in U.S. Dollar) / Bookrunners: Jefferies LLC
- Emerging Markets Horizon Corp / Cyprus - Financials / Listing Exchange: Nasdaq / Ticker: HORI.U / Gross proceeds (including overallotment): US$ 250.00m (offering in U.S. Dollar) / Bookrunners: Citigroup Global Markets Inc, VTB Capital
EQUITY FOLLOW-ONS / SECONDARY OFFERINGS
- Camden Property Trust / United States of America - Real Estate / Listing Exchange: New York / Ticker: CPT / Gross proceeds (including overallotment): US$ 500.00m (offering in U.S. Dollar) / Bookrunners: Not Applicable
- Driven Brands Holdings Inc / United States of America - Industrials / Listing Exchange: Nasdaq / Ticker: DRVN / Gross proceeds (including overallotment): US$ 381.84m (offering in U.S. Dollar) / Bookrunners: Goldman Sachs & Co, Morgan Stanley & Co LLC, JP Morgan Securities LLC, Bofa Securities Inc
- Juewei Food Co Ltd / China - Consumer Staples / Listing Exchange: Shanghai / Ticker: 603517 / Gross proceeds (including overallotment): US$ 368.92m (offering in Chinese Yuan) / Bookrunners: Not Applicable
