Equities
The S&P 500 Index Has Its Best Day Since March, With 95% Of Its Constituents Ending Up
A tale of two Goldman-led IPOs: GitLab priced at $77.00 / share and closed their trading debut at $103.89 (up 34.9%), while IHS priced a downsized offering at $21 and closed at $17.00 (down 19.0%)
Published ET

Market Caps Of S&P 100 Stocks | Sources: ϕpost, Refinitiv data
QUICK SUMMARY
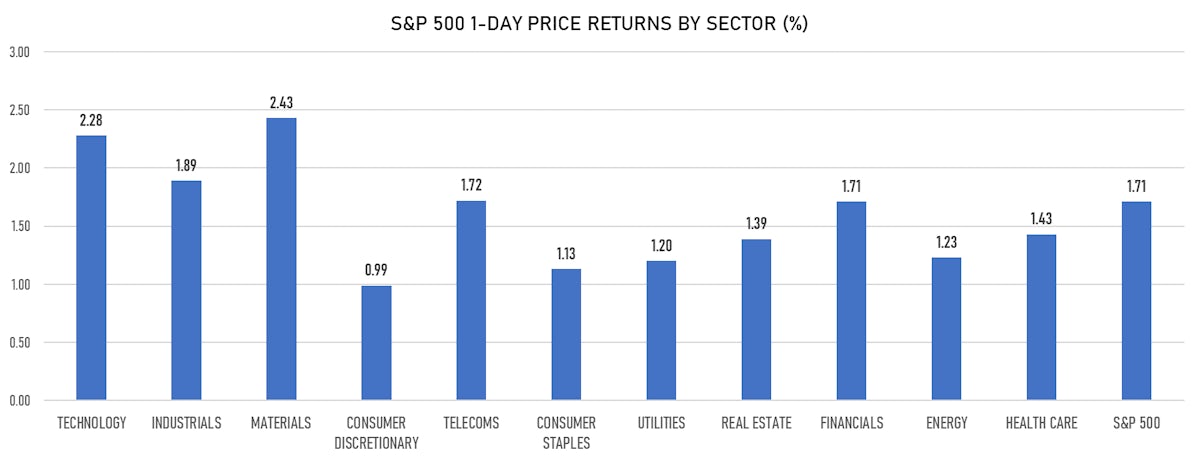
- Daily performance of US indices: S&P 500 up 1.71%; Nasdaq Composite up 1.73%; Wilshire 5000 up 1.62%
- 94.9% of S&P 500 stocks were up today, with 71.1% of stocks above their 200-day moving average (DMA) and 50.5% above their 50-DMA
- Top performing sectors in the S&P 500: materials up 2.43% and technology up 2.28%
- Bottom performing sectors in the S&P 500: consumer discretionary up 0.99% and consumer staples up 1.13%
- The number of shares in the S&P 500 traded today was 524m for a total turnover of US$ 63 bn
- The S&P 500 Value Index was up 1.5%, while the S&P 500 Growth Index was up 1.8%; the S&P small caps index was up 1.2% and mid caps were up 1.7%
- The volume on CME's INX (S&P 500 Index) was 1.9m (3-month z-score: -0.1); the 3-month average volume is 2.0m and the 12-month range is 0.8 - 5.1m
- Daily performance of international indices: Europe Stoxx 600 up 1.20%; UK FTSE 100 up 0.92%; tonight in Asia, China's CSI 300 up 0.18%; tonight in Asia, Japan's TOPIX 500 up 1.26%
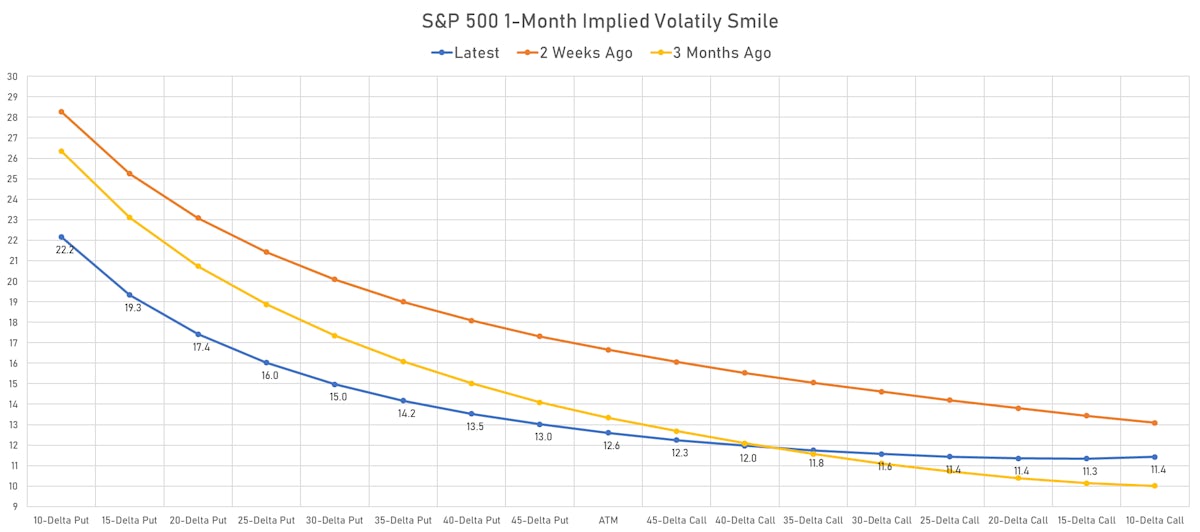
VOLATILITY
- 1-month at-the-money implied volatility on the S&P 500 at 12.6%, down from 14.7%
- 1-month at-the-money implied volatility on the Europe Stoxx 600 at 12.3%, down from 13.6%
NOTABLE S&P 500 EARNINGS RELEASES
- Wells Fargo & Co (WFC | Financials): beat on EPS (1.17 act. vs. 0.99 est.) and beat on revenue (18,834m act. vs. 18,349m est.), down -1.61% today
- Bank of America Corp (BAC | Financials): beat on EPS (0.85 act. vs. 0.71 est.) and beat on revenue (22,766m act. vs. 21,778m est.), up 4.47% today
- Citigroup Inc (C | Financials): beat on EPS (2.15 act. vs. 1.65 est.) and beat on revenue (17,834m act. vs. 16,973m est.), up 0.77% today
- Domino's Pizza Inc (DPZ | Consumer Cyclicals): beat on EPS (3.24 act. vs. 3.11 est.) and missed on revenue (998m act. vs. 1,038m est.), up 0.25% today
- Morgan Stanley (MS | Financials): beat on EPS (2.04 act. vs. 1.68 est.) and beat on revenue (14,753m act. vs. 14,006m est.), up 2.48% today
- Progressive Corp (PGR | Financials): missed on EPS (0.13 act. vs. 0.21 est.) and beat on revenue (12,447m act. vs. 12,322m est.), down -0.89% today
- Charles Schwab Corp (SCHW | Financials): missed on EPS (0.70 act. vs. 0.71 est.) and beat on revenue (4,527m act. vs. 4,462m est.), up 2.41% today
- UnitedHealth Group Inc (UNH | Healthcare): beat on EPS (4.52 act. vs. 4.41 est.) and beat on revenue (72,337m act. vs. 71,185m est.), up 4.17% today
- US Bancorp (USB | Financials): beat on EPS (1.30 act. vs. 1.16 est.) and beat on revenue (5,890m act. vs. 5,765m est.), down -2.25% today
- Walgreens Boots Alliance Inc (WBA | Consumer Non-Cyclicals): beat on EPS (1.17 act. vs. 1.02 est.) and beat on revenue (34,262m act. vs. 33,301m est.), up 7.43% today
TOP WINNERS
- Gitlab Inc (GTLB), up 34.9% to $103.89 on their IPO debut
- Ginkgo Bioworks Holdings Inc (DNA), up 13.5% to $11.63 / 12-Month Price Range: $ 8.90-14.25 / Short interest (% of float): 0.9%; days to cover: 1.6
- Relay Therapeutics Inc (RLAY), up 11.8% to $36.62 / YTD price return: -11.9% / 12-Month Price Range: $ 25.72-64.37 / Short interest (% of float): 12.3%; days to cover: 15.9
- SpringWorks Therapeutics Inc (SWTX), up 10.2% to $61.94 / YTD price return: -14.6% / 12-Month Price Range: $ 51.57-96.48
- Upstart Holdings Inc (UPST), up 10.1% to $379.68 / YTD price return: +831.7% / 12-Month Price Range: $ 22.61-346.54
- Brilliant Earth Group Inc (BRLT), up 9.9% to $12.95 / 12-Month Price Range: $ 10.63-18.23 / Short interest (% of float): 7.1%; days to cover: 0.3
- Century Therapeutics Inc (IPSC), up 9.8% to $19.53 / 12-Month Price Range: $ 16.29-32.90 / Short interest (% of float): 3.0%; days to cover: 7.5
- Ambarella Inc (AMBA), up 9.8% to $167.54 / YTD price return: +82.5% / 12-Month Price Range: $ 53.52-169.28
- Cipher Mining Inc (CIFR), up 9.8% to $6.07 / 12-Month Price Range: $ 5.13-15.39 / Short interest (% of float): 2.6%; days to cover: 1.8
- Nexa Resources SA (NEXA), up 9.7% to $10.39 / YTD price return: +7.8% / 12-Month Price Range: $ 5.16-12.58 / Short interest (% of float): 0.1%; days to cover: 0.4
BIGGEST LOSERS
- UP Fintech Holding Ltd (TIGR), down 21.2% to $8.18 / YTD price return: +3.0% / 12-Month Price Range: $ 4.30-38.50 (the stock is currently on the short sale restriction list)
- IHS Holding Ltd (IHS), down 19.0% to $17.00 on their trading debut
- Futu Holdings Ltd (FUTU), down 12.4% to $73.81 / YTD price return: +61.3% / 12-Month Price Range: $ 29.30-204.25 (the stock is currently on the short sale restriction list)
- AMN Healthcare Services Inc (AMN), down 12.2% to $101.73 / YTD price return: +49.1% / 12-Month Price Range: $ 58.48-123.73 (the stock is currently on the short sale restriction list)
- Exscientia PLC (EXAI), down 11.3% to $20.20 / 12-Month Price Range: $ 20.05-30.38 (the stock is currently on the short sale restriction list)
- ESS Tech Inc (GWH), down 11.2% to $16.94 / YTD price return: +68.1% / 12-Month Price Range: $ 7.22-28.92 / Short interest (% of float): 0.2%; days to cover: 3.6
- Science 37 Holdings Inc (SNCE), down 9.8% to $11.10 / 12-Month Price Range: $ 8.42-15.10 / Short interest (% of float): 0.1%; days to cover: 2.5 (the stock is currently on the short sale restriction list)
- Codexis Inc (CDXS), down 8.9% to $27.48 / 12-Month Price Range: $ 12.79-32.42 (the stock is currently on the short sale restriction list)
- Lufax Holding Ltd (LU), down 8.9% to $6.74 / 12-Month Price Range: $ 6.86-20.17 (the stock is currently on the short sale restriction list)
- Youdao Inc (DAO), down 8.7% to $12.24 / YTD price return: -53.9% / 12-Month Price Range: $ 7.02-42.17 / Short interest (% of float): 2.6%; days to cover: 1.6
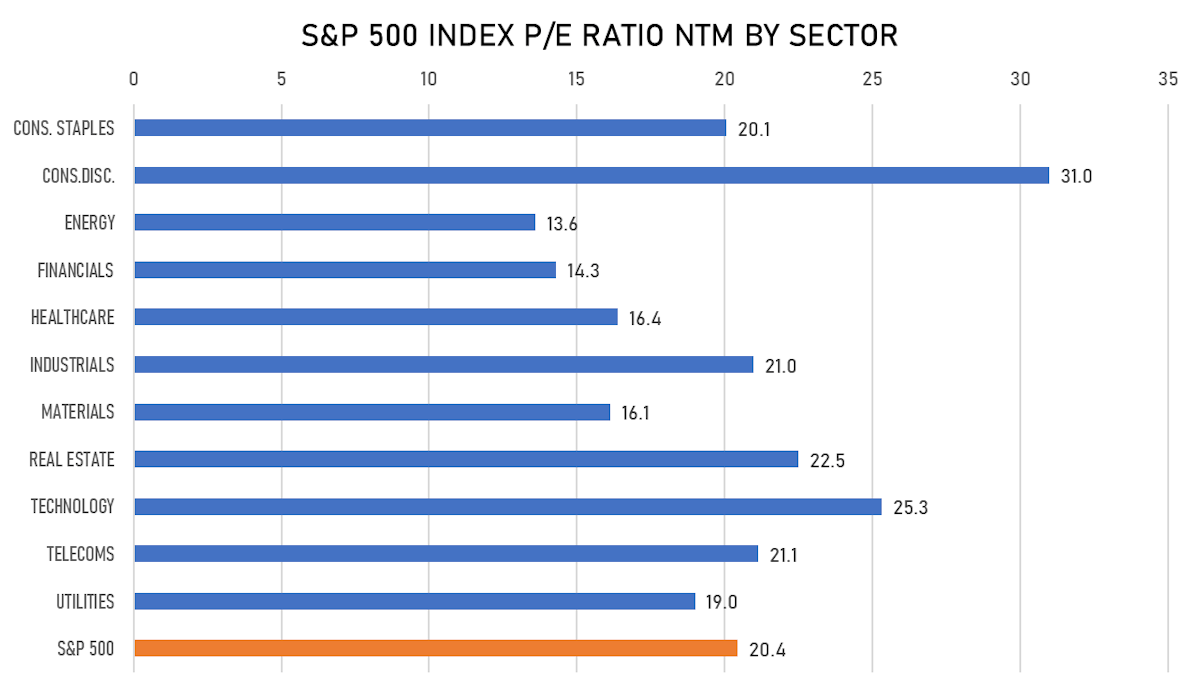
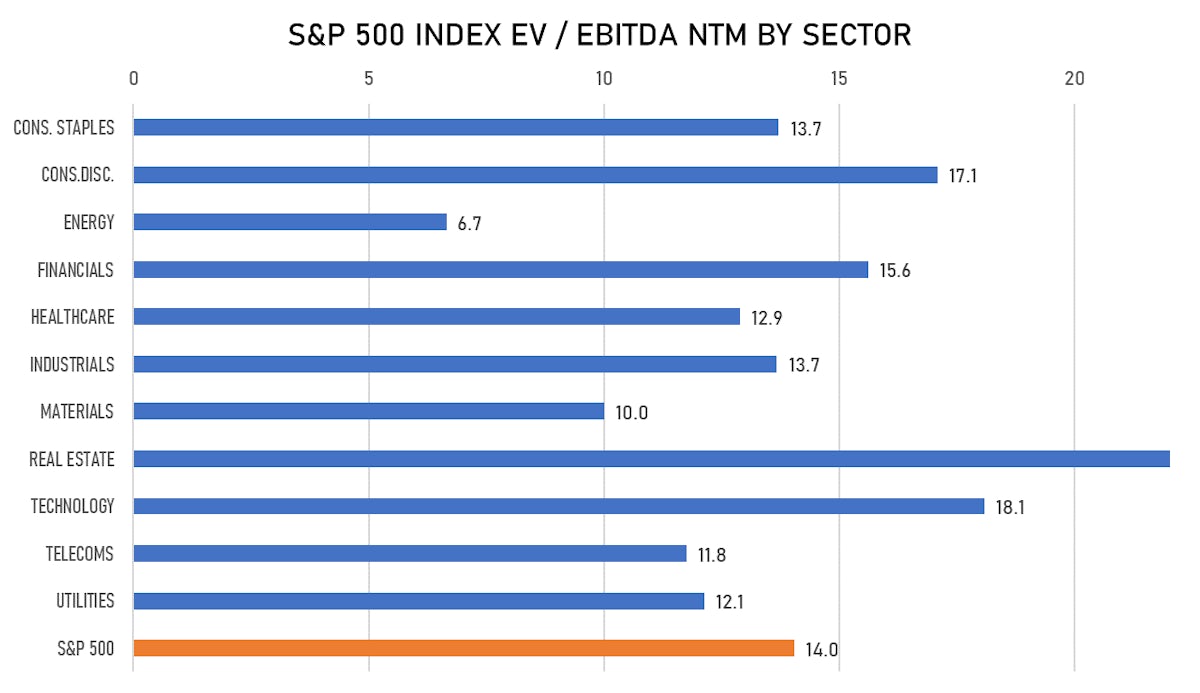
VALUATION MULTIPLES BY SECTORS