Equities
Decent Gains For US Equity Indices On Moderate Volumes And Low Volatility
Technology and consumer discretionary led sector performance today, as less than half of S&P 500 stocks rose and growth overperformed value by a wide margin
Published ET
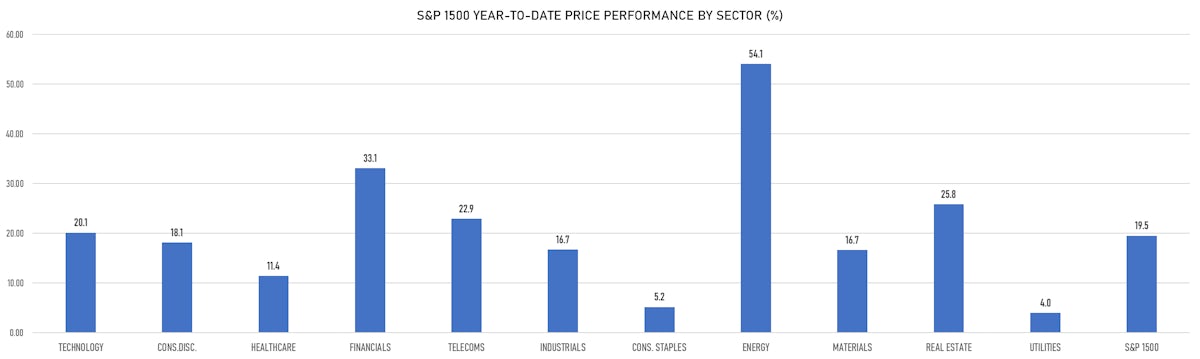
S&P 1500 Year-To-Date Price Returns By Sector | Sources: ϕpost chart, Refinitiv data
QUICK SUMMARY
- Daily performance of US indices: S&P 500 up 0.34%; Nasdaq Composite up 0.84%; Wilshire 5000 up 0.41%
- 46.7% of S&P 500 stocks were up today, with 69.9% of stocks above their 200-day moving average (DMA) and 52.1% above their 50-DMA
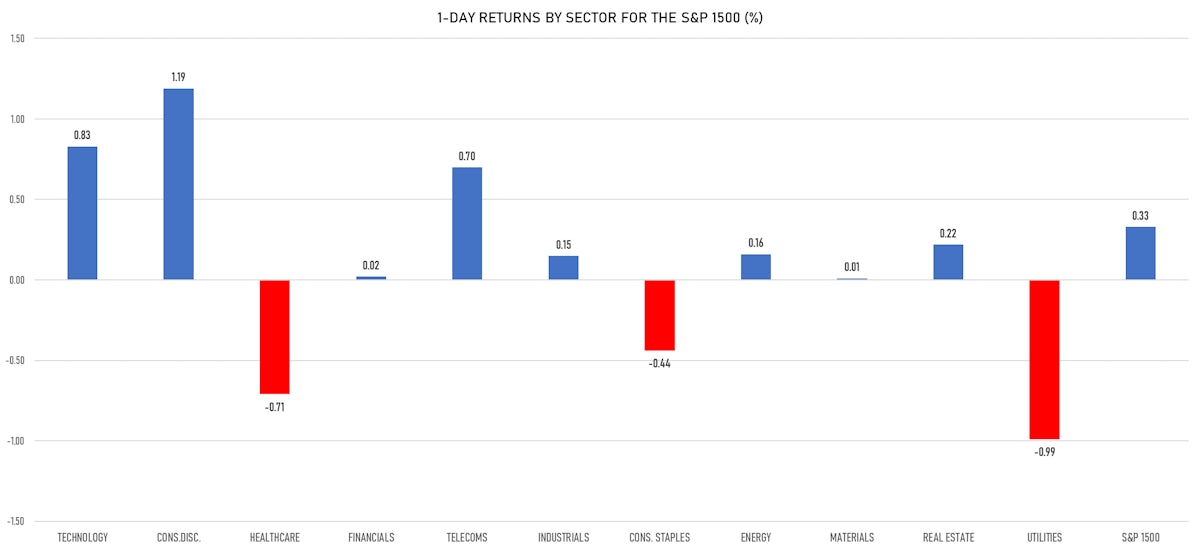
- Top performing sectors in the S&P 500: consumer discretionary up 1.20% and technology up 0.85%
- Bottom performing sectors in the S&P 500: utilities down -0.97% and health care down -0.72%
- The number of shares in the S&P 500 traded today was 511m for a total turnover of US$ 64 bn
- The S&P 500 Value Index was down -0.3%, while the S&P 500 Growth Index was up 0.9%; the S&P small caps index was up 0.3% and mid caps were up 0.3%
- The volume on CME's INX (S&P 500 Index) was 1.9m (3-month z-score: -0.3); the 3-month average volume is 2.0m and the 12-month range is 0.8 - 5.1m
- Daily performance of international indices: Europe Stoxx 600 down -0.50%; UK FTSE 100 down -0.42%; tonight in Asia, China's CSI 300 up 0.69%, Japan's TOPIX 500 up 0.22%
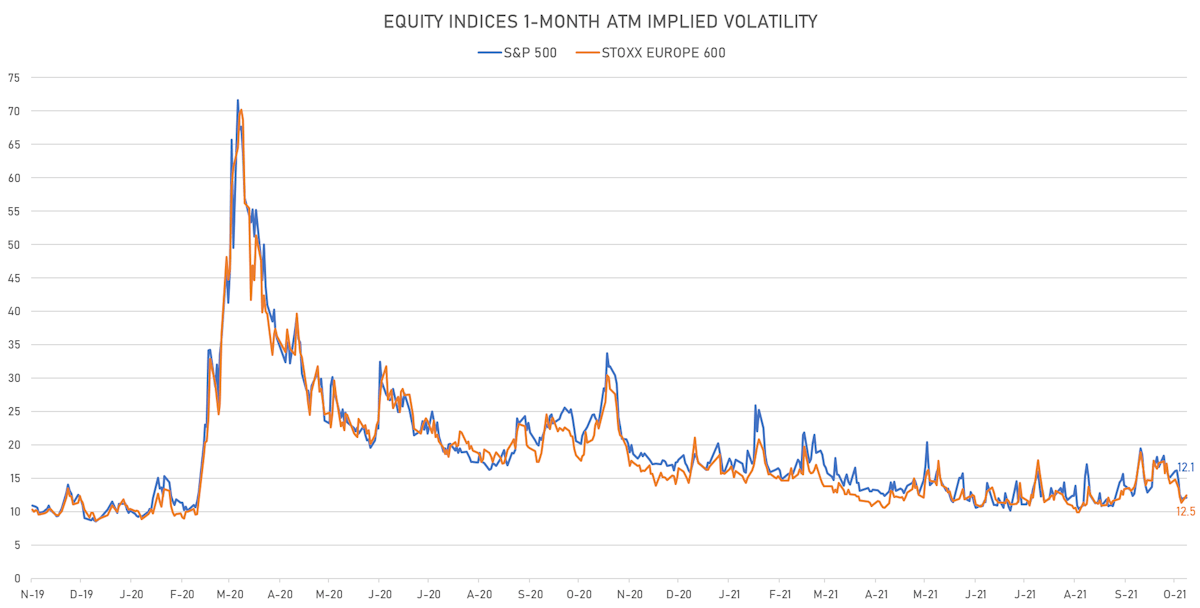
VOLATILITY
- 1-month at-the-money implied volatility on the S&P 500 at 12.1%, up from 12.0%
- 1-month at-the-money implied volatility on the Europe Stoxx 600 at 12.5%, up from 11.4%
NOTABLE S&P 500 EARNINGS RELEASES
- State Street Corp (STT | Financials): beat on EPS (2.00 act. vs. 1.92 est.) and beat on revenue (2,990m act. vs. 2,959m est.), up 2.22% today
- NVR Inc (NVR | Consumer Cyclicals): beat on EPS (82.45 act. vs. 72.53 est.) and beat on revenue (2,225m act. vs. 2,190m est.), up 0.89% today
- Zions Bancorporation NA (ZION | Financials): beat on EPS (1.45 act. vs. 1.35 est.) and beat on revenue (711m act. vs. 707m est.), up 0.14% today
TOP WINNERS
- Valneva SE (VALN), up 39.8% to $39.21 / 12-Month Price Range: $ 24.16-59.15
- Peabody Energy Corp (BTU), up 23.2% to $19.66 / YTD price return: +715.8% / 12-Month Price Range: $ .80-19.83 / Short interest (% of float): 6.5%; days to cover: 1.3
- Fuelcell Energy Inc (FCEL), up 18.3% to $8.74 / YTD price return: -21.8% / 12-Month Price Range: $ 1.98-29.44 / Short interest (% of float): 15.9%; days to cover: 2.1
- Macy's Inc (M), up 17.5% to $28.25 / YTD price return: +151.1% / 12-Month Price Range: $ 6.01-25.47
- Oi SA em Recuperacao Judicial (OIBRc), up 15.2% to $.97 / 12-Month Price Range: $ .77-2.41 / Short interest (% of float): 0.1%; days to cover: 4.1
- Amplitude Inc (AMPL), up 13.4% to $63.52 / 12-Month Price Range: $ 48.86-56.13 / Short interest (% of float): 1.1%; days to cover: 0.1
- Cipher Mining Inc (CIFR), up 13.0% to $7.90 / 12-Month Price Range: $ 5.13-15.39 / Short interest (% of float): 2.6%; days to cover: 1.8
- Nexa Resources SA (NEXA), up 12.9% to $12.29 / YTD price return: +27.5% / 12-Month Price Range: $ 5.16-12.58 / Short interest (% of float): 0.1%; days to cover: 0.4
- Denison Mines Corp (DNN), up 12.7% to $1.86 / YTD price return: +187.5% / 12-Month Price Range: $ .30-1.81 / Short interest (% of float): 2.3%; days to cover: 0.9
- Taskus Inc (TASK), up 12.6% to $72.92 / 12-Month Price Range: $ 26.66-85.49 / Short interest (% of float): 7.7%
BIGGEST LOSERS
- MannKind Corp (MNKD), down 18.3% to $4.16 / YTD price return: +32.9% / 12-Month Price Range: $ 1.94-6.25 / Short interest (% of float): 11.3%; days to cover: 10.2 (the stock is currently on the short sale restriction list)
- Latch Inc (LTCH), down 14.7% to $9.31 / YTD price return: -8.0% / 12-Month Price Range: $ 9.46-19.70 / Short interest (% of float): 8.8%; days to cover: 7.8 (the stock is currently on the short sale restriction list)
- Ionis Pharmaceuticals Inc (IONS), down 13.8% to $30.25 / YTD price return: -46.5% / 12-Month Price Range: $ 32.15-64.37 (the stock is currently on the short sale restriction list)
- Science 37 Holdings Inc (SNCE), down 10.2% to $10.57 / 12-Month Price Range: $ 8.42-15.10 / Short interest (% of float): 0.1%; days to cover: 2.5 (the stock is currently on the short sale restriction list)
- Standard Lithium Ltd (SLI), down 10.1% to $9.92 / 12-Month Price Range: $ 1.33-11.31 / Short interest (% of float): 1.5%; days to cover: 1.0 (the stock is currently on the short sale restriction list)
- Zillow Group Inc (Z), down 9.4% to $86.00 / YTD price return: -33.7% / 12-Month Price Range: $ 83.93-208.11 / Short interest (% of float): 12.7%; days to cover: 6.2 (the stock is currently on the short sale restriction list)
- Zillow Group Inc (ZG), down 9.4% to $85.46 / YTD price return: -37.1% / 12-Month Price Range: $ 84.92-212.40 (the stock is currently on the short sale restriction list)
- MaxCyte Inc (MXCT), down 9.3% to $10.00 / 12-Month Price Range: $ 5.85-17.44 / Short interest (% of float): 1.9%; days to cover: 2.3 (the stock is currently on the short sale restriction list)
- Morphic Holding Inc (MORF), down 9.0% to $53.44 / 12-Month Price Range: $ 24.94-93.00 / Short interest (% of float): 4.3%; days to cover: 6.1
- Xenon Pharmaceuticals Inc (XENE), down 8.7% to $30.72 / YTD price return: +99.7% / 12-Month Price Range: $ 9.32-34.87 / Short interest (% of float): 1.9%; days to cover: 3.7 (the stock is currently on the short sale restriction list)
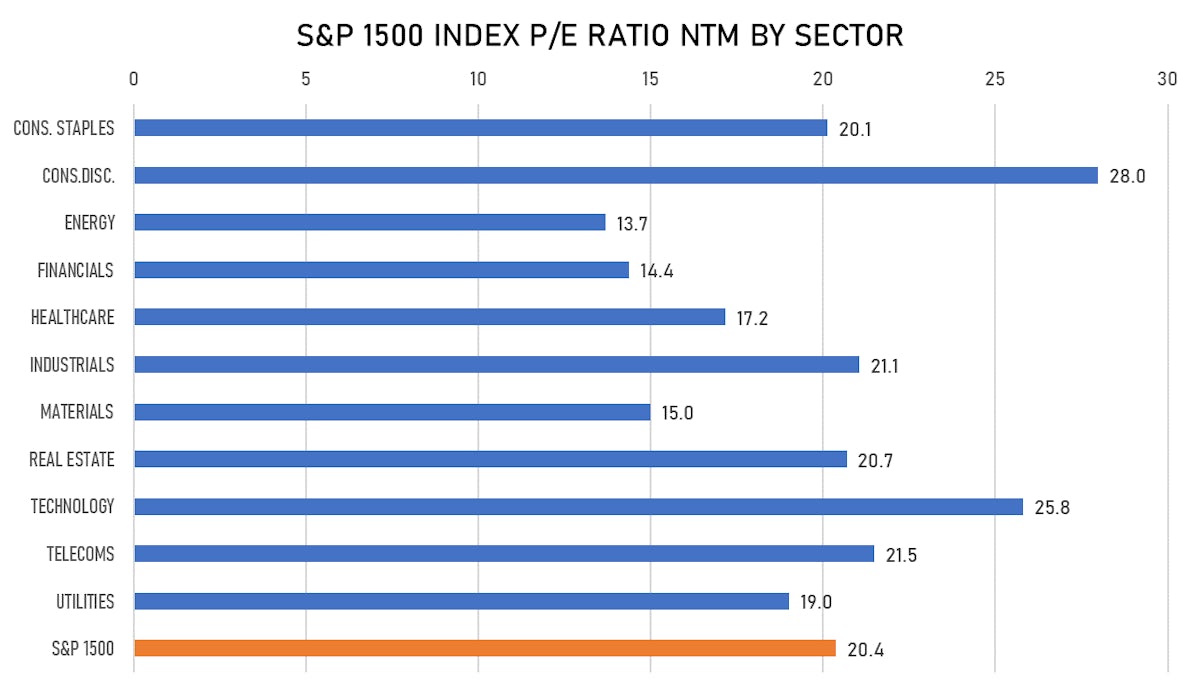
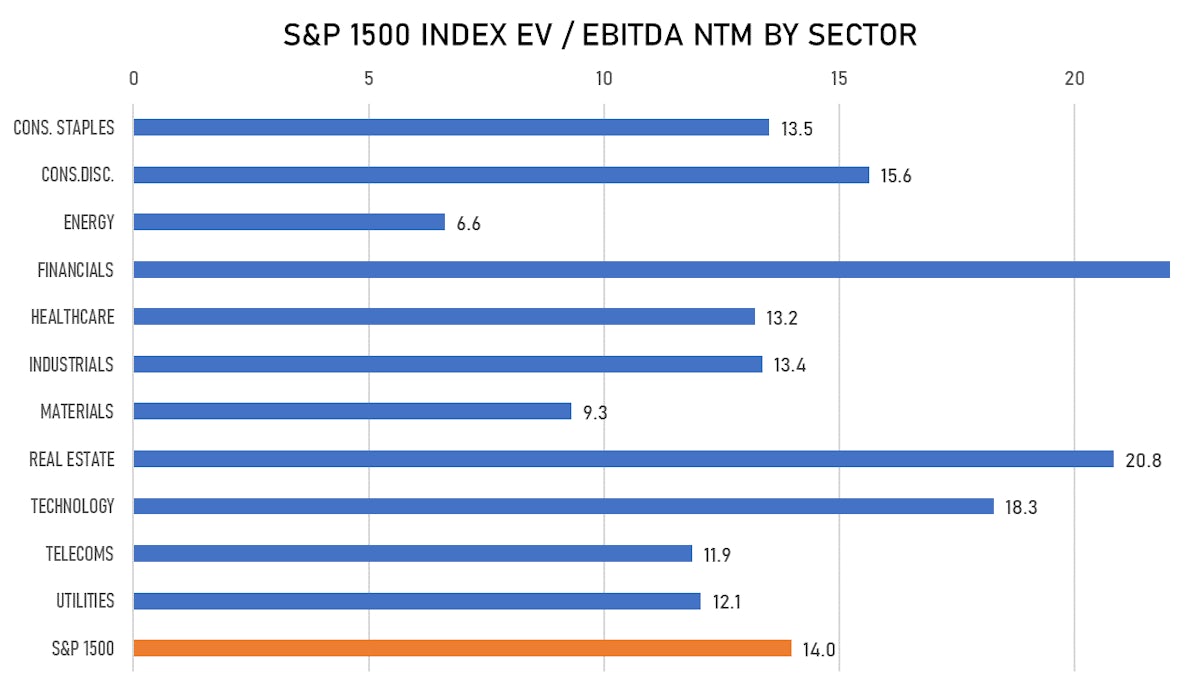
VALUATION MULTIPLES BY SECTORS