Equities
Equities Drop At The Open, Pull Off Nice Intraday Comeback In The Afternoon To Close Basically Unchanged
The recent drop in technology stocks and rise in volatility has been terrible for ECM activity (IPOs, secondaries), with very little happening since the beginning of the year
Published ET
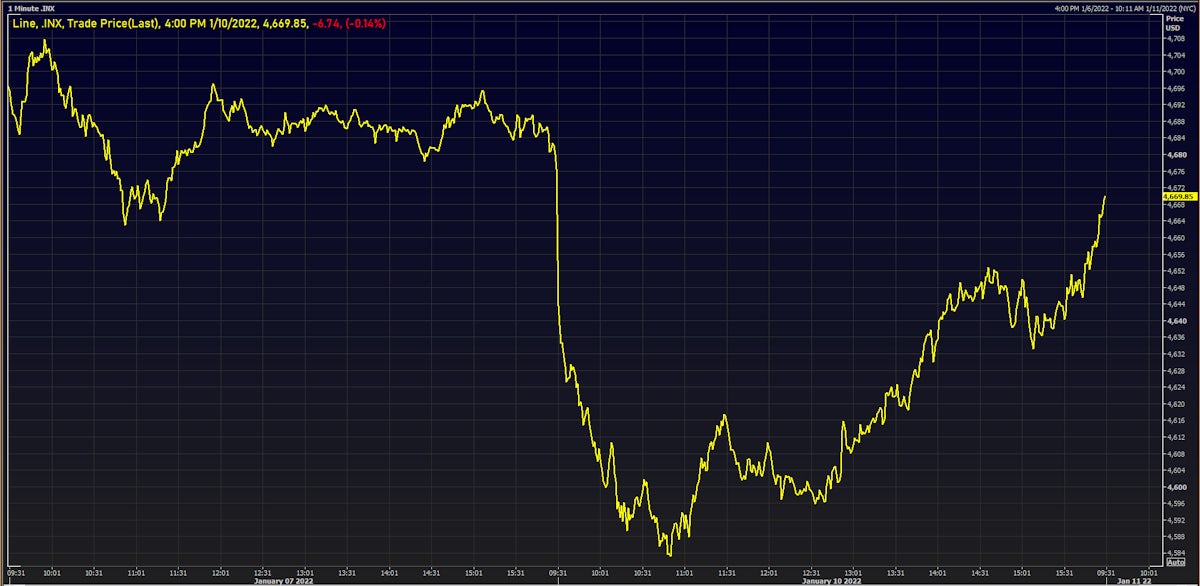
Nasdaq Composite Prices Intraday | Source: Refinitiv
QUICK SUMMARY
- Daily performance of US indices: S&P 500 down -0.14%; Nasdaq Composite up 0.05%; Wilshire 5000 down -0.16%
- 36.0% of S&P 500 stocks were up today, with 68.9% of stocks above their 200-day moving average (DMA) and 59.8% above their 50-DMA
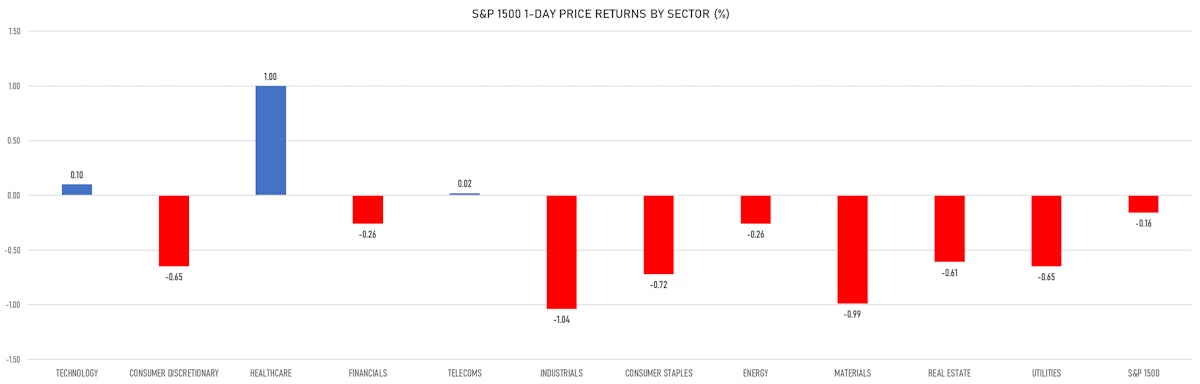
- Top performing sectors in the S&P 500: healthcare up 1.04% and technology up 0.10%
- Bottom performing sectors in the S&P 500: industrials down -1.15% and materials down -0.99%
- The number of shares in the S&P 500 traded today was 728m for a total turnover of US$ 99 bn
- The S&P 500 Value Index was down -0.4%, while the S&P 500 Growth Index was up 0.1%; the S&P small caps index was down -0.4% and mid-caps were down -0.4%
- The volume on CME's INX (S&P 500 Index) was 2.7m (3-month z-score: 0.8); the 3-month average volume is 2.2m and the 12-month range is 1.3 - 4.6m
- Daily performance of international indices: Europe Stoxx 600 down -1.48%; UK FTSE 100 down -0.53%; tonight in Asia, the Hang Seng SH-SZ-HK 300 Index up 0.01%, Japan's TOPIX 500 down -0.58%
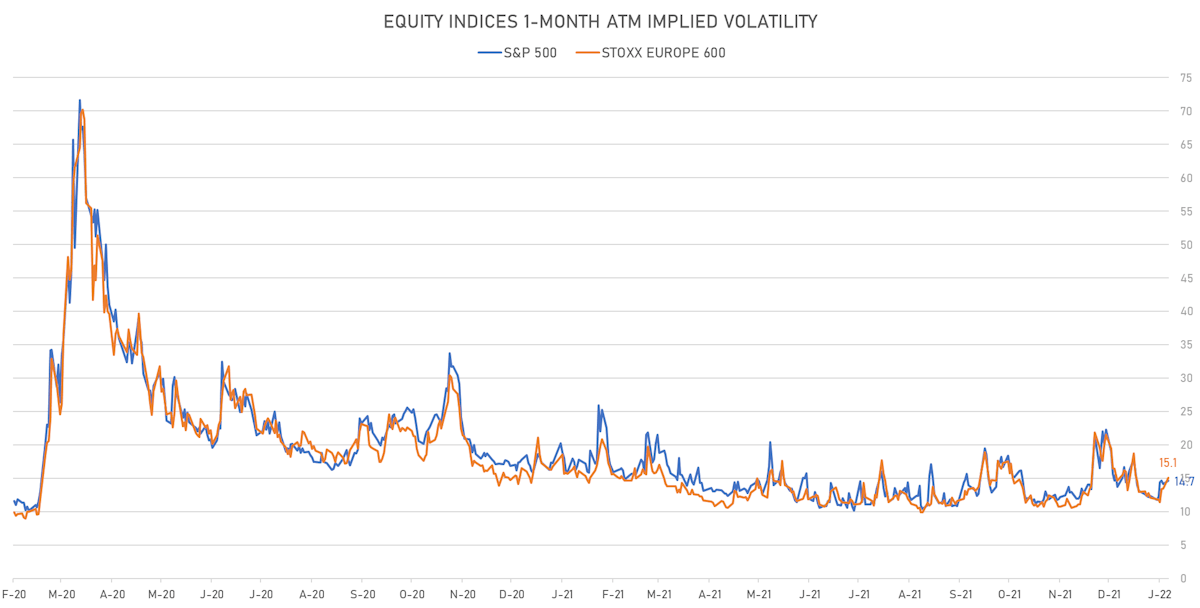
VOLATILITY
- 1-month at-the-money implied volatility on the S&P 500 at 14.7%, up from 14.2%
- 1-month at-the-money implied volatility on the Europe Stoxx 600 at 15.1%, up from 13.5%
TOP WINNERS
- Zynga Inc (ZNGA), up 40.7% to $8.44 / YTD price return: +31.9% / 12-Month Price Range: $ 5.57-12.32
- BioCryst Pharmaceuticals Inc (BCRX), up 27.9% to $14.78 / YTD price return: +6.7% / 12-Month Price Range: $ 7.45-18.48
- iRhythm Technologies Inc (IRTC), up 27.6% to $130.04 / YTD price return: +10.5% / 12-Month Price Range: $ 41.66-286.19
- Apria Inc (APR), up 26.1% to $37.48 / YTD price return: +15.0% / 12-Month Price Range: $ 20.07-40.00
- Olink Holding AB (publ) (OLK), up 23.8% to $14.46 / YTD price return: -20.5% / 12-Month Price Range: $ 10.64-42.20
- Discovery Inc (DISCB), up 21.2% to $44.50 / YTD price return: +49.6% / 12-Month Price Range: $ 27.19-150.72 / Short interest (% of float): 1.1%; days to cover: 1.2
- CareDx Inc (CDNA), up 18.5% to $46.29 / YTD price return: +1.8% / 12-Month Price Range: $ 38.43-99.83
- Treace Medical Concepts Inc (TMCI), up 14.9% to $20.25 / YTD price return: +8.6% / 12-Month Price Range: $ 15.00-37.17
- Sema4 Holdings Corp (SMFR), up 13.6% to $4.67 / YTD price return: +4.7% / 12-Month Price Range: $ 3.91-27.18
- Tilray Brands Inc (TLRY), up 13.6% to $7.29 / YTD price return: +3.7% / 12-Month Price Range: $ 6.29-67.00
BIGGEST LOSERS
- Bird Global Inc (BRDS), down 17.6% to $4.78 / YTD price return: -22.5% / 12-Month Price Range: $ 5.58-11.32 / Short interest (% of float): 1.4%; days to cover: 2.1 (the stock is currently on the short sale restriction list)
- Amicus Therapeutics Inc (FOLD), down 17.2% to $9.45 / YTD price return: -18.2% / 12-Month Price Range: $ 8.60-23.85 (the stock is currently on the short sale restriction list)
- Beauty Health Co (SKIN), down 16.7% to $18.46 / YTD price return: -23.6% / 12-Month Price Range: $ 9.71-30.17 (the stock is currently on the short sale restriction list)
- Nurix Therapeutics Inc (NRIX), down 15.9% to $23.27 / YTD price return: -19.6% / 12-Month Price Range: $ 21.53-51.46 (the stock is currently on the short sale restriction list)
- Benson Hill Inc (BHIL), down 14.5% to $5.68 / YTD price return: -22.1% / 12-Month Price Range: $ 5.50-12.25 / Short interest (% of float): 1.1%; days to cover: 2.4 (the stock is currently on the short sale restriction list)
- Take-Two Interactive Software Inc (TTWO), down 13.1% to $142.99 / YTD price return: -19.5% / 12-Month Price Range: $ 144.58-214.91 (the stock is currently on the short sale restriction list)
- Iovance Biotherapeutics Inc (IOVA), down 11.4% to $14.42 / YTD price return: -24.5% / 12-Month Price Range: $ 15.71-54.21 (the stock is currently on the short sale restriction list)
- Sarepta Therapeutics Inc (SRPT), down 10.9% to $76.15 / YTD price return: -15.4% / 12-Month Price Range: $ 65.30-103.34 (the stock is currently on the short sale restriction list)
- Arrival SA (ARVL), down 9.7% to $6.49 / YTD price return: -12.5% / 12-Month Price Range: $ 6.65-31.97 (the stock is currently on the short sale restriction list)
- Allogene Therapeutics Inc (ALLO), down 9.4% to $12.20 / YTD price return: -18.2% / 12-Month Price Range: $ 12.90-39.12 (the stock is currently on the short sale restriction list)
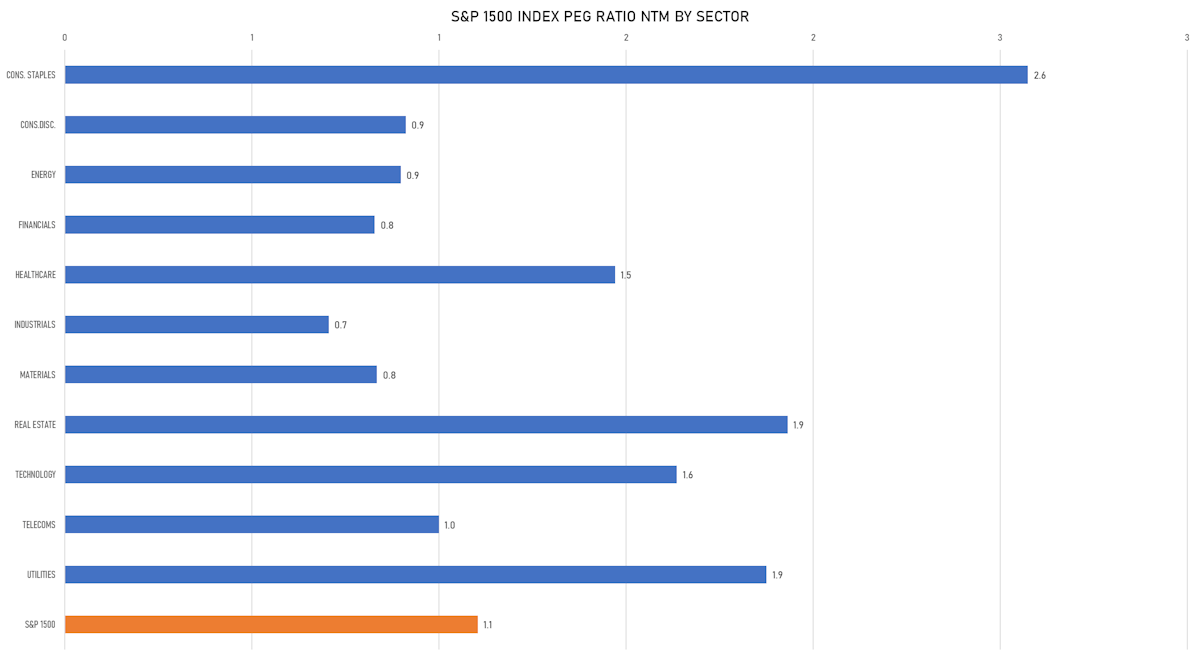
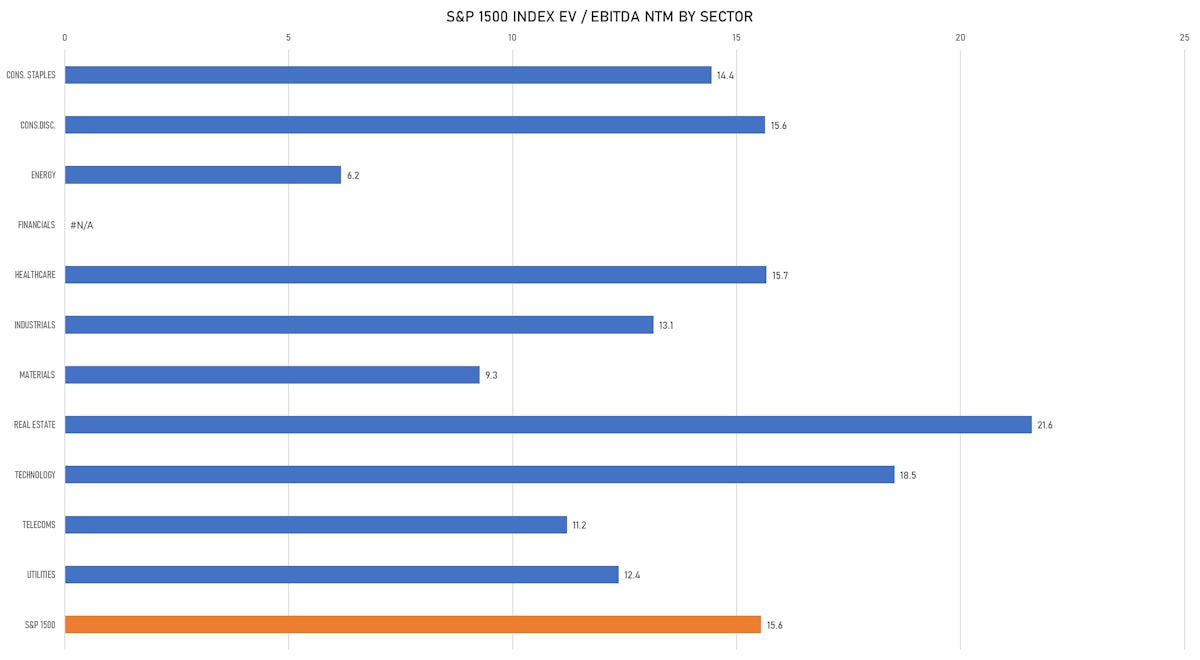
VALUATION MULTIPLES BY SECTORS
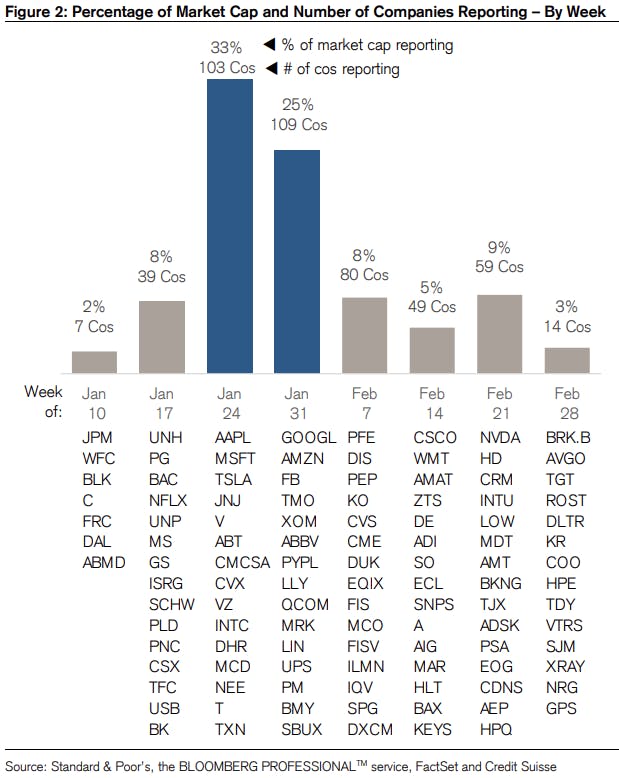
4Q 2021 EARNINGS CALENDAR
- The last week of January and the first week of February will see reporting from more than half of the S&P 500 market cap
- Some large financials reporting later this week, with JP Morgan, Wells Fargo, Blackrock and Citi on deck