Equities
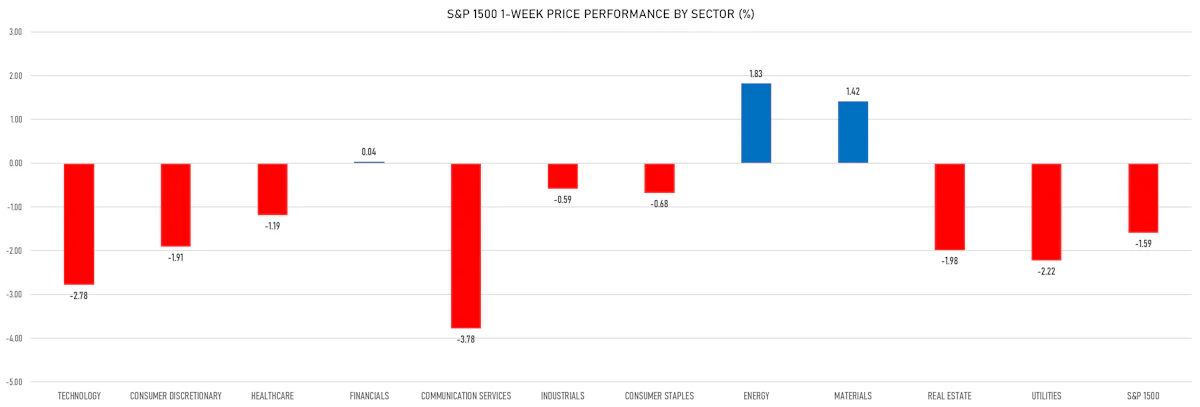
Tough Week For US Equities Ends In Red, Led Down By Technology And Communication Services
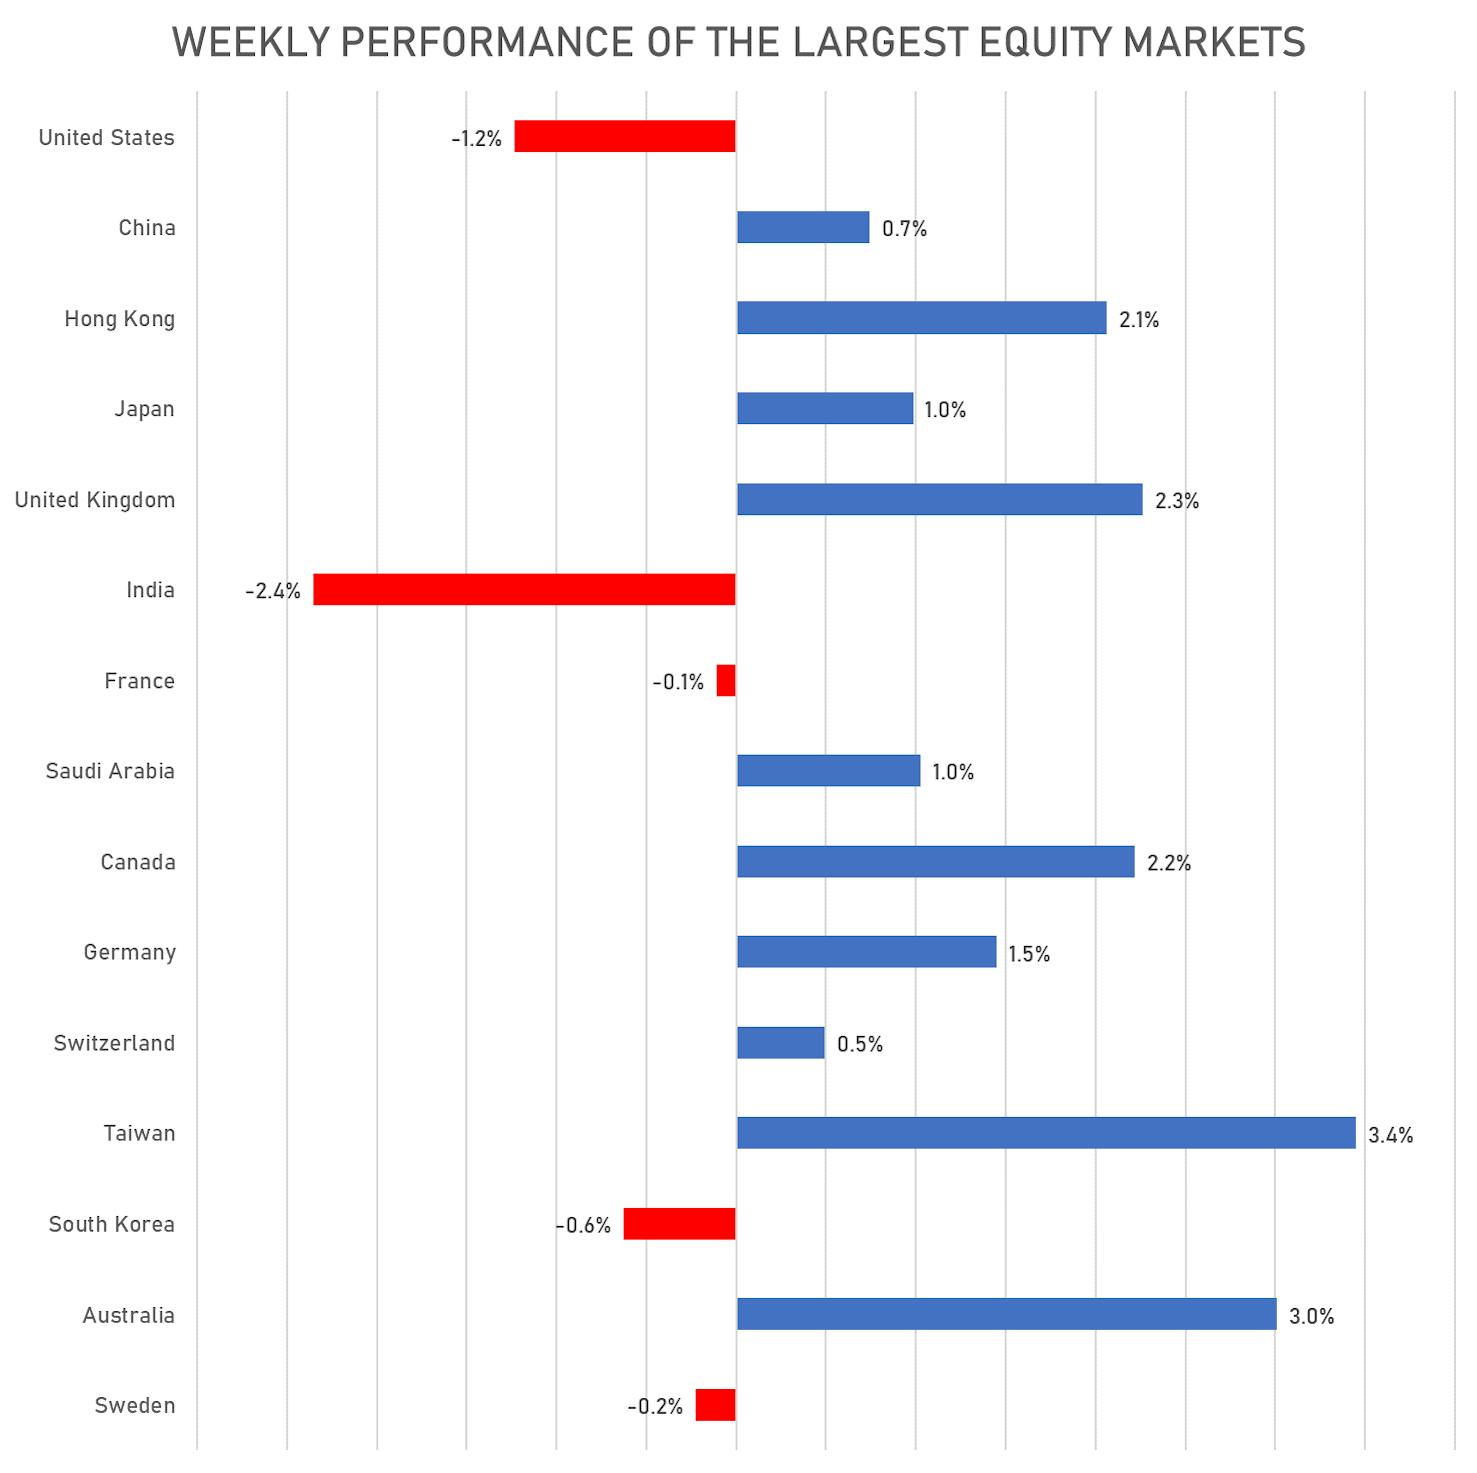
The US was an outlier, as most major markets saw positive performance this week, with Australia up 3%, the UK, Canada, and Hong Kong all up over 2%
Published ET
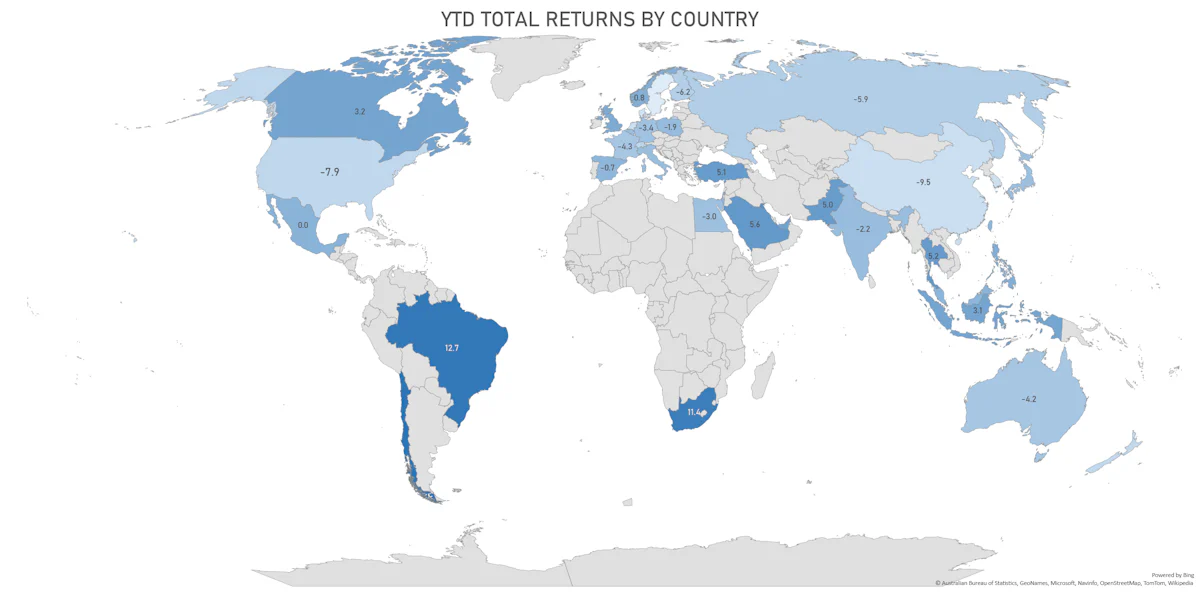
YTD Total Returns By Country | Sources: ϕpost, FactSet data
QUICK SUMMARY
- Daily performance of US indices: S&P 500 down -1.90%; Nasdaq Composite down -2.78%; Wilshire 5000 down -1.88%
- 19.6% of S&P 500 stocks were up today, with 45.3% of stocks above their 200-day moving average (DMA) and 39.8% above their 50-DMA
- Top performing sectors in the S&P 500: energy up 2.79% and utilities up 0.01%
- Bottom performing sectors in the S&P 500: technology down -3.01% and consumer discretionary down -2.82%
- The number of shares in the S&P 500 traded today was 760m for a total turnover of US$ 94 bn
- The S&P 500 Value Index was down -1.0%, while the S&P 500 Growth Index was down -2.8%; the S&P small caps index was down -0.2% and mid-caps were down -1.3%
- The volume on CME's INX (S&P 500 Index) was 2.9m (3-month z-score: 0.7); the 3-month average volume is 2.5m and the 12-month range is 1.3 - 4.6m
- Daily performance of international indices: Europe Stoxx 600 down -0.59%; UK FTSE 100 down -0.15%; Hang Seng SH-SZ-HK 300 Index down -0.74%; Japan's TOPIX 500 up 0.52%
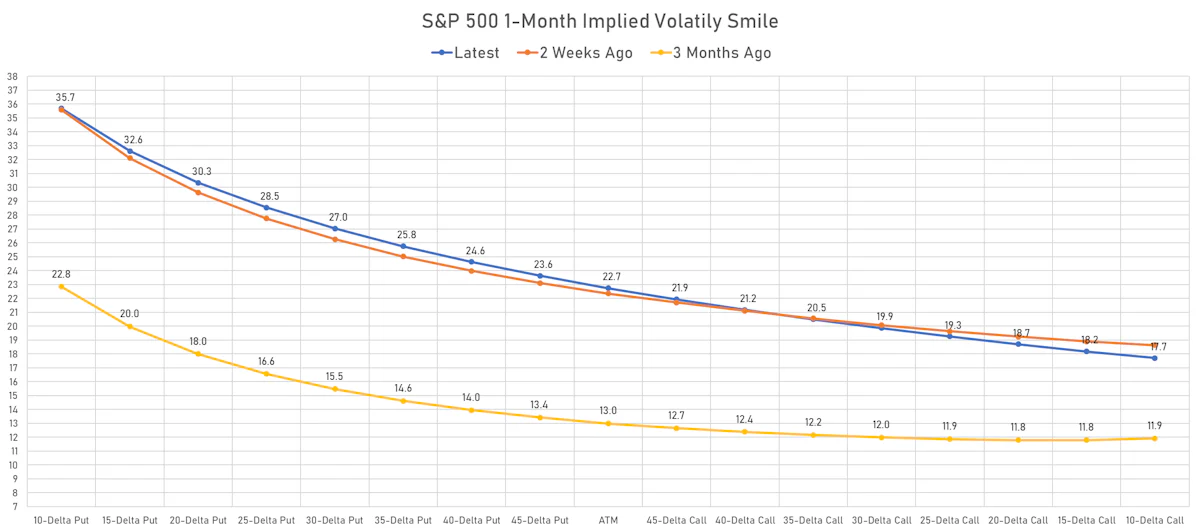
VOLATILITY
- 1-month at-the-money implied volatility on the S&P 500 at 22.7%, up from 20.1%
- 1-month at-the-money implied volatility on the Europe Stoxx 600 at 17.1%, up from 15.3%
NOTABLE US EARNINGS RELEASES
- Dominion Energy Inc (D | Utilities): missed EPS median estimate (0.90 act. vs. 0.91 est.) and missed revenue median estimate (3,880m act. vs. 4,020m est.), up 1.06% today, closed at $ 79.08 / share and traded at $ 78.76 (-0.40%) after hours
- Apollo Global Management Inc (APO | Financials): missed EPS median estimate (1.05 act. vs. 1.08 est.) and beat revenue median estimate (597m act. vs. 568m est.), down -5.74% today, closed at $ 65.67 / share and traded at $ 66.07 (+0.61%) after hours
- Ares Management Corp (ARES | Financials): beat EPS median estimate (0.85 act. vs. 0.72 est.) and missed revenue median estimate (667m act. vs. 675m est.), down -0.70% today, closed at $ 79.90 / share and traded at $ 79.90 (unchanged) after hours
- WP Carey Inc (WPC | Real Estate): missed EPS median estimate (0.57 act. vs. 0.60 est.) and beat revenue median estimate (375m act. vs. 330m est.), up 2.21% today, closed at $ 76.01 / share and traded at $ 76.00 (-0.01%) after hours
- Bruker Corp (BRKR | Healthcare): beat EPS median estimate (0.59 act. vs. 0.58 est.) and beat revenue median estimate (684m act. vs. 665m est.), down -4.45% today, closed at $ 68.55 / share and traded at $ 68.55 (unchanged) after hours
- Newell Brands Inc (NWL | Consumer Cyclicals): beat EPS median estimate (0.42 act. vs. 0.32 est.) and beat revenue median estimate (2,805m act. vs. 2,651m est.), up 11.07% today, closed at $ 24.39 / share and traded at $ 24.38 (-0.04%) after hours
- Cleveland-Cliffs Inc (CLF | Basic Materials): missed EPS median estimate (1.69 act. vs. 2.08 est.) and missed revenue median estimate (5,346m act. vs. 5,689m est.), down -9.69% today, closed at $ 18.92 / share and traded at $ 19.17 (+1.32%) after hours
- Neurocrine Biosciences Inc (NBIX | Healthcare): missed EPS median estimate (-0.08 act. vs. 0.66 est.) and missed revenue median estimate (312m act. vs. 313m est.), up 7.45% today, closed at $ 85.53 / share and traded at $ 85.25 (-0.33%) after hours
- Under Armour Inc (UAA | Consumer Cyclicals): beat EPS median estimate (0.14 act. vs. 0.06 est.) and beat revenue median estimate (1,529m act. vs. 1,466m est.), down -12.49% today, closed at $ 17.51 / share and traded at $ 17.48 (-0.17%) after hours
TOP WINNERS
- Mr Cooper Group Inc (COOP), up 19.2% to $49.22 / YTD price return: +18.3% / 12-Month Price Range: $ 28.64-45.27 / Short interest (% of float): 3.4%; days to cover: 3.0
- Sundial Growers Inc (SNDL), up 18.5% to $.66 / YTD price return: +14.6% / 12-Month Price Range: $ .40-3.96 / Short interest (% of float): 12.1%; days to cover: 3.1
- Carpenter Technology Corp (CRS), up 16.7% to $38.73 / YTD price return: +32.7% / 12-Month Price Range: $ 26.84-49.20 / Short interest (% of float): 3.4%; days to cover: 3.5
- Vimeo Inc (VMEO), up 15.2% to $12.95 / YTD price return: -27.9% / 12-Month Price Range: $ 9.20-58.00 / Short interest (% of float): 2.3%; days to cover: 1.6
- IONQ Inc (IONQ), up 14.0% to $16.82 / YTD price return: +.7% / 12-Month Price Range: $ 7.07-35.90
- Peabody Energy Corp (BTU), up 13.9% to $17.02 / YTD price return: +69.0% / 12-Month Price Range: $ 2.61-19.83 / Short interest (% of float): 6.5%; days to cover: 1.7
- Zillow Group Inc (Z), up 13.5% to $55.40 / YTD price return: -13.2% / 12-Month Price Range: $ 44.80-208.11
- LSB Industries Inc (LXU), up 13.2% to $12.67 / YTD price return: +14.7% / 12-Month Price Range: $ 2.75-11.88 / Short interest (% of float): 0.5%; days to cover: 1.7
- Kosmos Energy Ltd (KOS), up 12.8% to $4.86 / YTD price return: +40.5% / 12-Month Price Range: $ 1.80-5.09 / Short interest (% of float): 5.5%; days to cover: 2.4
- Zillow Group Inc (ZG), up 12.7% to $53.92 / YTD price return: -13.3% / 12-Month Price Range: $ 44.08-212.40 / Short interest (% of float): 5.7%; days to cover: 4.0
BIGGEST LOSERS
- Senseonics Holdings Inc (SENS), down 33.7% to $2.42 / YTD price return: -9.4% / 12-Month Price Range: $ 1.62-5.56 / Short interest (% of float): 19.6%; days to cover: 8.1 (the stock is currently on the short sale restriction list)
- Goodyear Tire & Rubber Co (GT), down 27.4% to $15.78 / YTD price return: -26.0% / 12-Month Price Range: $ 13.45-24.89 / Short interest (% of float): 3.6%; days to cover: 2.7 (the stock is currently on the short sale restriction list)
- Tritium Dcfc Ltd (DCFC), down 23.2% to $10.24 / YTD price return: +2.7% / 12-Month Price Range: $ 6.42-19.75 / Short interest (% of float): 0.7%; days to cover: 1.2 (the stock is currently on the short sale restriction list)
- IAA Inc (IAA), down 22.2% to $35.67 / YTD price return: -29.5% / 12-Month Price Range: $ 41.37-64.55 / Short interest (% of float): 2.1%; days to cover: 3.4 (the stock is currently on the short sale restriction list)
- Confluent Inc (CFLT), down 21.9% to $57.18 / YTD price return: -25.0% / 12-Month Price Range: $ 37.71-94.97 / Short interest (% of float): 15.6%; days to cover: 4.0 (the stock is currently on the short sale restriction list)
- EQRx Inc (EQRX), down 21.6% to $3.26 / YTD price return: -52.2% / 12-Month Price Range: $ 3.83-11.10 / Short interest (% of float): 1.6%; days to cover: 7.9 (the stock is currently on the short sale restriction list)
- Affirm Holdings Inc (AFRM), down 20.7% to $46.55 / YTD price return: -53.7% / 12-Month Price Range: $ 46.50-176.65 / Short interest (% of float): 6.6%; days to cover: 1.1 (the stock is currently on the short sale restriction list)
- Freshworks Inc (FRSH), down 18.0% to $18.41 / YTD price return: -29.9% / 12-Month Price Range: $ 18.52-53.36 / Short interest (% of float): 20.1%; days to cover: 4.8 (the stock is currently on the short sale restriction list)
- Blackline Inc (BL), down 15.8% to $76.73 / YTD price return: -25.9% / 12-Month Price Range: $ 81.54-152.44 / Short interest (% of float): 9.0%; days to cover: 9.8 (the stock is currently on the short sale restriction list)
- Chemours Co (CC), down 15.4% to $30.00 / YTD price return: -10.6% / 12-Month Price Range: $ 23.30-38.87 / Short interest (% of float): 4.8%; days to cover: 6.4 (the stock is currently on the short sale restriction list)
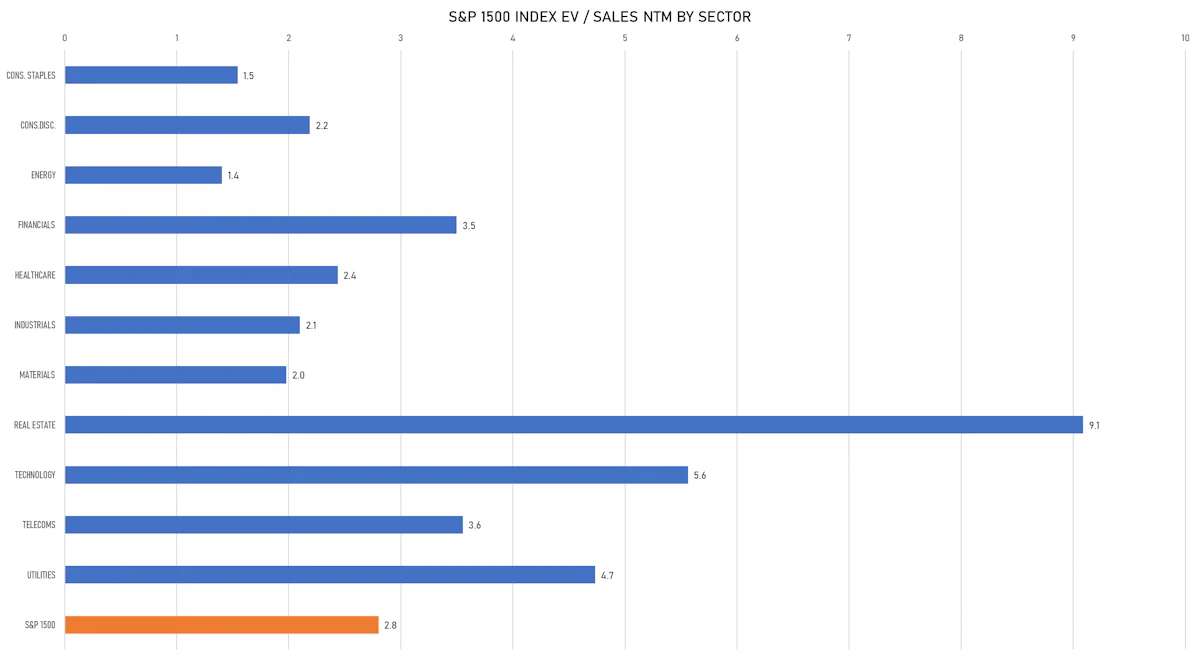
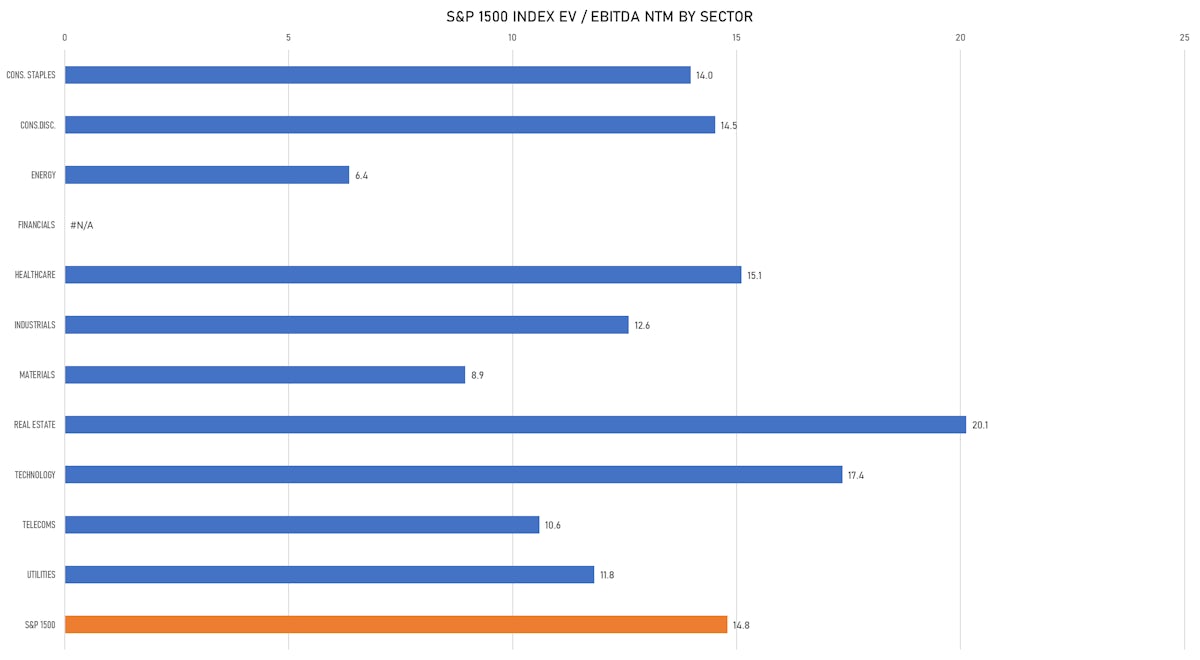
VALUATION MULTIPLES BY SECTORS
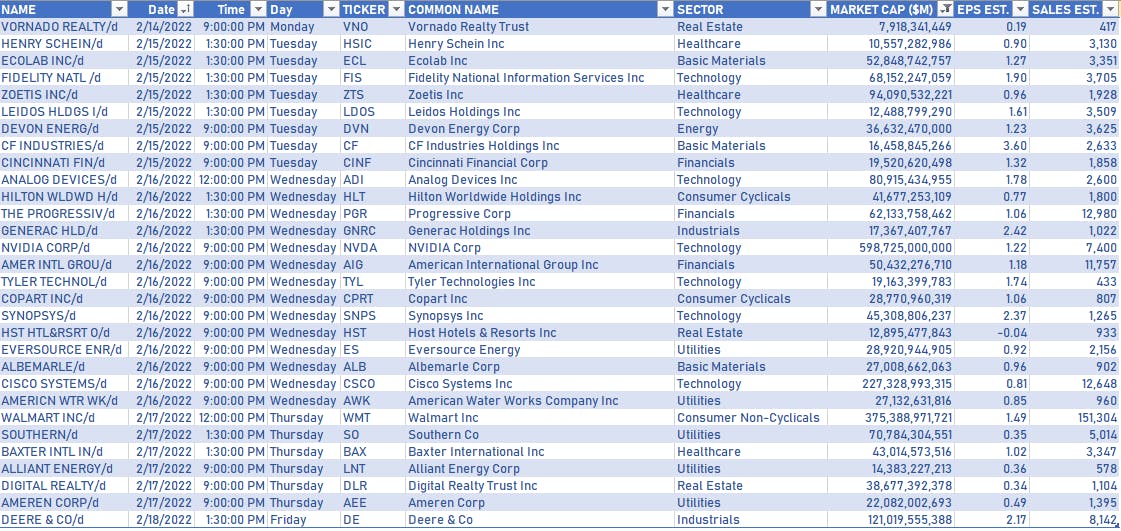
US COMPANIES REPORTING EARNINGS NEXT WEEK
PERFORMANCE OF TOP GLOBAL MARKETS THIS WEEK