Equities
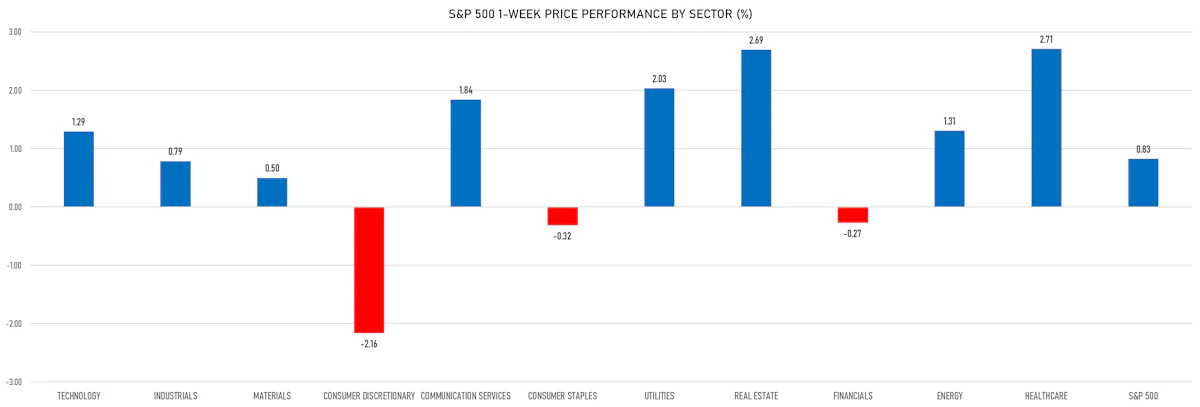
The S&P 500 Was Up 0.8% This Week, Led By Healthcare, Utilities, Real Estate Sectors
Volatility shot up mid-week but dropped back into the weekend, as S&P 500 growth stocks rose 4.8% and value stocks 2.8% over the last couple of days
Published ET
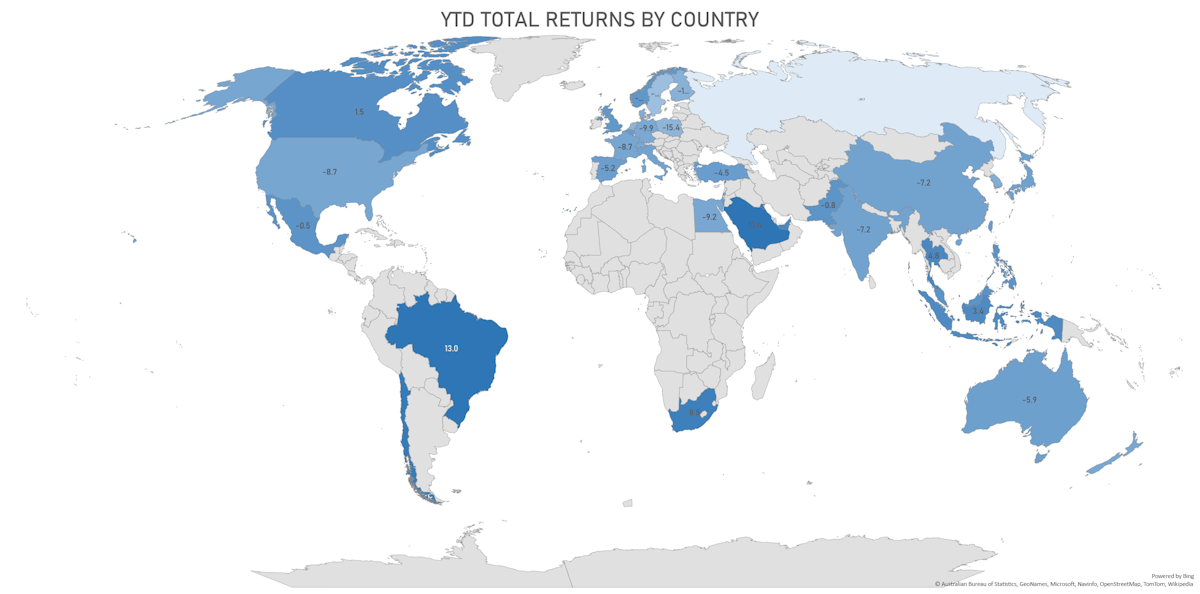
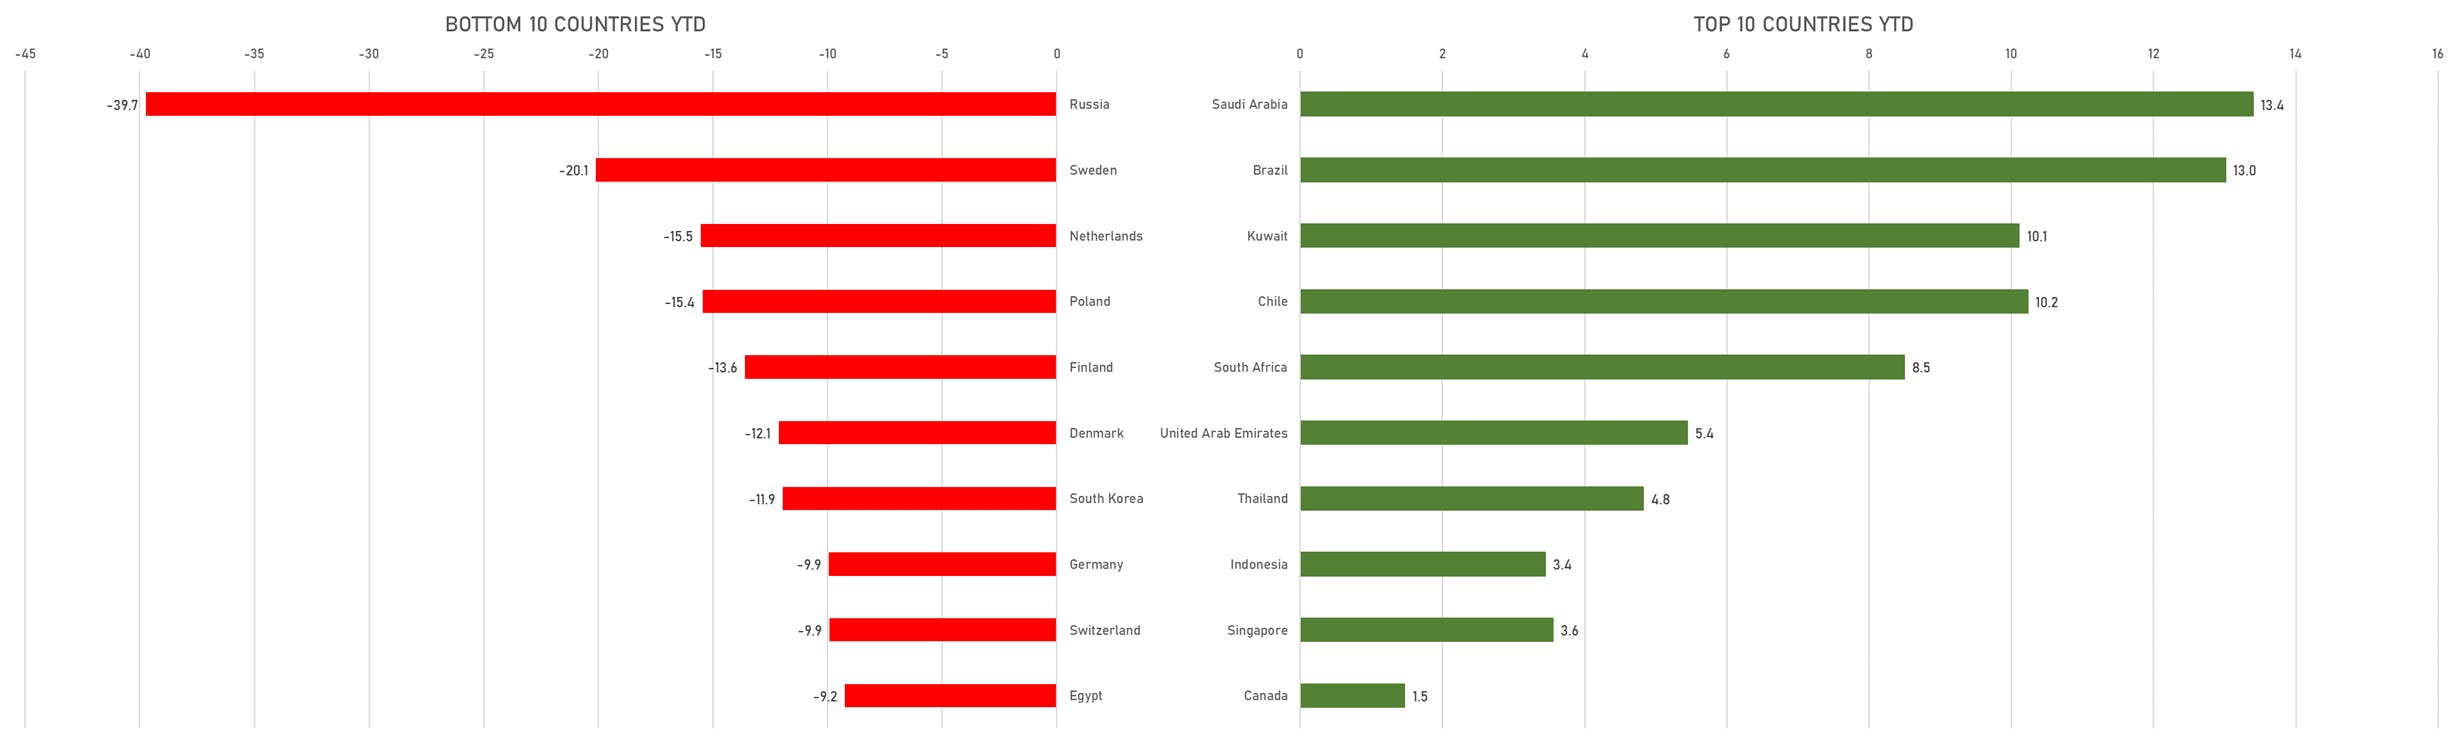
YTD Total Returns by Country | Sources: ϕpost, FactSet data
QUICK SUMMARY
- Daily performance of US indices: S&P 500 up 2.24%; Nasdaq Composite up 1.64%; Wilshire 5000 up 2.22%
- 97.0% of S&P 500 stocks were up today, with 45.9% of stocks above their 200-day moving average (DMA) and 40.2% above their 50-DMA
- Top performing sectors in the S&P 500: materials up 3.58% and financials up 3.16%
- Bottom performing sectors in the S&P 500: technology up 1.37% and communication services up 1.48%
- The number of shares in the S&P 500 traded today was 714m for a total turnover of US$ 83 bn
- The S&P 500 Value Index was up 2.8%, while the S&P 500 Growth Index was up 1.7%; the S&P small caps index was up 2.2% and mid caps were up 2.8%
- The volume on CME's INX (S&P 500 Index) was 2.7m (3-month z-score: 0.3); the 3-month average volume is 2.5m and the 12-month range is 1.3 - 4.6m
- Daily performance of international indices: Europe Stoxx 600 up 3.32%; UK FTSE 100 up 3.91%; Hang Seng SH-SZ-HK 300 Index up 0.48%; Japan's TOPIX 500 up 1.02%
VOLATILITY
- 1-month at-the-money implied volatility on the S&P 500 at 22.1%, down from 24.6%
- 1-month at-the-money implied volatility on the Europe Stoxx 600 at 21.8%, down from 25.9%
TOP WINNERS
- Inspirato Inc (ISPO), up 50.5% to $54.90 / YTD price return: +443.6% / 12-Month Price Range: $ 9.00-108.00 / Short interest (% of float): 1.2%; days to cover: 3.2
- CarGurus Inc (CARG), up 44.0% to $46.44 / YTD price return: +38.0% / 12-Month Price Range: $ 22.63-39.77
- Farfetch Ltd (FTCH), up 39.4% to $20.92 / YTD price return: -37.4% / 12-Month Price Range: $ 12.36-69.21 / Short interest (% of float): 5.9%; days to cover: 2.6 (the stock is currently on the short sale restriction list)
- KAR Auction Services Inc (KAR), up 38.3% to $18.94 / YTD price return: +21.3% / 12-Month Price Range: $ 11.76-19.56 / Short interest (% of float): 10.6%; days to cover: 9.7
- Block Inc (SQ), up 26.1% to $119.82 / YTD price return: -25.8% / 12-Month Price Range: $ 82.72-289.23 / Short interest (% of float): 10.0%; days to cover: 3.9
- Strategic Education Inc (STRA), up 21.4% to $60.74 / YTD price return: +5.0% / 12-Month Price Range: $ 48.01-94.84 / Short interest (% of float): 5.5%; days to cover: 6.2
- Carvana Co (CVNA), up 21.0% to $152.57 / YTD price return: -34.2% / 12-Month Price Range: $ 107.50-376.83 / Short interest (% of float): 15.4%; days to cover: 3.8
- Paramount Group Inc (PGRE), up 20.8% to $11.22 / 12-Month Price Range: $ 7.79-11.65 / Short interest (% of float): 2.4%; days to cover: 2.4
- US Silica Holdings Inc (SLCA), up 19.4% to $14.09 / YTD price return: +49.9% / 12-Month Price Range: $ 7.23-15.38 / Short interest (% of float): 4.3%; days to cover: #N/A
- Schrodinger Inc (SDGR), up 19.1% to $32.64 / YTD price return: -6.3% / 12-Month Price Range: $ 23.14-115.26 / Short interest (% of float): 9.6%; days to cover: 6.3
BIGGEST LOSERS
- Everbridge Inc (EVBG), down 33.9% to $30.61 / YTD price return: -54.5% / 12-Month Price Range: $ 40.37-168.87 / Short interest (% of float): 7.7%; days to cover: 2.8 (the stock is currently on the short sale restriction list)
- Foot Locker Inc (FL), down 29.8% to $29.07 / YTD price return: -33.4% / 12-Month Price Range: $ 38.29-66.71 / Short interest (% of float): 5.5%; days to cover: 2.6 (the stock is currently on the short sale restriction list)
- LivePerson Inc (LPSN), down 25.6% to $18.10 / YTD price return: -49.3% / 12-Month Price Range: $ 21.62-68.97 / Short interest (% of float): 12.4%; days to cover: 8.6 (the stock is currently on the short sale restriction list)
- Vicor Corp (VICR), down 25.2% to $74.98 / YTD price return: -41.0% / 12-Month Price Range: $ 74.08-164.76 (the stock is currently on the short sale restriction list)
- Opendoor Technologies Inc (OPEN), down 23.1% to $8.44 / YTD price return: -42.2% / 12-Month Price Range: $ 8.14-32.25 (the stock is currently on the short sale restriction list)
- Stem Inc (STEM), down 21.6% to $8.81 / 12-Month Price Range: $ 9.11-37.79 / Short interest (% of float): 9.8%; days to cover: 3.7 (the stock is currently on the short sale restriction list)
- TAL Education Group (TAL), down 20.3% to $2.91 / YTD price return: -26.0% / 12-Month Price Range: $ 2.26-82.69 / Short interest (% of float): 7.4%; days to cover: 2.6 (the stock is currently on the short sale restriction list)
- Zscaler Inc (ZS), down 15.8% to $221.85 / YTD price return: -31.0% / 12-Month Price Range: $ 157.03-376.11 / Short interest (% of float): 7.3%; days to cover: 2.3 (the stock is currently on the short sale restriction list)
- MasTec Inc (MTZ), down 13.1% to $79.05 / YTD price return: -14.3% / 12-Month Price Range: $ 82.08-122.33 / Short interest (% of float): 4.6%; days to cover: 4.8 (the stock is currently on the short sale restriction list)
- Dingdong (Cayman) Ltd (DDL), down 10.0% to $4.52 / 12-Month Price Range: $ 3.90-46.00 / Short interest (% of float): 0.6%; days to cover: 2.4 (the stock is currently on the short sale restriction list)
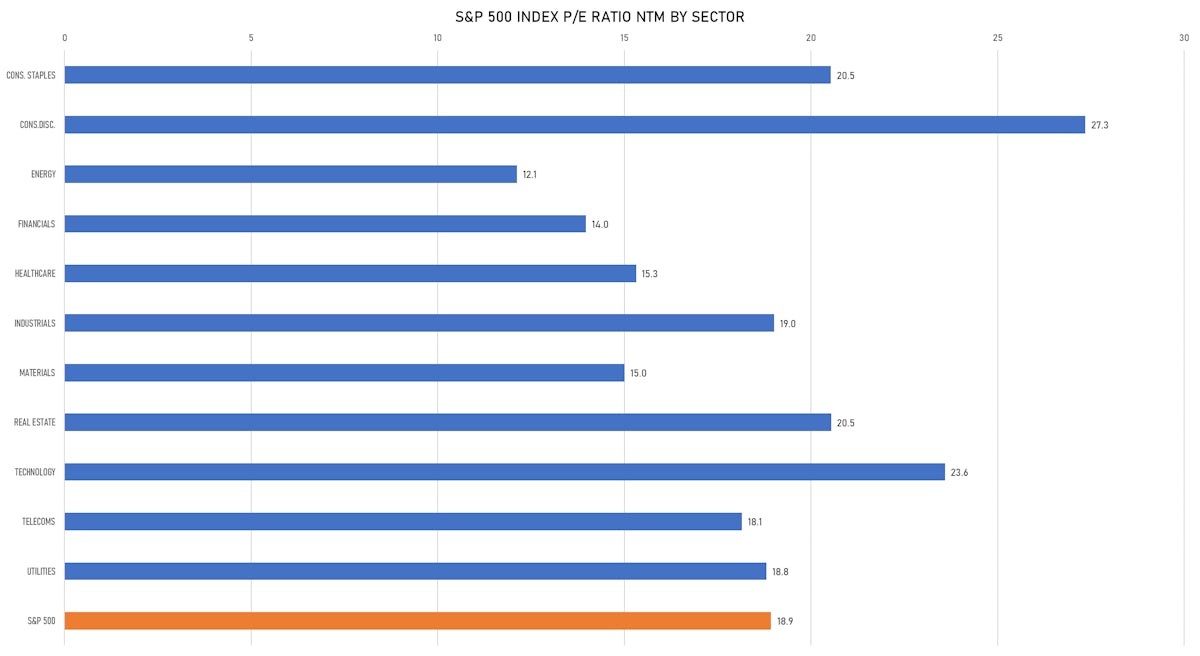
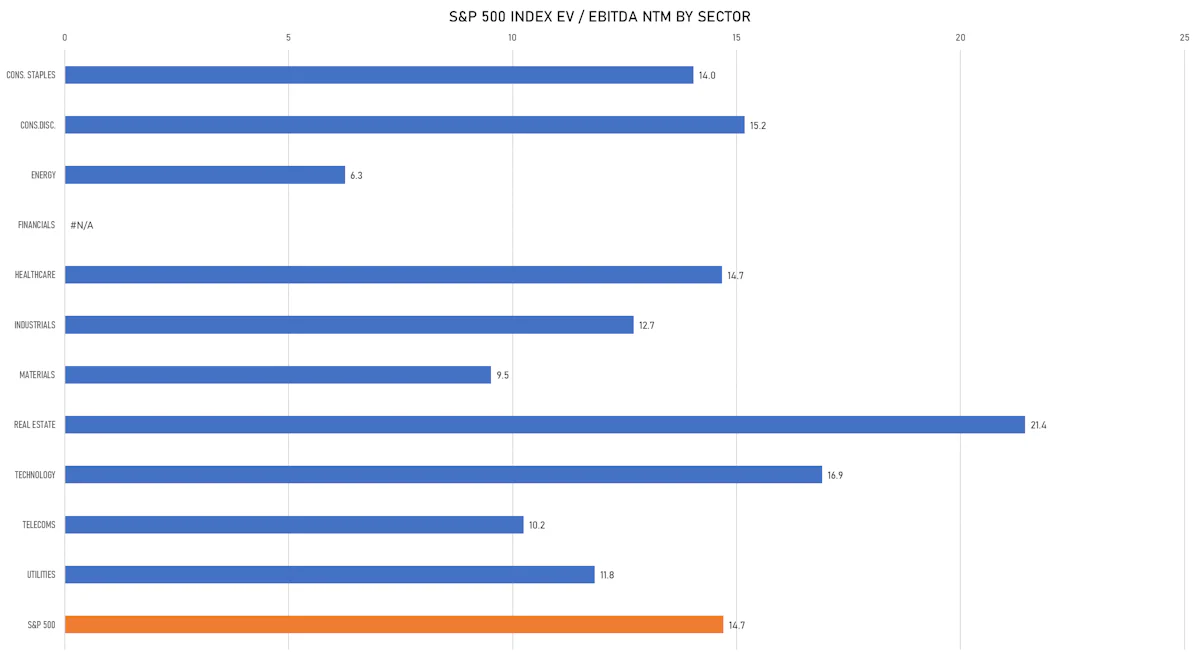
VALUATION MULTIPLES BY SECTORS
NEW IPOs ANNOUNCED OR PRICED
- Cohen & Steers Real Estate Opportunities & Income Fund / United States of America - Financials / Listing Exchange: New York / Ticker: RLTY / Gross proceeds (including overallotment): US$ 305.00m (offering in U.S. Dollar) / Bookrunners: Raymond James & Associates Inc, Stifel Nicolaus & Co Inc, Rockefeller Securities Group, Inc., Oppenheimer & Co Inc, Wells Fargo Securities LLC, RBC Capital Markets LLC, Morgan Stanley & Co LLC, BofA Securities Inc
- Haymaker Acquisition Corp IV / United States of America - Financials / Listing Exchange: Nasdaq / Ticker: HYIVU / Gross proceeds (including overallotment): US$ 261.00m (offering in U.S. Dollar) / Bookrunners: William Blair & Co, Cantor Fitzgerald & Co
- Shenzhen Mega Combine Technology Co Ltd / China - Consumer Products and Services / Listing Exchange: Hong Kong / Ticker: - / Gross proceeds (including overallotment): US$ 300.00m (offering in U.S. Dollar) / Bookrunners: Not Applicable
SECONDARIES / FOLLOW-ONS
- Equity Lifestyle Properties Inc / United States of America - Real Estate / Listing Exchange: New York / Ticker: ELS / Gross proceeds (including overallotment): US$ 500.00m (offering in U.S. Dollar) / Bookrunners: Not Applicable
- OUTFRONT Media Inc / United States of America - Media and Entertainment / Listing Exchange: New York / Ticker: OUT / Gross proceeds (including overallotment): US$ 232.53m (offering in U.S. Dollar) / Bookrunners: Not Applicable
- Indian Hotels Co Ltd / India - Media and Entertainment / Listing Exchange: National / Ticker: INDH / Gross proceeds (including overallotment): US$ 264.55m (offering in Indian Rupee) / Bookrunners: Not Applicable
- Indus Towers Ltd / India - Telecommunications / Listing Exchange: National / Ticker: INDUS / Gross proceeds (including overallotment): US$ 190.61m (offering in Indian Rupee) / Bookrunners: Morgan Stanley & Co
- Qianhe Condiment & Food Co Ltd / China - Consumer Staples / Listing Exchange: Shanghai / Ticker: 603027 / Gross proceeds (including overallotment): US$ 126.72m (offering in Chinese Yuan) / Bookrunners: Not Applicable
- Ningbo Yunsheng Co Ltd / China - Materials / Listing Exchange: Shanghai / Ticker: 600366 / Gross proceeds (including overallotment): US$ 110.93m (offering in Chinese Yuan) / Bookrunners: Not Applicable
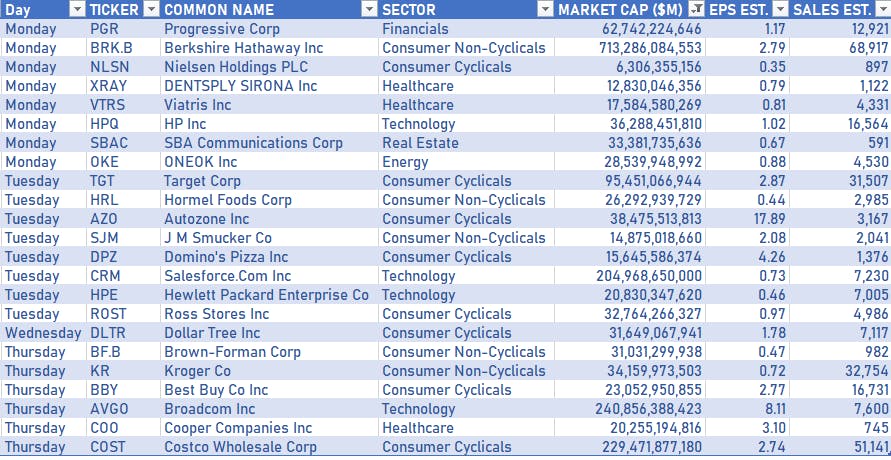
NOTABLE US EARNINGS RELEASES NEXT WEEK
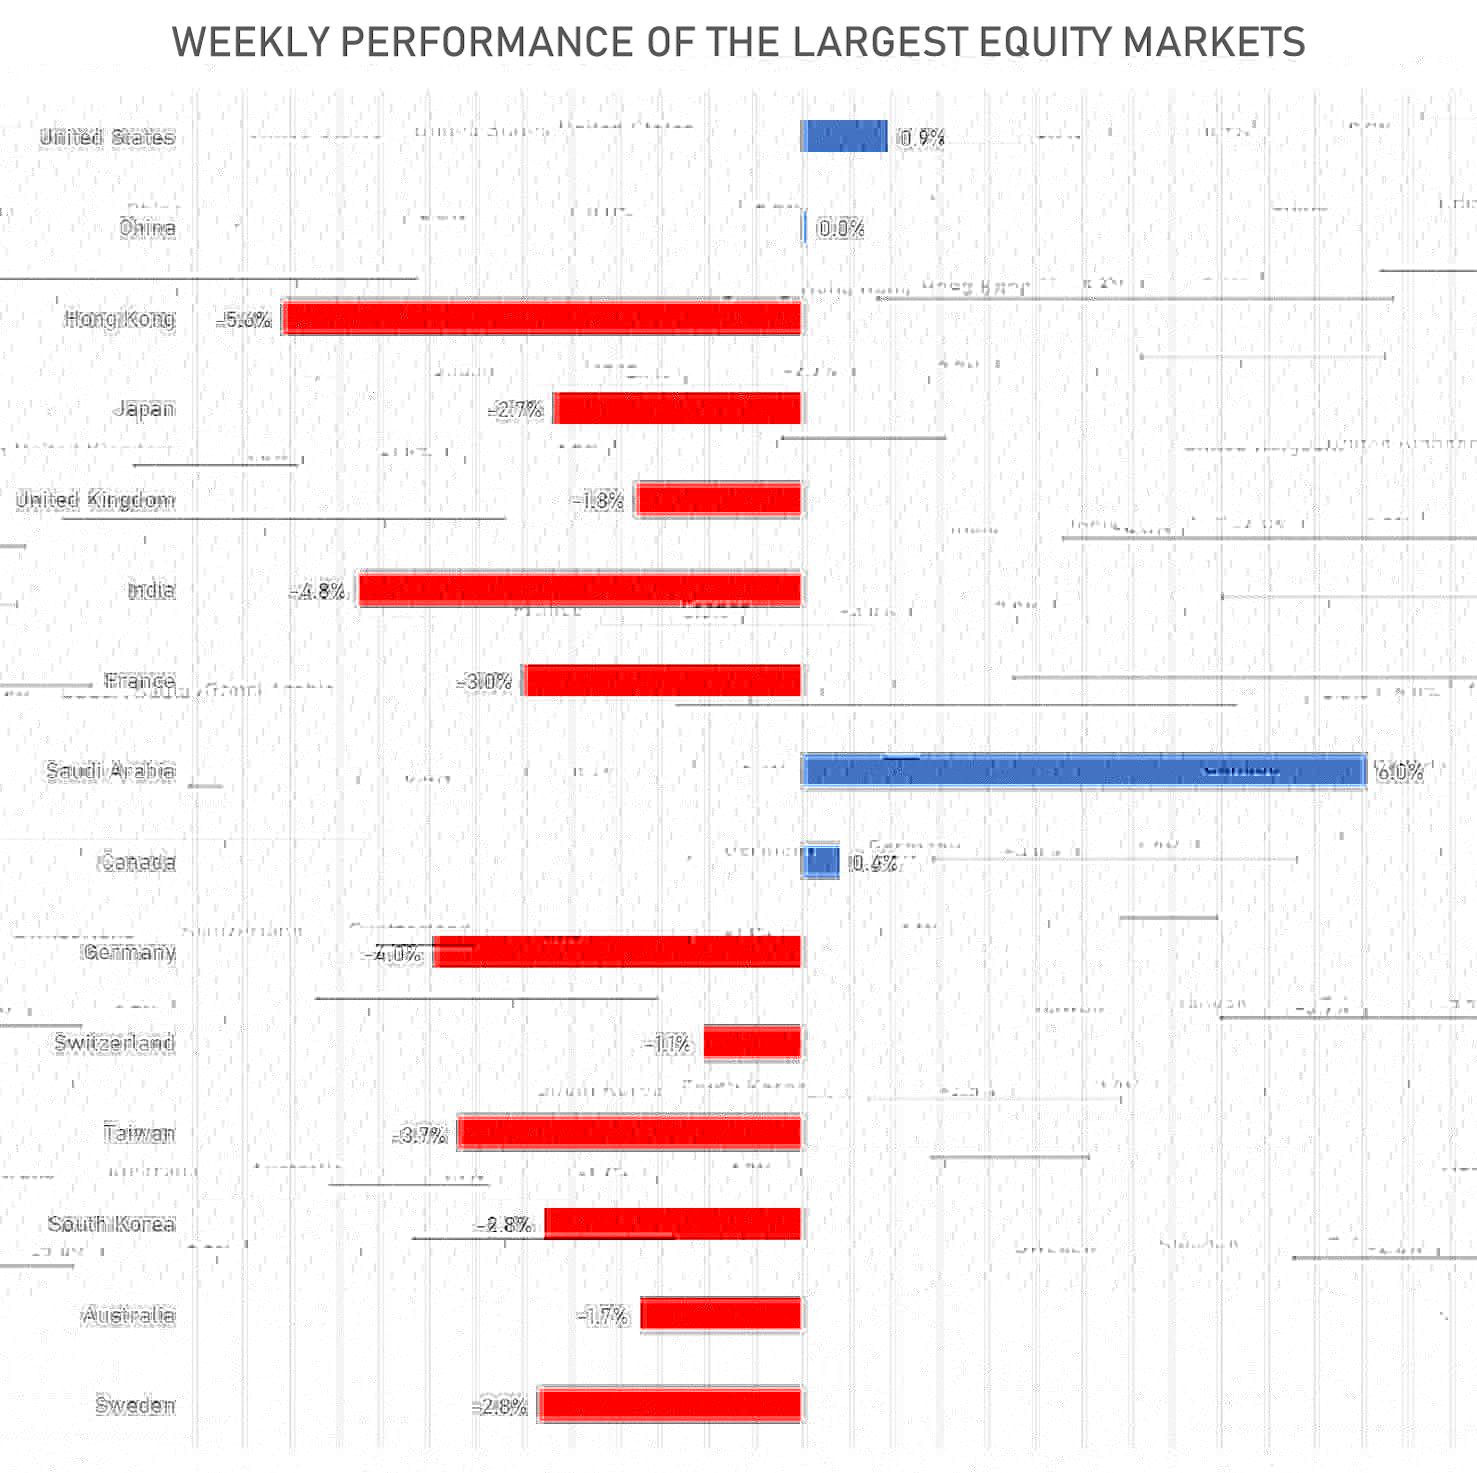
PERFORMANCE OF THE LARGEST GLOBAL MARKETS THIS WEEK
YEAR-TO-DATE TOP AND BOTTOM PERFOMING COUNTRIES
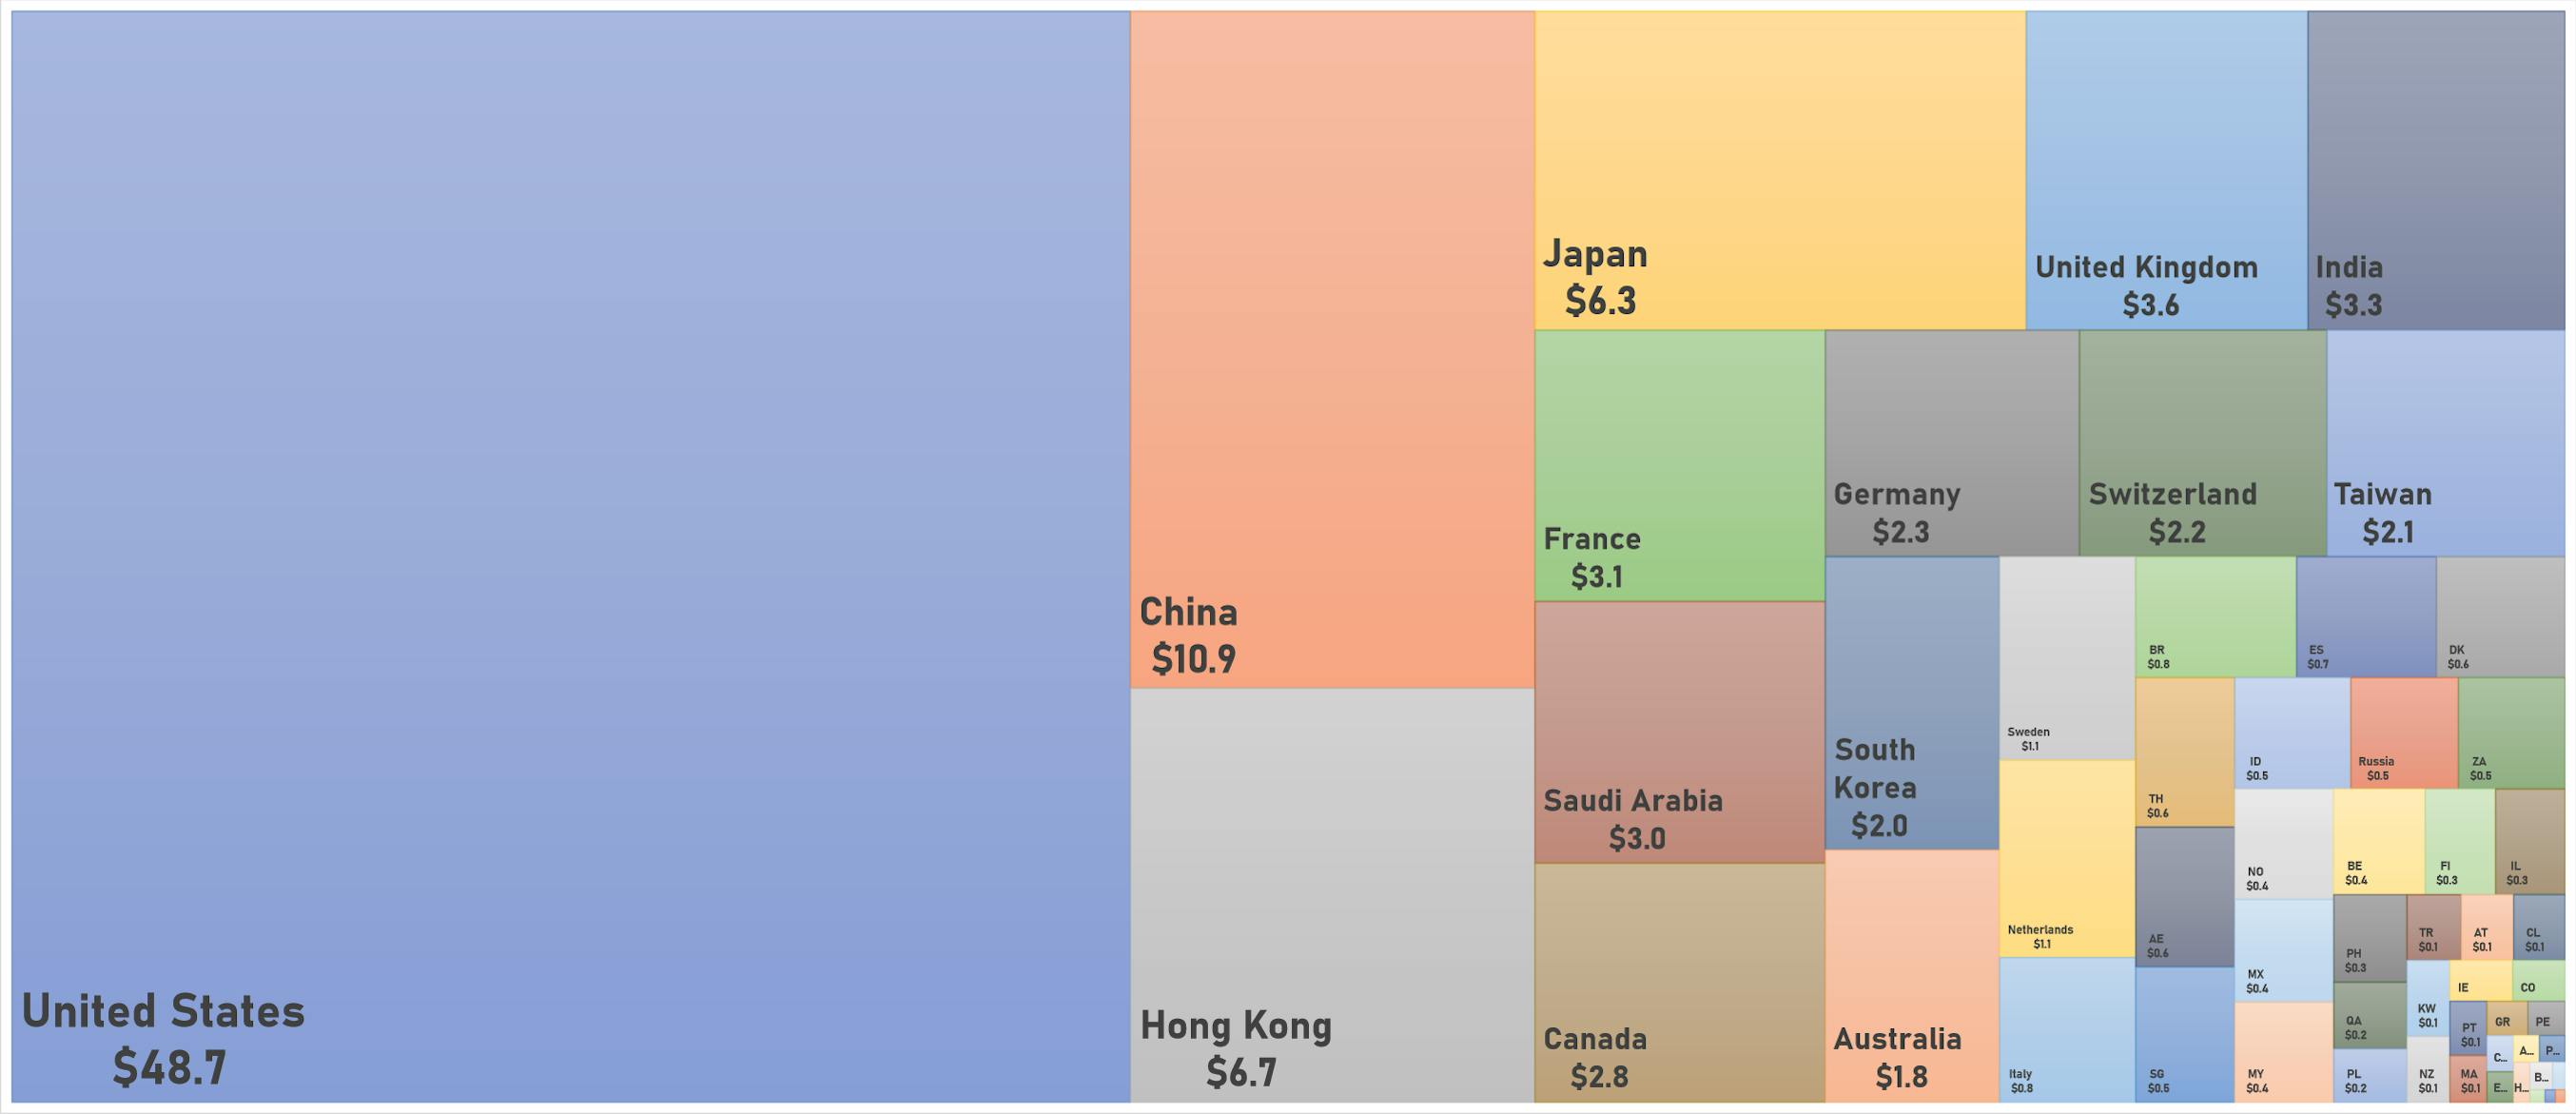
WORLD MARKET CAPITALIZATION BY COUNTRY