Equities
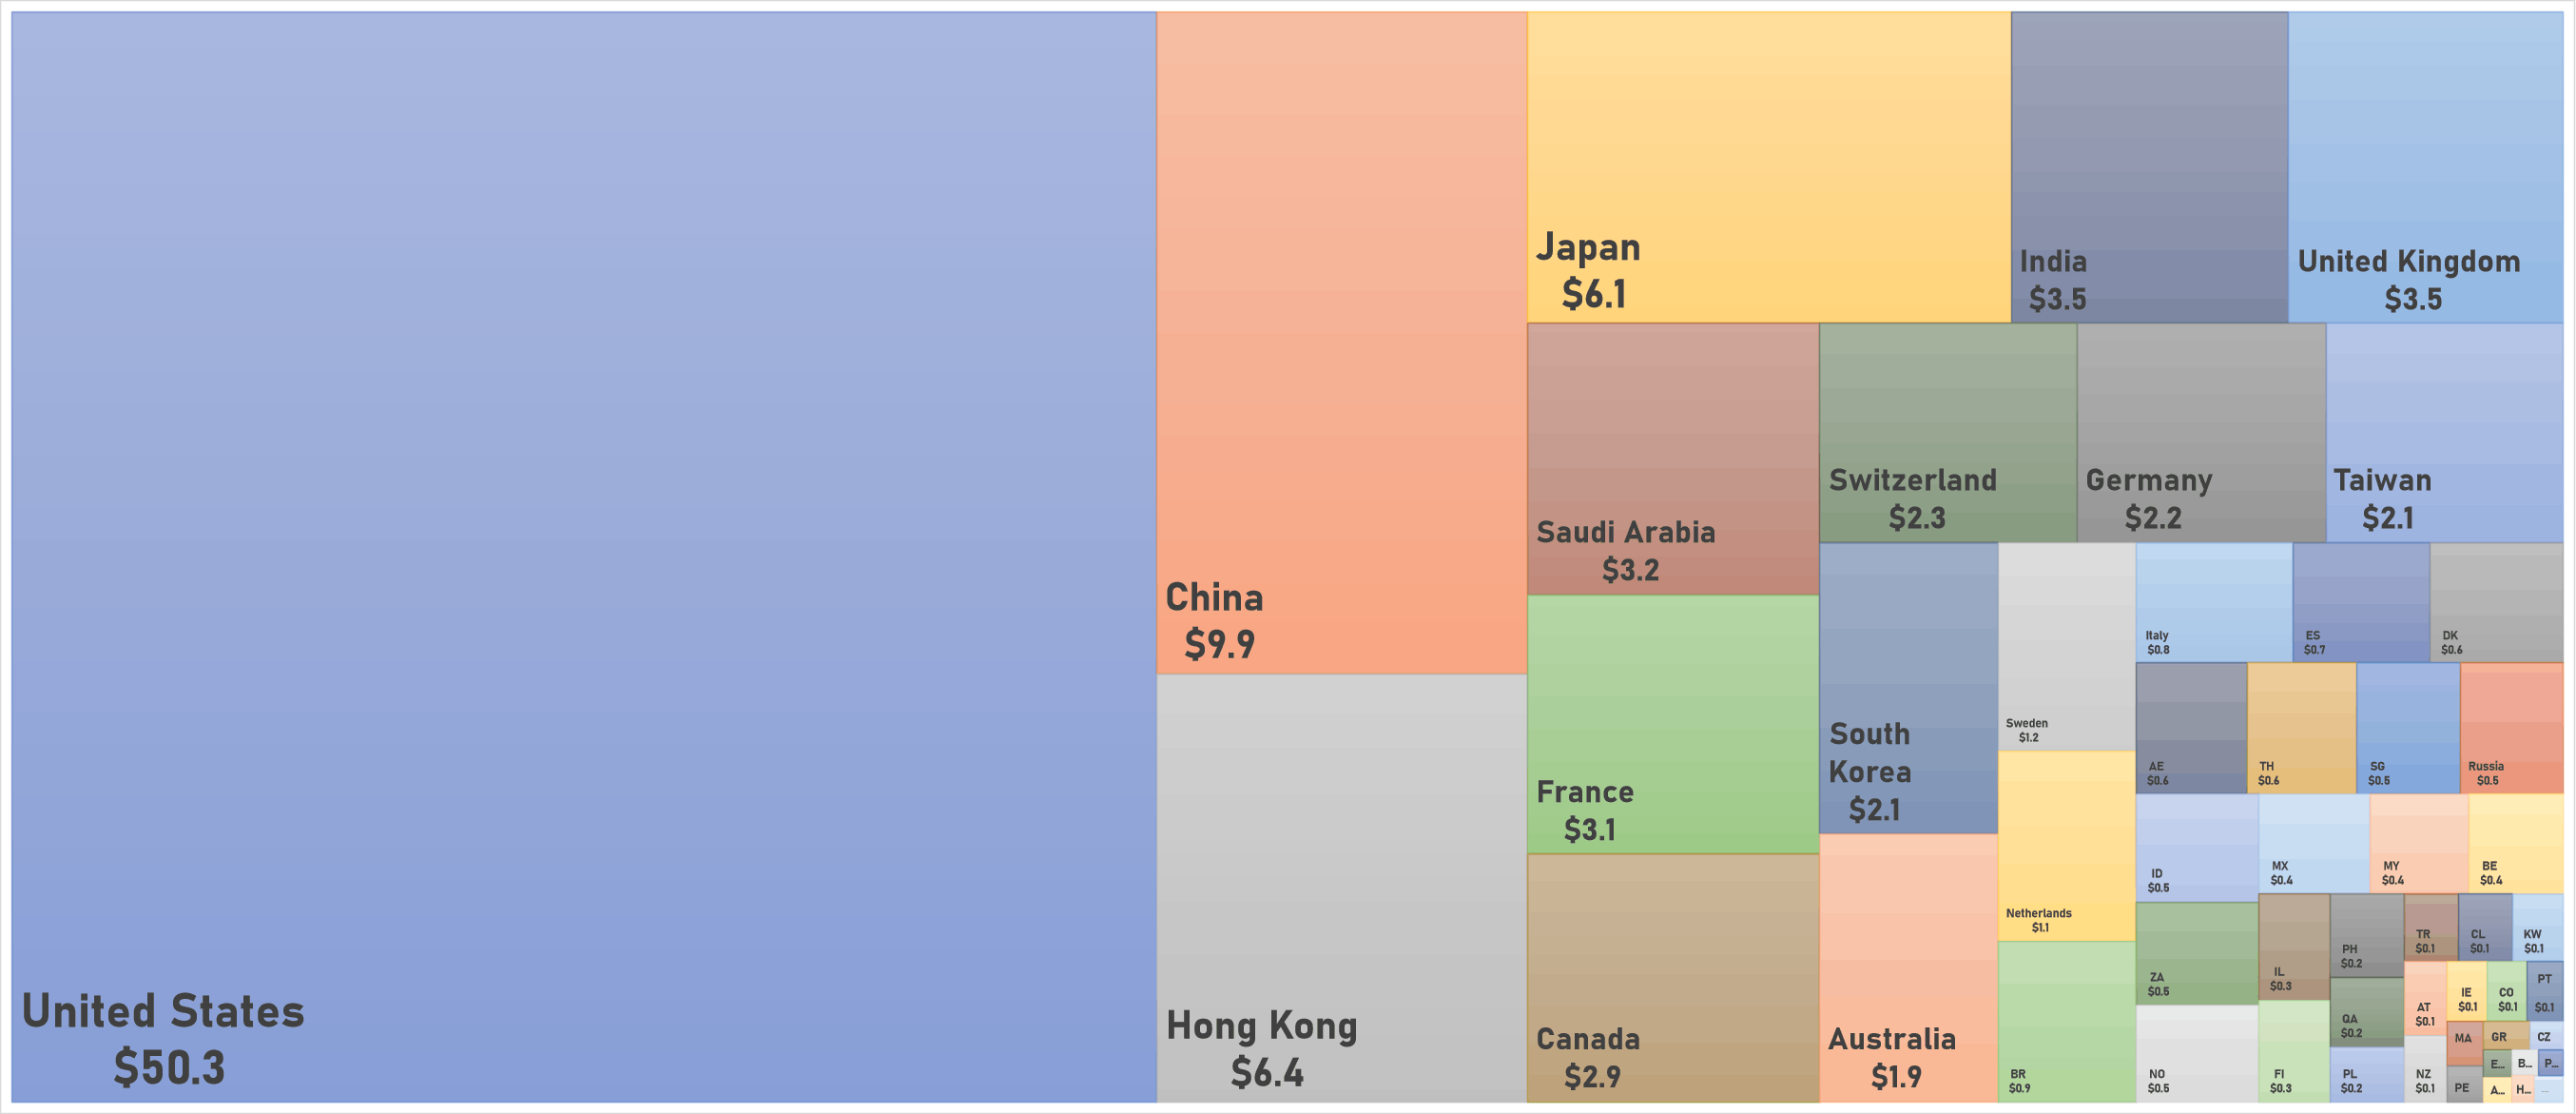
Equities Finished The Week On A Less Volatile Note, With Total US Market Capitalization Edging Back Above $50 Trillion
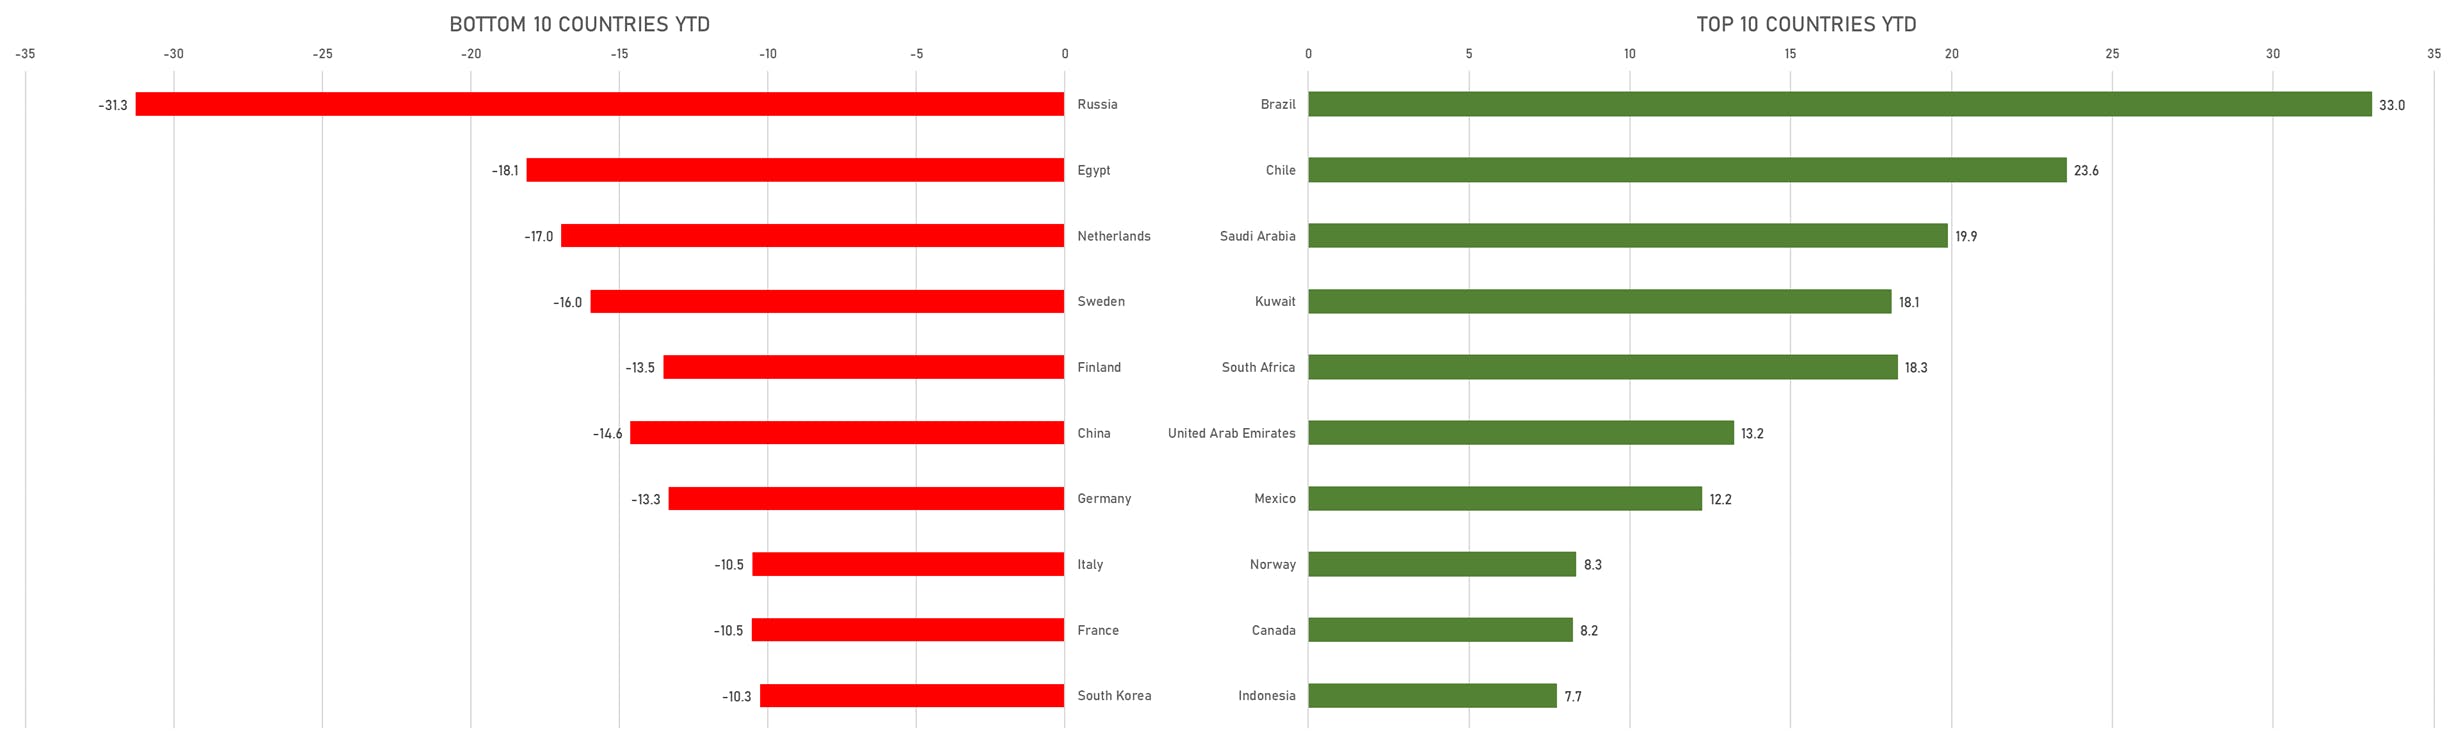
Looking at the top- and bottom-performing countries year-to-date, it's still very much about commodities and inflation, with exporters doing well (with the exception of Russia) and big importers doing badly
Published ET
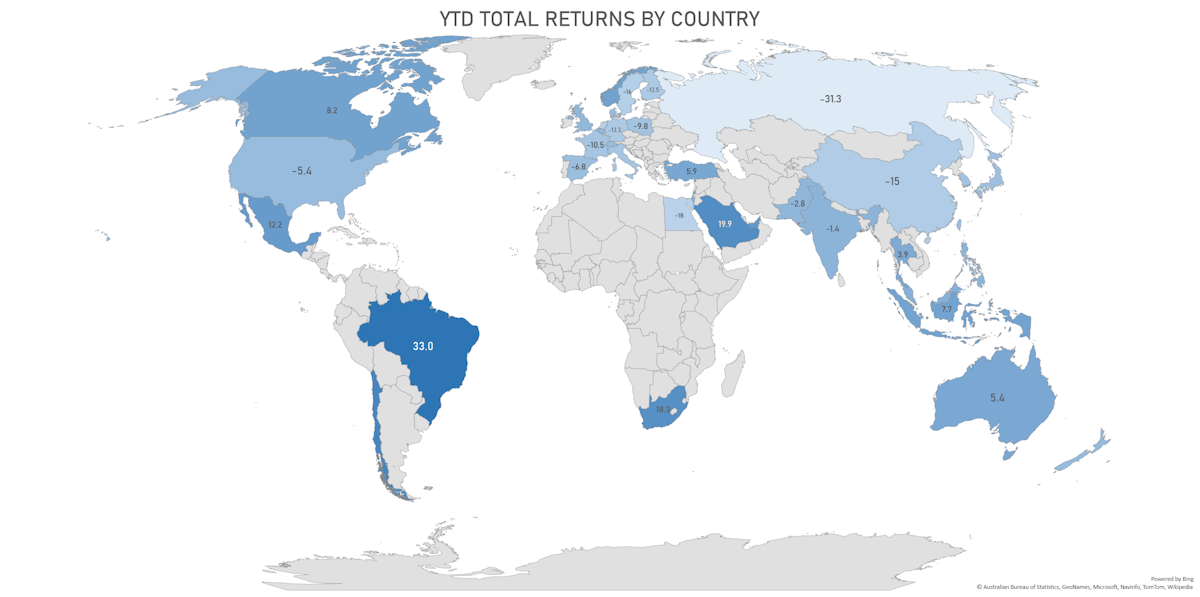
Equities Year To Date Total Returns By Country | Sources: ϕpost, Refinitiv data
DAILY SUMMARY
- Daily performance of US indices: S&P 500 up 0.34%; Nasdaq Composite up 0.29%; Wilshire 5000 up 0.43%
- 66.3% of S&P 500 stocks were up today, with 51.7% of stocks above their 200-day moving average (DMA) and 62.2% above their 50-DMA
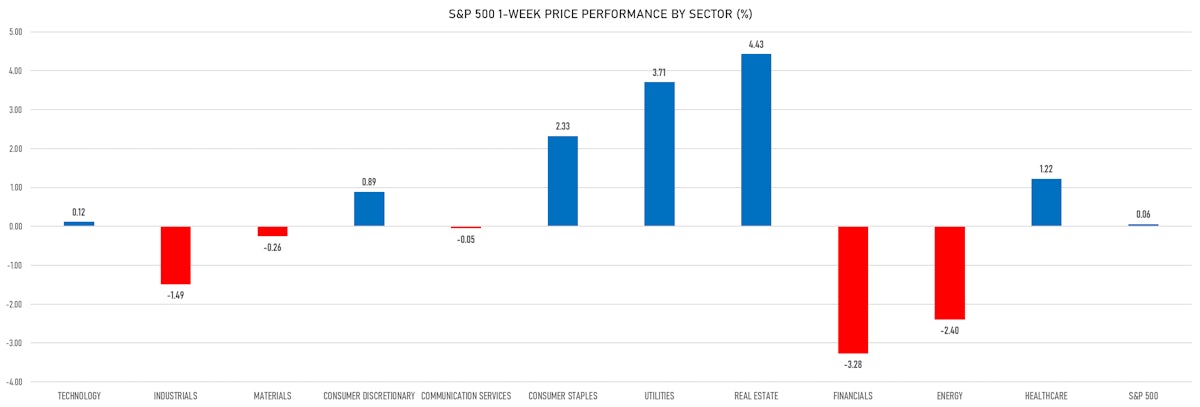
- Top performing sectors in the S&P 500: real estate up 2.02% and utilities up 1.45%
- Bottom performing sectors in the S&P 500: industrials down -0.70% and financials down -0.21%
- The number of shares in the S&P 500 traded today was 681m for a total turnover of US$ 75 bn
- The S&P 500 Value Index was up 0.5%, while the S&P 500 Growth Index was up 0.2%; the S&P small caps index was up 1.0% and mid-caps were up 0.6%
- The volume on CME's INX (S&P 500 Index) was 2.3m (3-month z-score: -0.8); the 3-month average volume is 2.7m and the 12-month range is 1.3 - 4.6m
- Daily performance of international indices: Europe Stoxx 600 up 0.54%; UK FTSE 100 up 0.30%; Hang Seng SH-SZ-HK 300 Index up 0.89%; Japan's TOPIX 500 down -0.13%
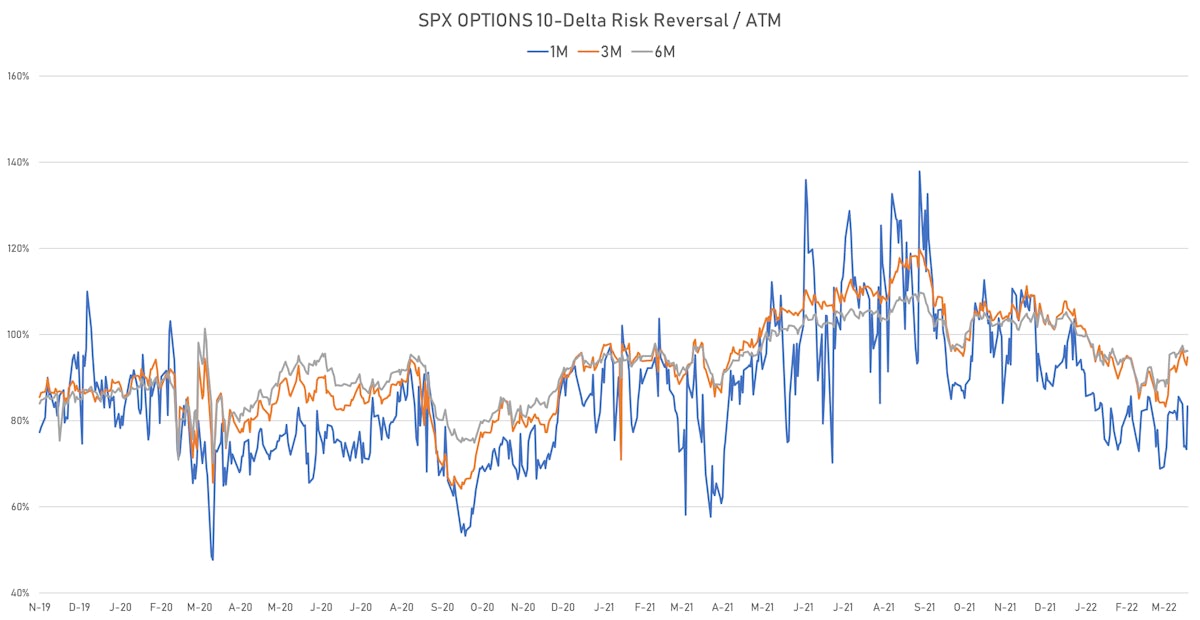
VOLATILITY
- 1-month at-the-money implied volatility on the S&P 500 at 15.8%, down from 16.3%
- 1-month at-the-money implied volatility on the Europe Stoxx 600 at 17.4%, down from 17.8%
TOP WINNERS
- Tellurian Inc (TELL), up 19.6% to $6.34 / YTD price return: +105.8% / 12-Month Price Range: $ 1.62-5.94 / Short interest (% of float): 17.6%; days to cover: 4.1
- NGM Biopharmaceuticals Inc (NGM), up 14.8% to $17.50 / 12-Month Price Range: $ 13.34-30.27 / Short interest (% of float): 4.5%; days to cover: 14.9
- Sigma Lithium Corp (SGML), up 14.3% to $15.53 / 12-Month Price Range: $ 3.84-15.22 / Short interest (% of float): 0.2%; days to cover: 1.1
- Phreesia Inc (PHR), up 13.9% to $30.02 / 12-Month Price Range: $ 22.89-76.10 / Short interest (% of float): 3.4%; days to cover: 3.8 (the stock is currently on the short sale restriction list)
- nCino Inc (NCNO), up 13.7% to $46.58 / YTD price return: -15.1% / 12-Month Price Range: $ 37.65-79.43 / Short interest (% of float): 4.8%; days to cover: 5.0
- Ke Holdings Inc (BEKE), up 13.3% to $14.01 / YTD price return: -30.4% / 12-Month Price Range: $ 7.31-62.20 / Short interest (% of float): 2.6%; days to cover: 1.6
- DiDi Global Inc (DIDI), up 12.8% to $2.82 / YTD price return: -43.4% / 12-Month Price Range: $ 1.71-18.01 / Short interest (% of float): 0.7%; days to cover: 0.8 (the stock is currently on the short sale restriction list)
- Alphatec Holdings Inc (ATEC), up 12.1% to $12.89 / YTD price return: +12.8% / 12-Month Price Range: $ 9.06-18.00 / Short interest (% of float): 9.0%; days to cover: 11.4
- SAGE Therapeutics Inc (SAGE), up 11.8% to $37.00 / YTD price return: -13.0% / 12-Month Price Range: $ 30.48-81.00 / Short interest (% of float): 6.2%; days to cover: 4.6
- Astra Space Inc (ASTR), up 11.7% to $4.31 / 12-Month Price Range: $ 2.87-16.95 / Short interest (% of float): 12.2%; days to cover: 2.3
BIGGEST LOSERS
- Redwire Corp (RDW), down 28.7% to $6.05 / YTD price return: -10.4% / 12-Month Price Range: $ 4.25-16.98 / Short interest (% of float): 9.0%; days to cover: 2.2 (the stock is currently on the short sale restriction list)
- Pulse Biosciences Inc (PLSE), down 27.0% to $3.55 / YTD price return: -76.0% / 12-Month Price Range: $ 4.14-29.16 / Short interest (% of float): 19.9%; days to cover: 11.1 (the stock is currently on the short sale restriction list)
- Shapeways Holdings Inc (SHPW), down 21.0% to $2.26 / YTD price return: -39.1% / 12-Month Price Range: $ 2.11-12.81 / Short interest (% of float): 1.0%; days to cover: 2.7 (the stock is currently on the short sale restriction list)
- Allego NV (ALLG), down 18.5% to $12.32 / YTD price return: +24.8% / 12-Month Price Range: $ 5.66-28.44 / Short interest (% of float): 0.1%; days to cover: 0.5 (the stock is currently on the short sale restriction list)
- Spero Therapeutics Inc (SPRO), down 18.3% to $7.11 / 12-Month Price Range: $ 7.51-19.87 / Short interest (% of float): 11.6%; days to cover: 20.8 (the stock is currently on the short sale restriction list)
- Inspirato Inc (ISPO), down 16.1% to $8.34 / YTD price return: -17.4% / 12-Month Price Range: $ 7.70-108.00 / Short interest (% of float): 3.3%; days to cover: 1.0 (the stock is currently on the short sale restriction list)
- Blend Labs Inc (BLND), down 15.8% to $4.80 / 12-Month Price Range: $ 5.67-21.04 / Short interest (% of float): 6.4%; days to cover: 5.6 (the stock is currently on the short sale restriction list)
- Charah Solutions Inc (CHRA), down 15.6% to $4.21 / 12-Month Price Range: $ 3.94-6.63 / Short interest (% of float): 1.0%; days to cover: 3.3 (the stock is currently on the short sale restriction list)
- PAM Transportation Services Inc (PTSI), down 14.5% to $29.70 / 12-Month Price Range: $ 12.94-40.89 / Short interest (% of float): 2.2%; days to cover: 2.5 (the stock is currently on the short sale restriction list)
- IGM Biosciences Inc (IGMS), down 14.4% to $22.87 / 12-Month Price Range: $ 13.11-99.44 / Short interest (% of float): 30.6%; days to cover: 16.7 (the stock is currently on the short sale restriction list)
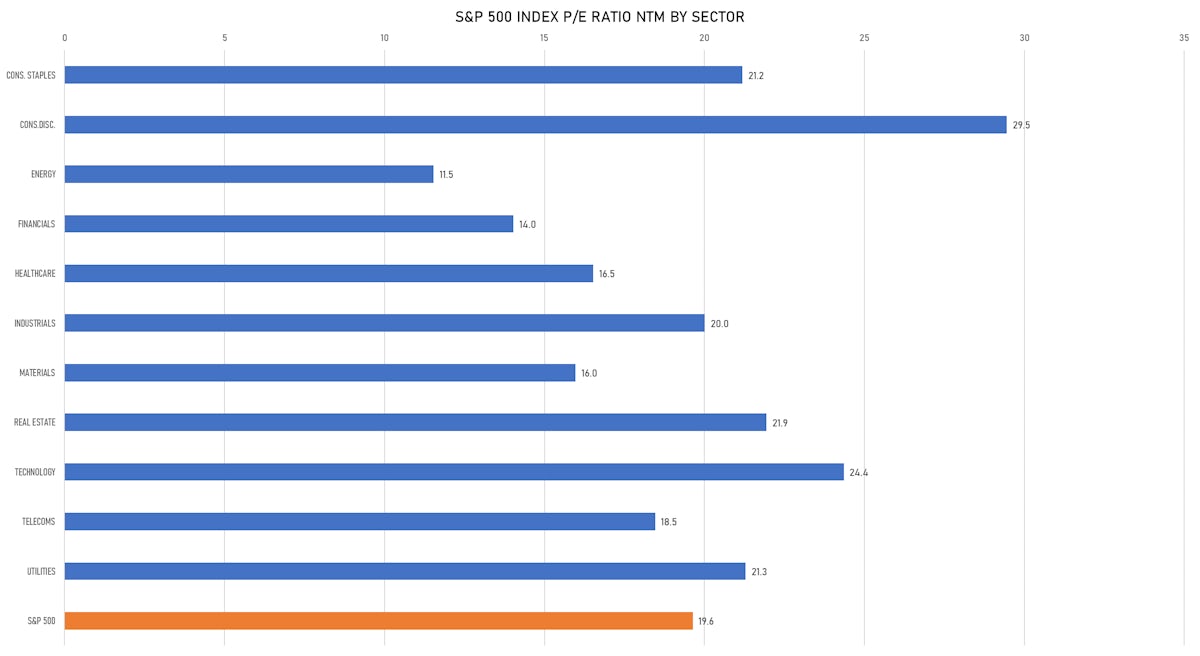
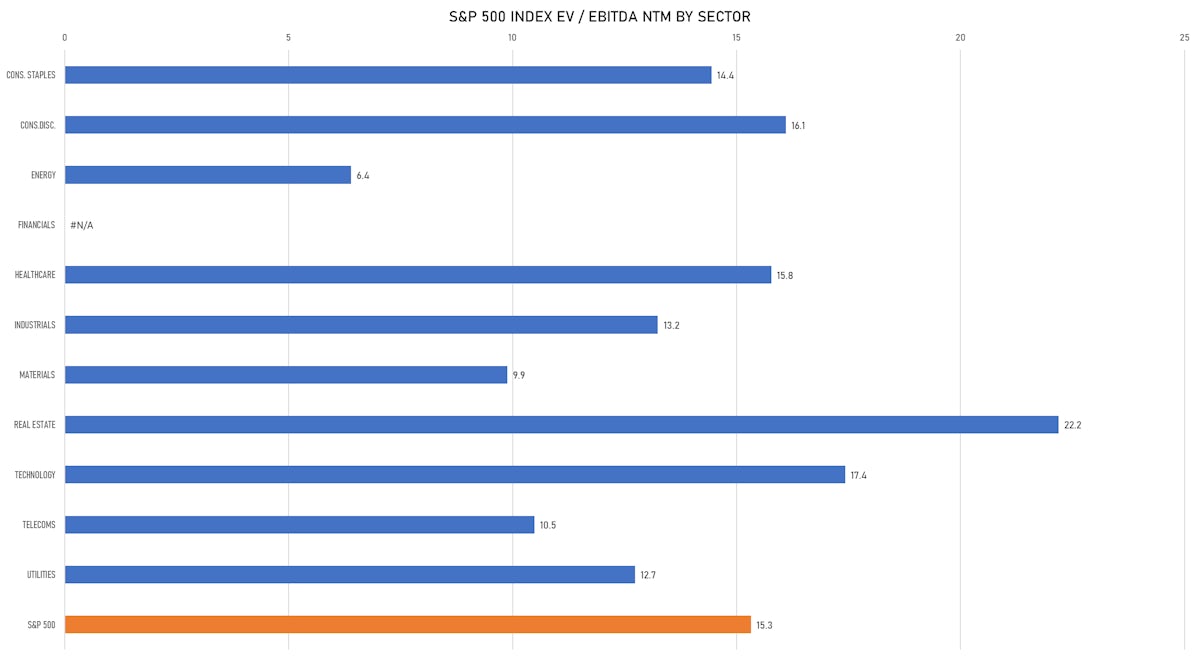
VALUATION MULTIPLES BY SECTORS
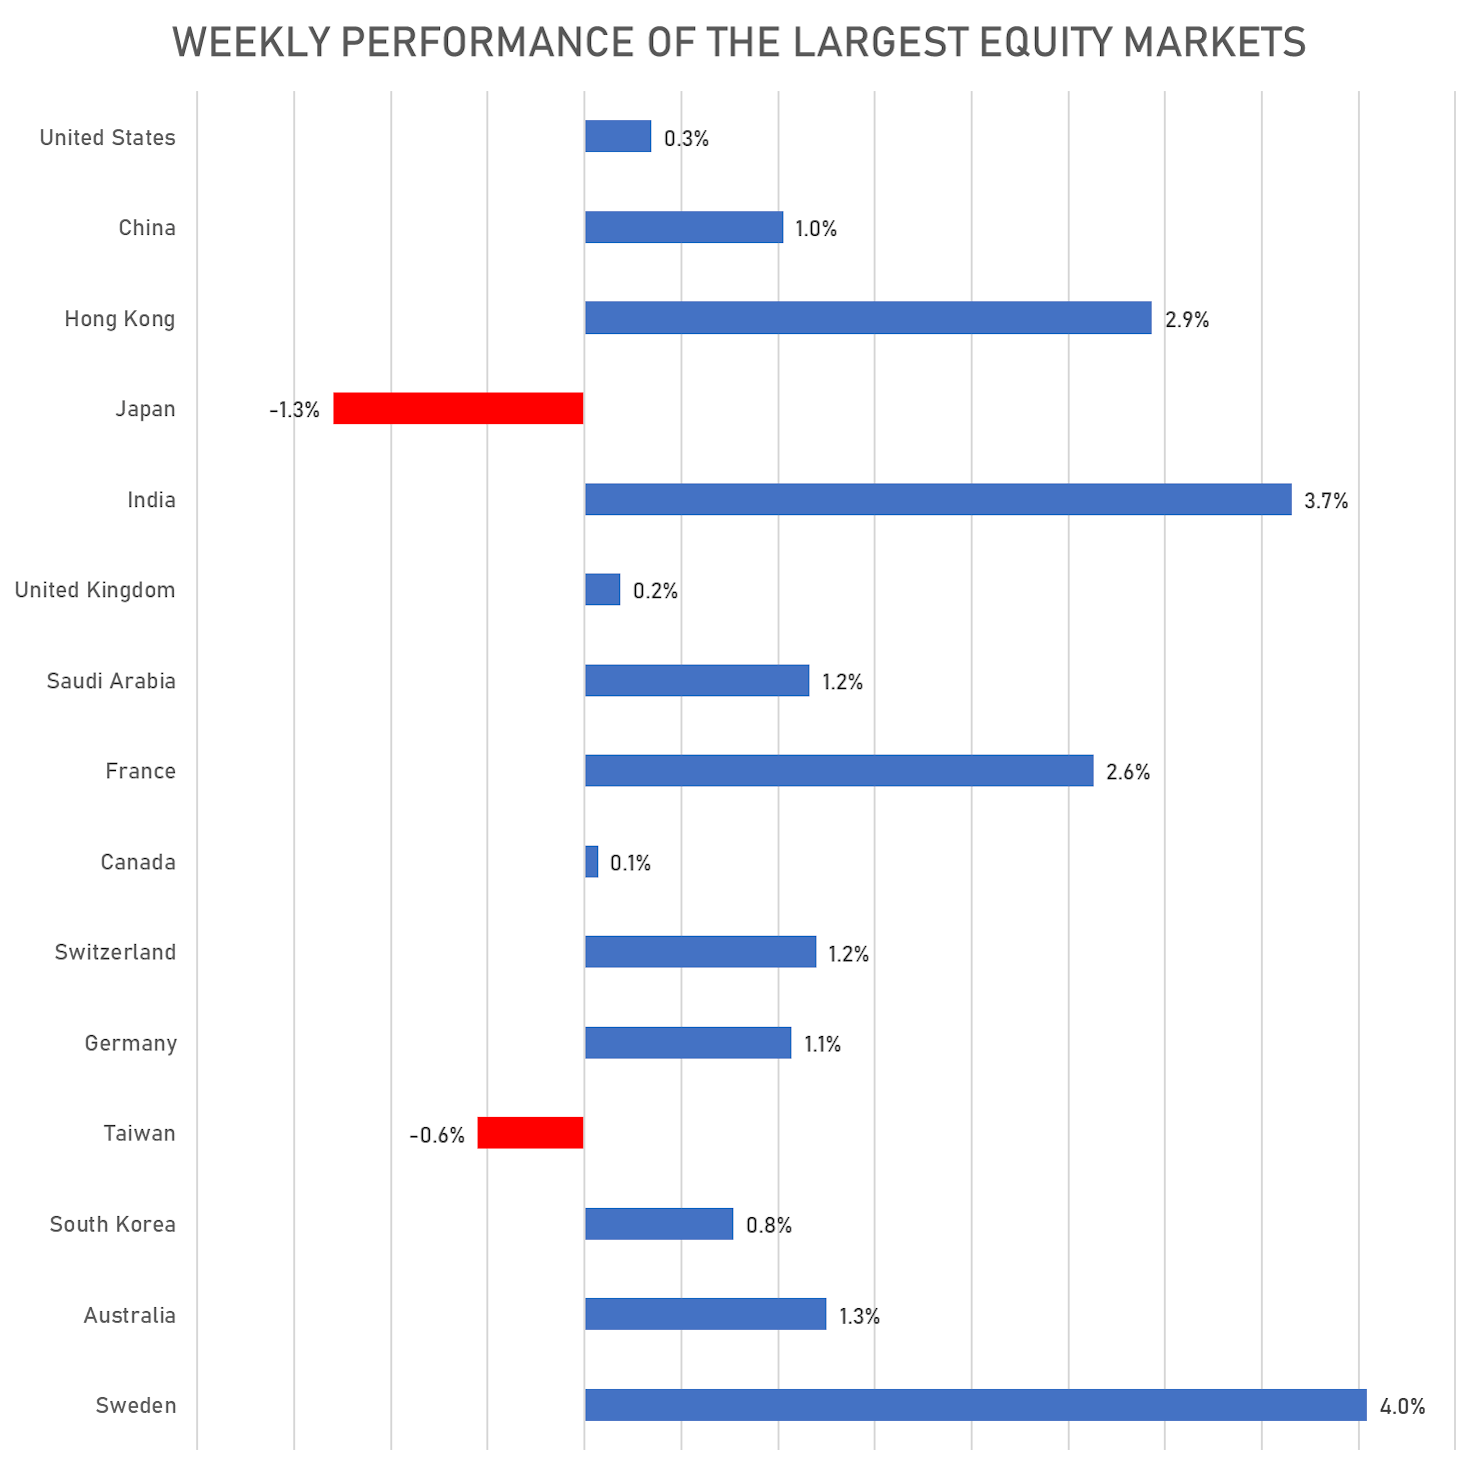
WEEKLY PERFORMANCE OF THE LARGEST GLOBAL MARKETS
TOP / BOTTOM PERFORMING COUNTRIES THIS YEAR
WORLD MARKET CAP BY COUNTRY (US$ tn)