Equities
Ugly Session Across The Board For US Equities On Friday, With Just 3% Of S&P 500 Stocks Closing Higher Into The Weekend
Looking at volatility across asset classes, it feels like equity implied vols are a little light on a relative basis: with 3m into 2Y USD swaptions trading above 150 normals, the VIX is still in the 20s
Published ET
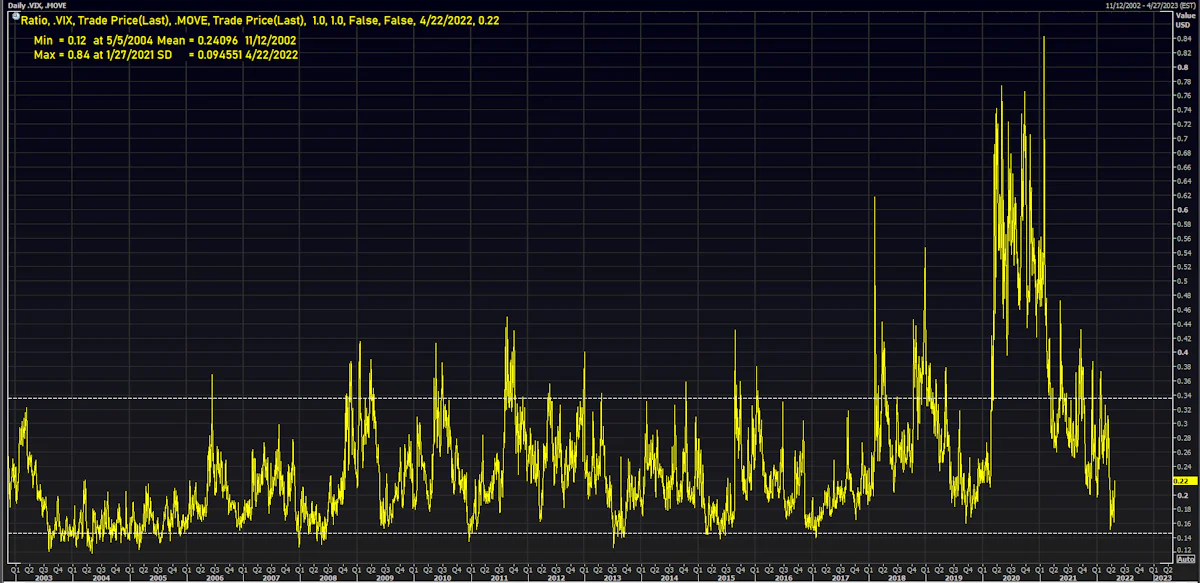
VIX to MOVE Ratio Of Implied Volatility Indices | Source: Refinitiv
DAILY SUMMARY
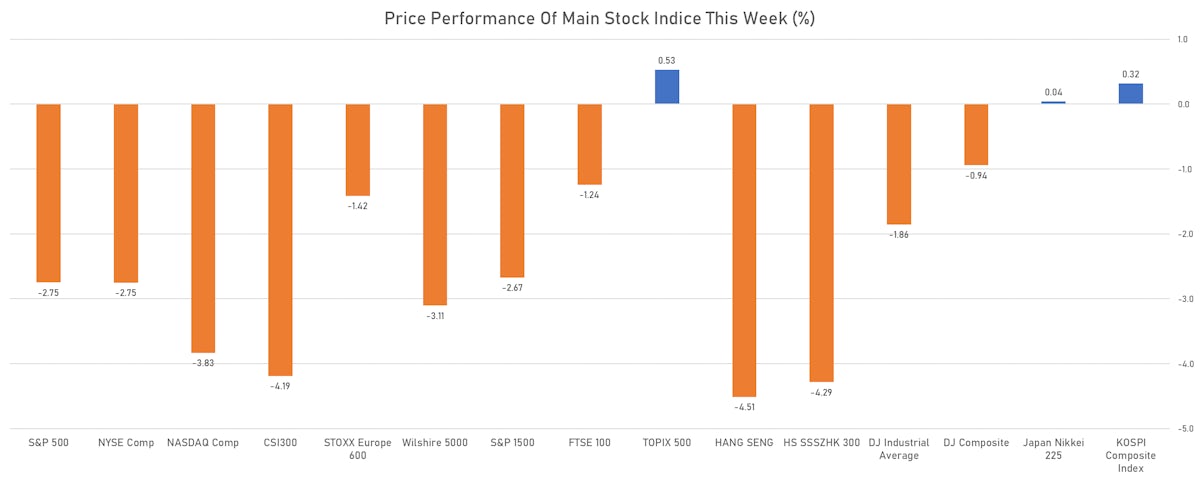
- Performance of US indices on 22 April 2022: S&P 500 down -2.77%; Nasdaq Composite down -2.55%; Wilshire 5000 down -2.72%%
- 3.0% of S&P 500 stocks were up today, with 43.6% of stocks above their 200-day moving average (DMA) and 41.4% above their 50-DMA
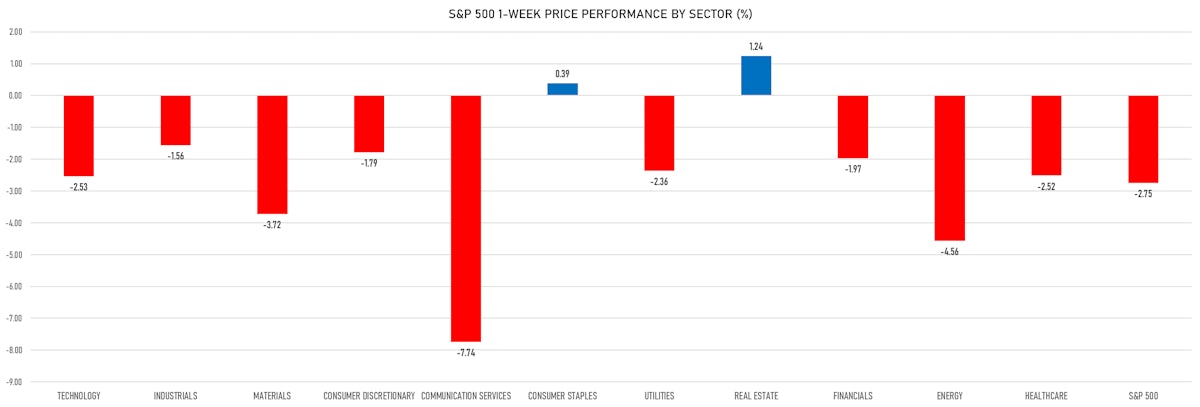
- Top performing sectors in the S&P 500: consumer staples down -1.59% and utilities down -1.68%
- Bottom performing sectors in the S&P 500: materials down -3.73% and healthcare down -3.63%
- The number of shares in the S&P 500 traded today was 693m for a total turnover of US$ 83 bn
- The S&P 500 Value Index was down -2.6%, while the S&P 500 Growth Index was down -2.9%; the S&P small caps index was down -2.5% and mid-caps were down -2.7%
- The volume on CME's INX (S&P 500 Index) was 2.5m (3-month z-score: -0.4); the 3-month average volume is 2.7m and the 12-month range is 1.3 - 4.6m
- Daily performance of international indices: Europe Stoxx 600 down -1.79%; UK FTSE 100 down -1.39%; Hang Seng SH-SZ-HK 300 Index up 0.28%; Japan's TOPIX 500 down -1.18%
VOLATILITY
- 1-month at-the-money implied volatility on the S&P 500 at 23.4%, up from 18.5%
- 1-month at-the-money implied volatility on the Europe Stoxx 600 at 20.0%, up from 17.6%
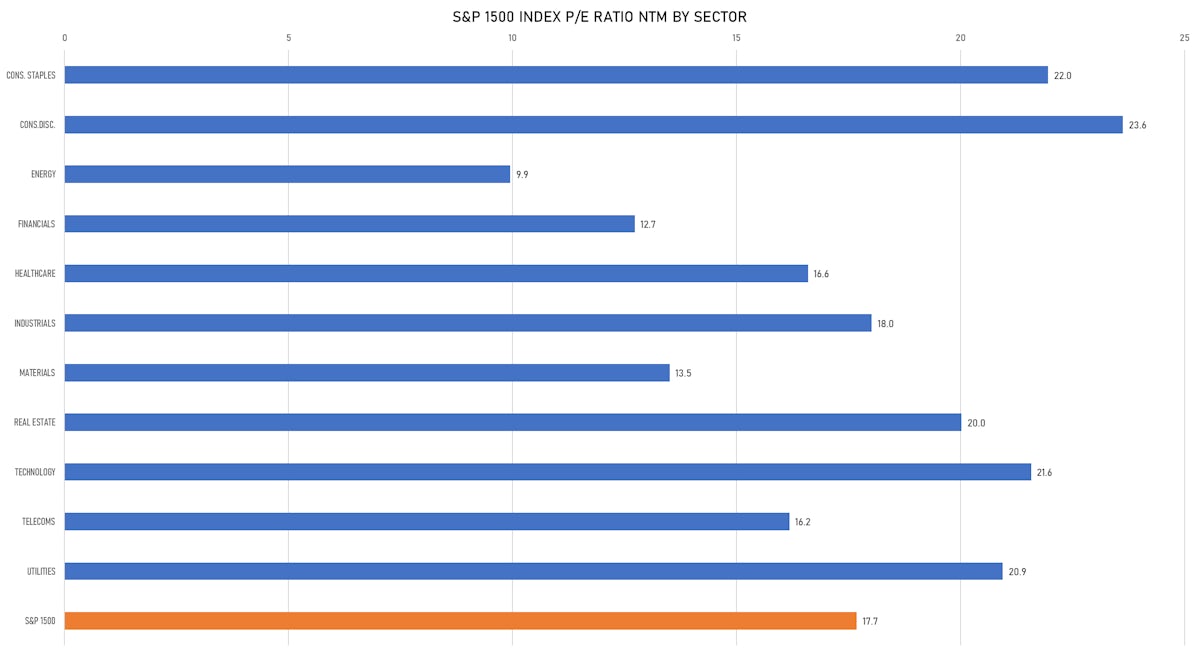
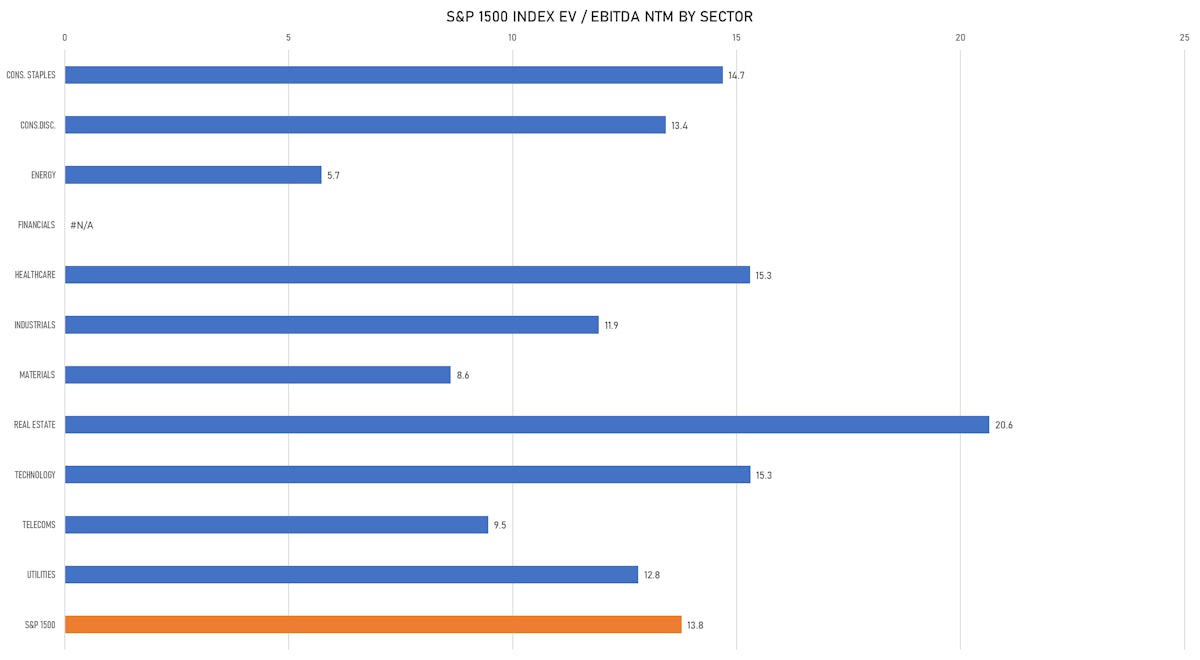
VALUATION MULTIPLES BY SECTORS
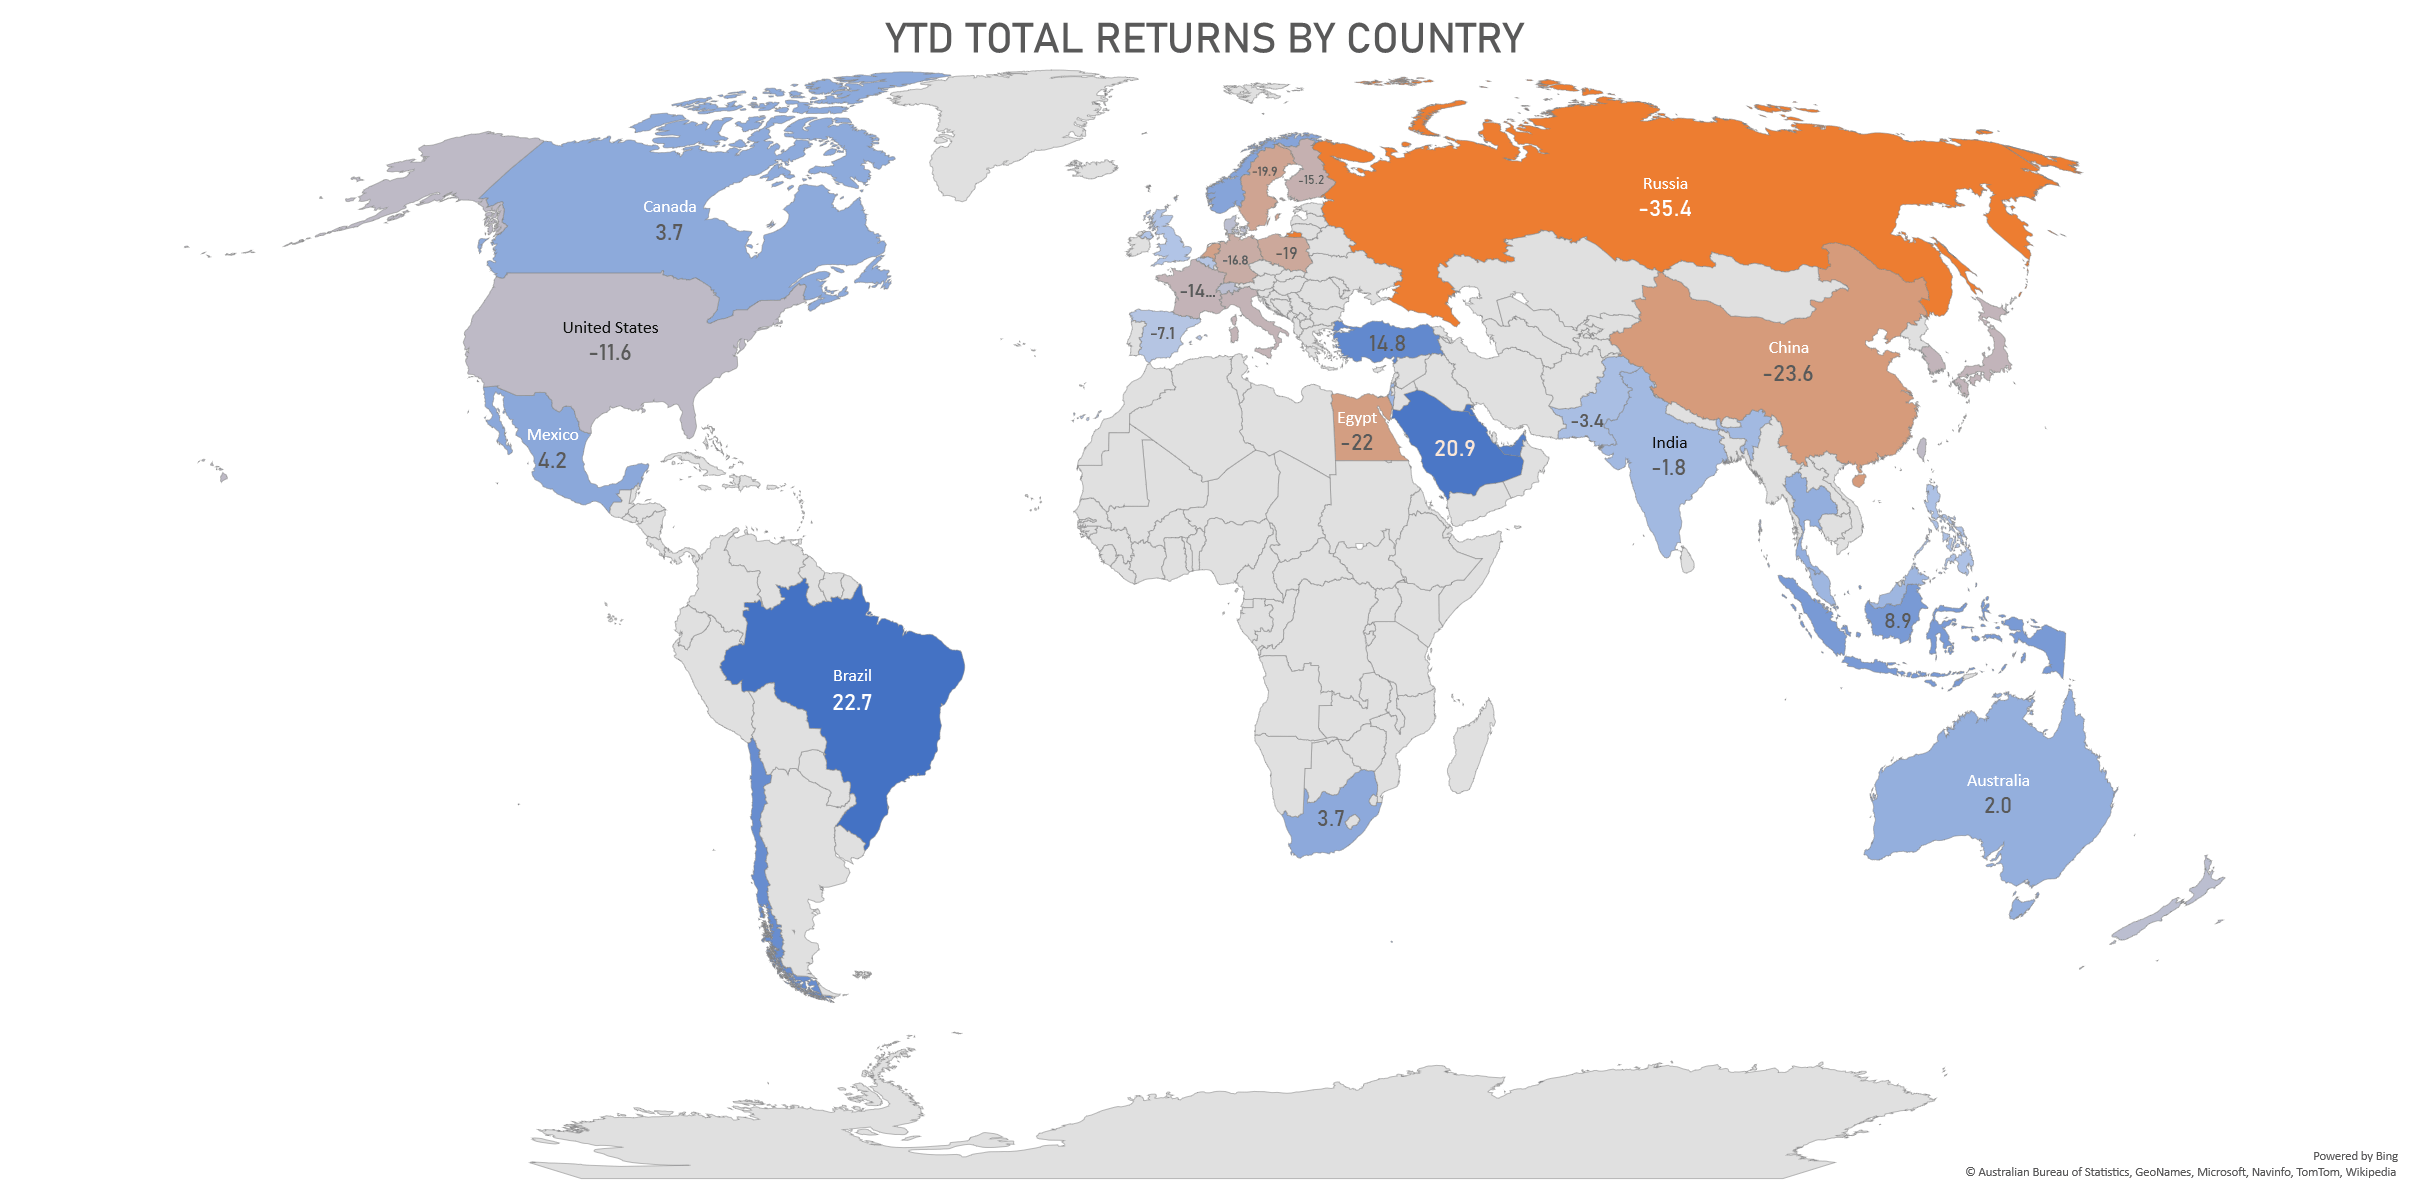
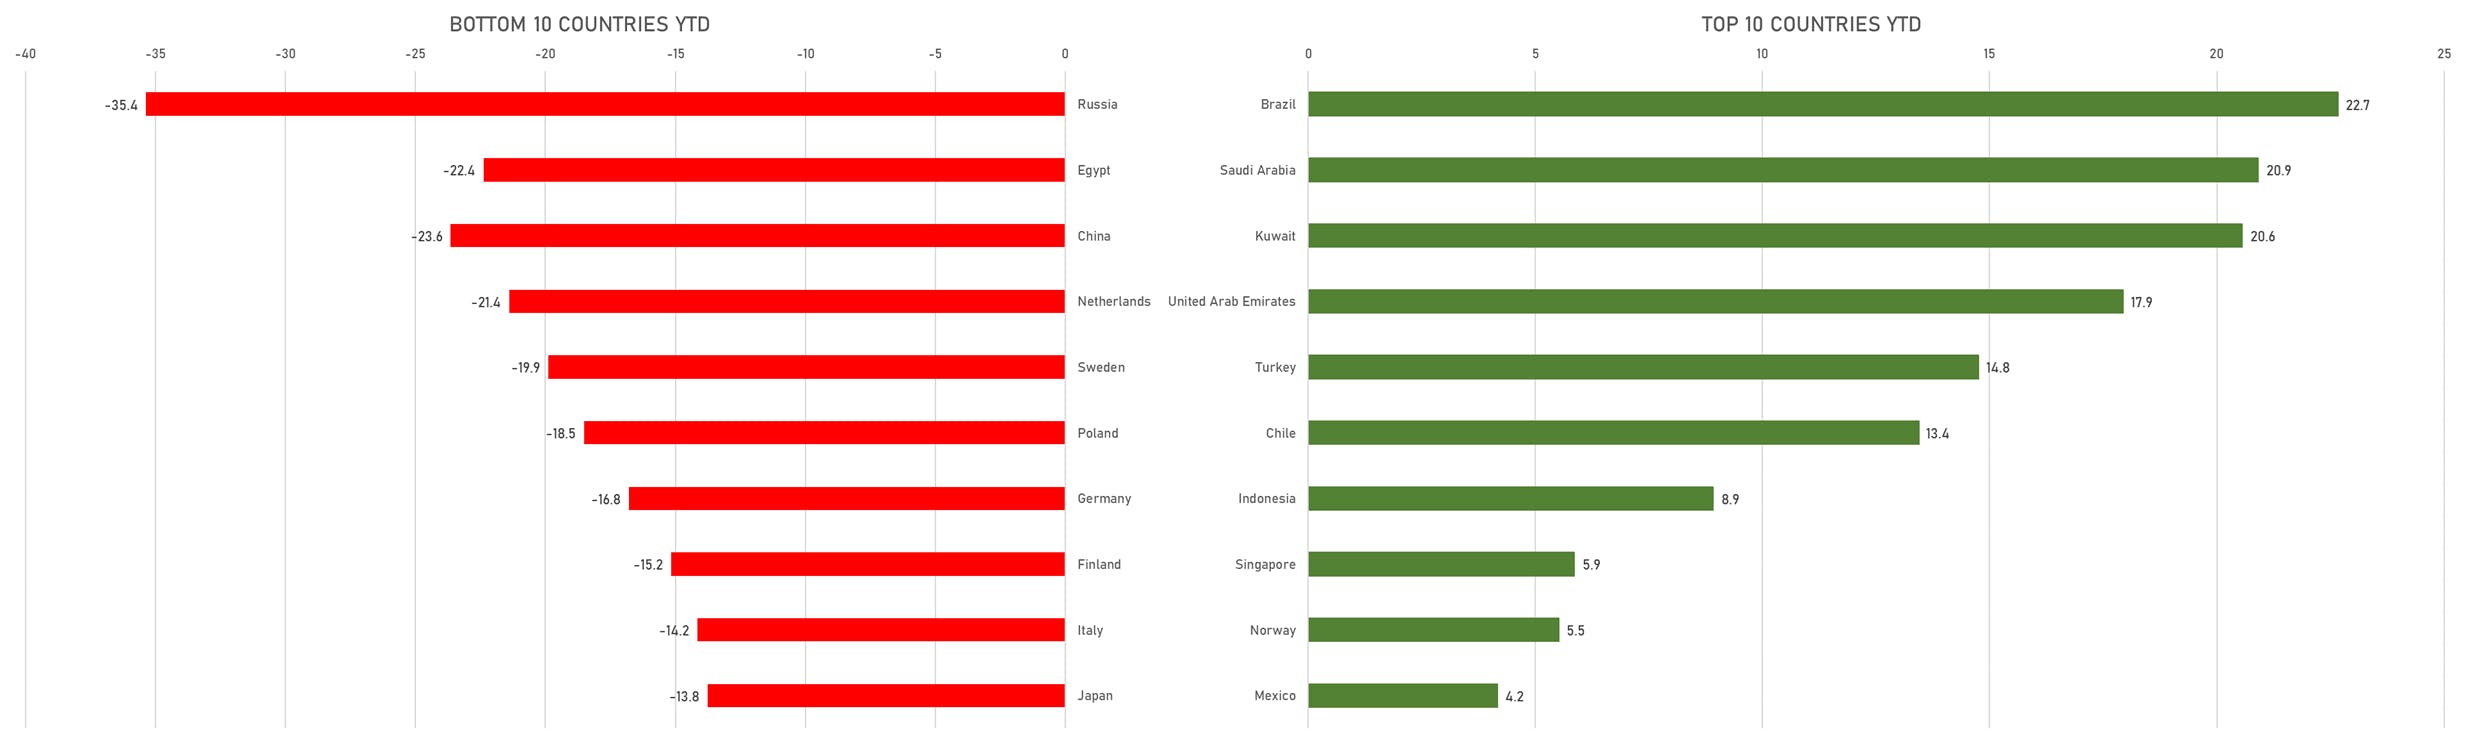
TOP / BOTTOM PERFORMING COUNTRIES THIS YEAR
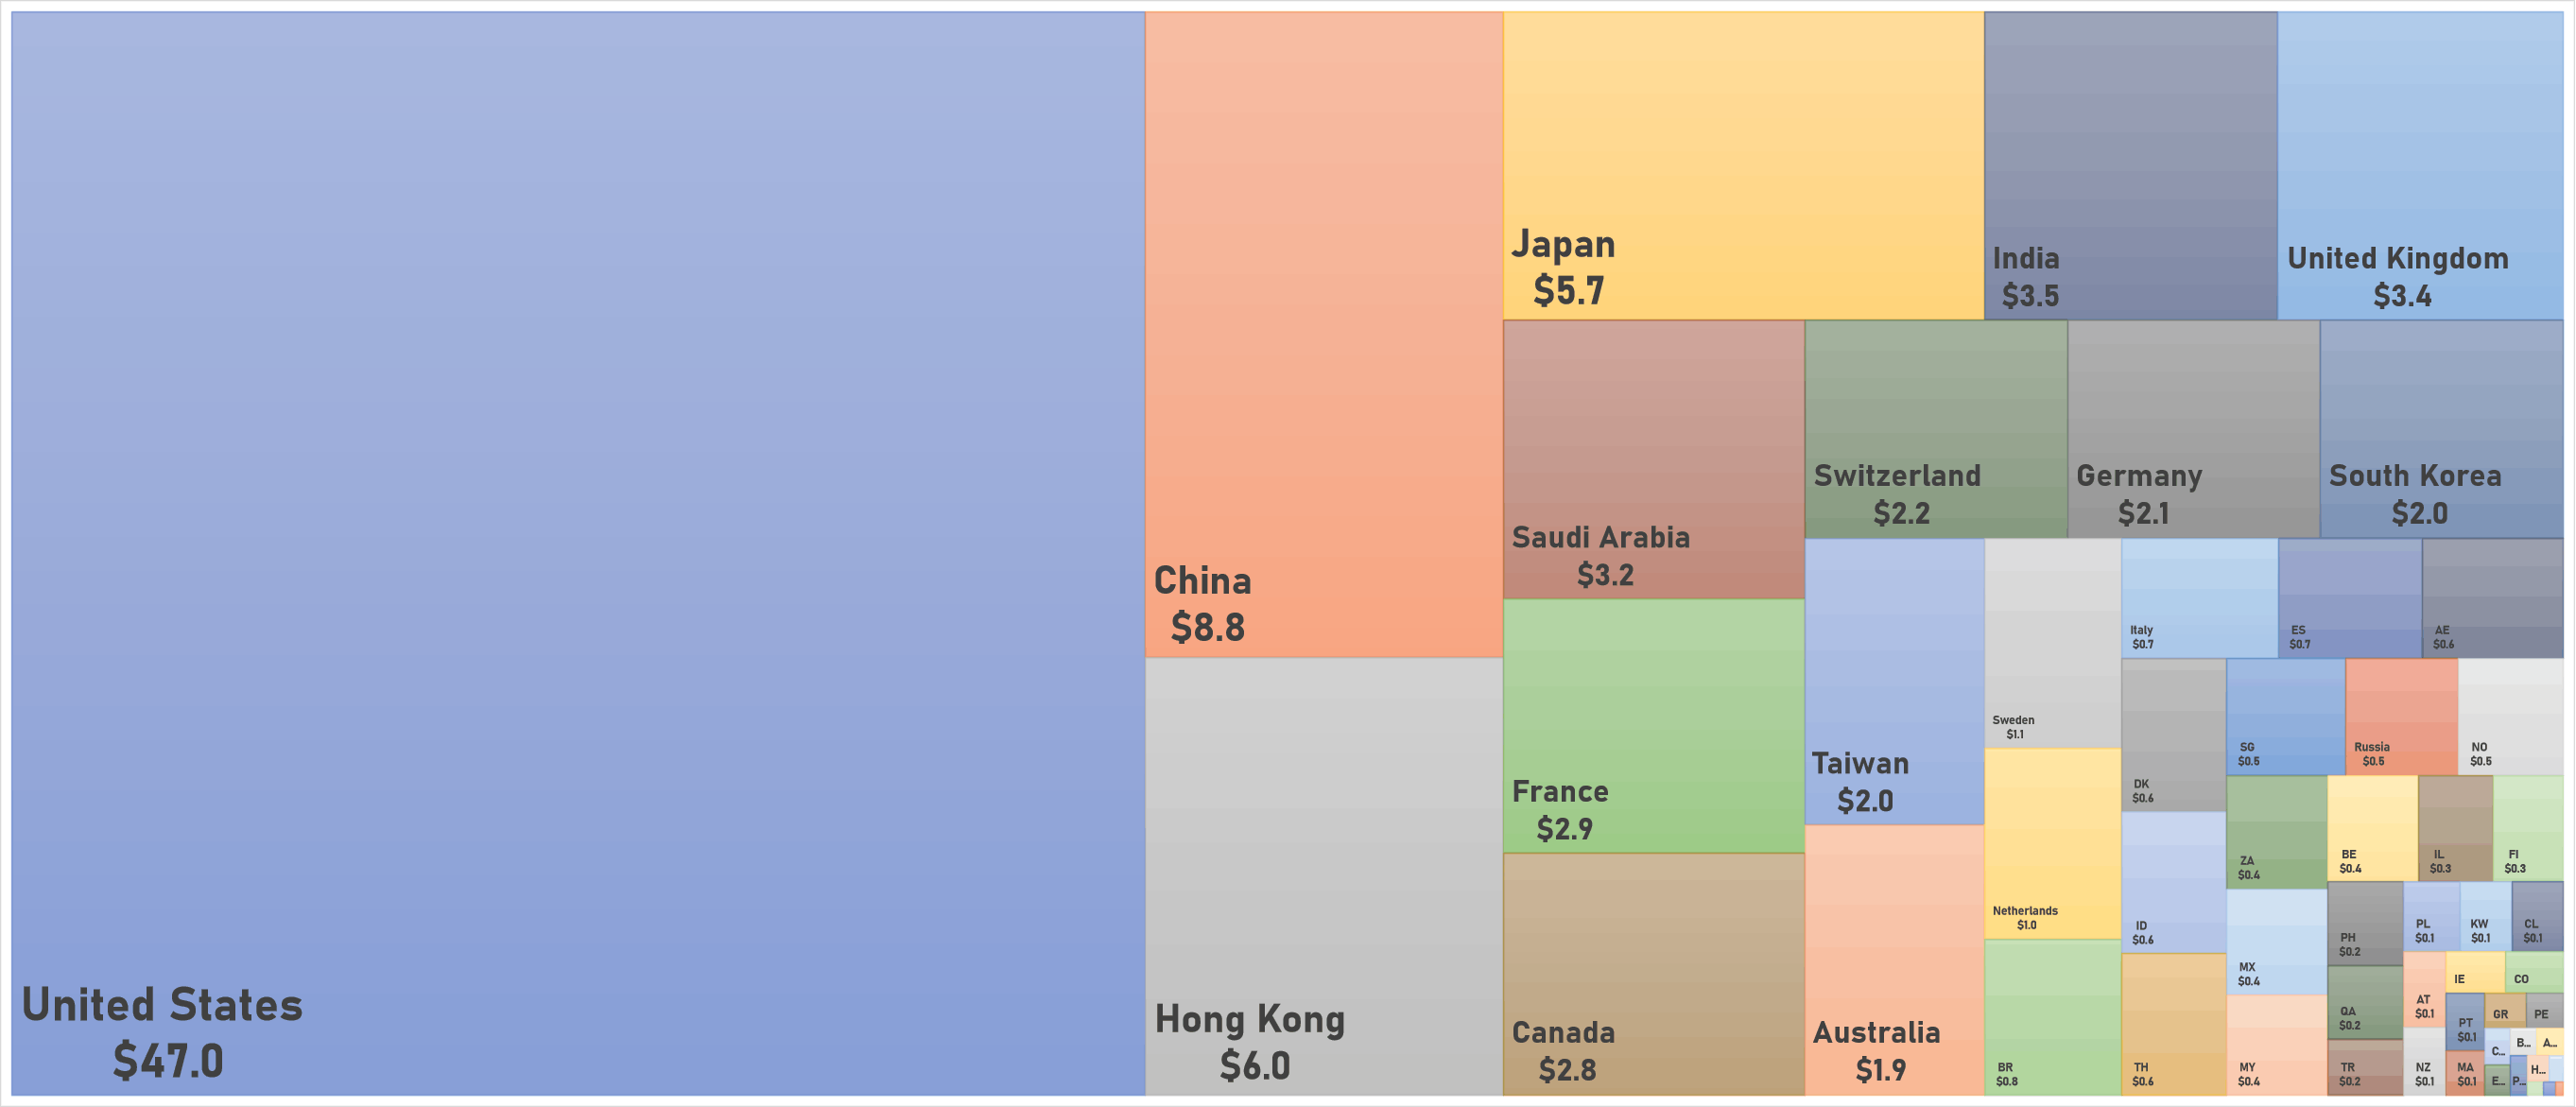
WORLD MARKET CAP BY COUNTRY (US$ trillion)
MAPPING YTD TOTAL RETURNS