Equities
Sharp Drops Across US Markets On Friday, As Nasdaq Composite Ends Rough Month Down 14.6%, S&P 500 Down 10.2%
Technology stocks in Honk Kong bounced nearly 12% this week, but HK and Mainland markets remain deeply in the red year to date, down 10.4% and 26.0% respectively (gross total returns)
Published ET
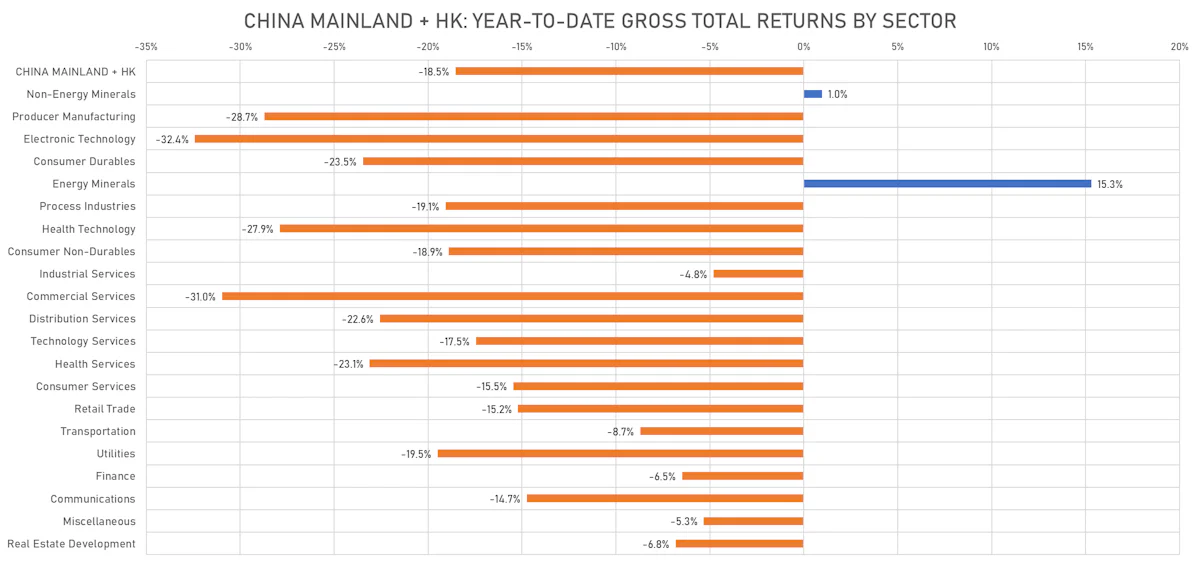
Chinese Equities Year-To-Date | Sources: ϕpost, FactSet data
QUICK SUMMARY
- Daily performance of US indices: S&P 500 down -3.63%; Nasdaq Composite down -4.17%; Wilshire 5000 down -3.58%
- 2.8% of S&P 500 stocks were up today, with 34.3% of stocks above their 200-day moving average (DMA) and 26.9% above their 50-DMA
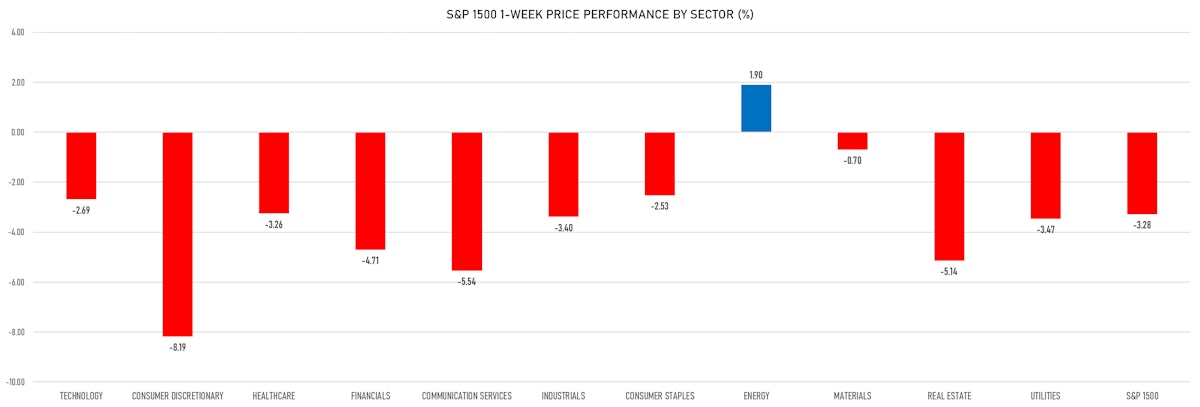
- Top performing sectors in the S&P 500: materials down -1.97% and energy down -2.47%
- Bottom performing sectors in the S&P 500: consumer discretionary down -5.92% and real estate down -4.90%
- The number of shares in the S&P 500 traded today was 930m for a total turnover of US$ 110 bn
- The S&P 500 Value Index was down -3.0%, while the S&P 500 Growth Index was down -4.3%; the S&P small caps index was down -2.6% and mid-caps were down -2.7%
- The volume on CME's INX (S&P 500 Index) was 2.8m (3-month z-score: 0.6); the 3-month average volume is 2.6m and the 12-month range is 1.3 - 4.6m
- Daily performance of international indices: Europe Stoxx 600 up 0.74%; UK FTSE 100 up 0.47%; Hang Seng SH-SZ-HK 300 Index up 3.98%; Japan's TOPIX 500 up 2.05%
VOLATILITY
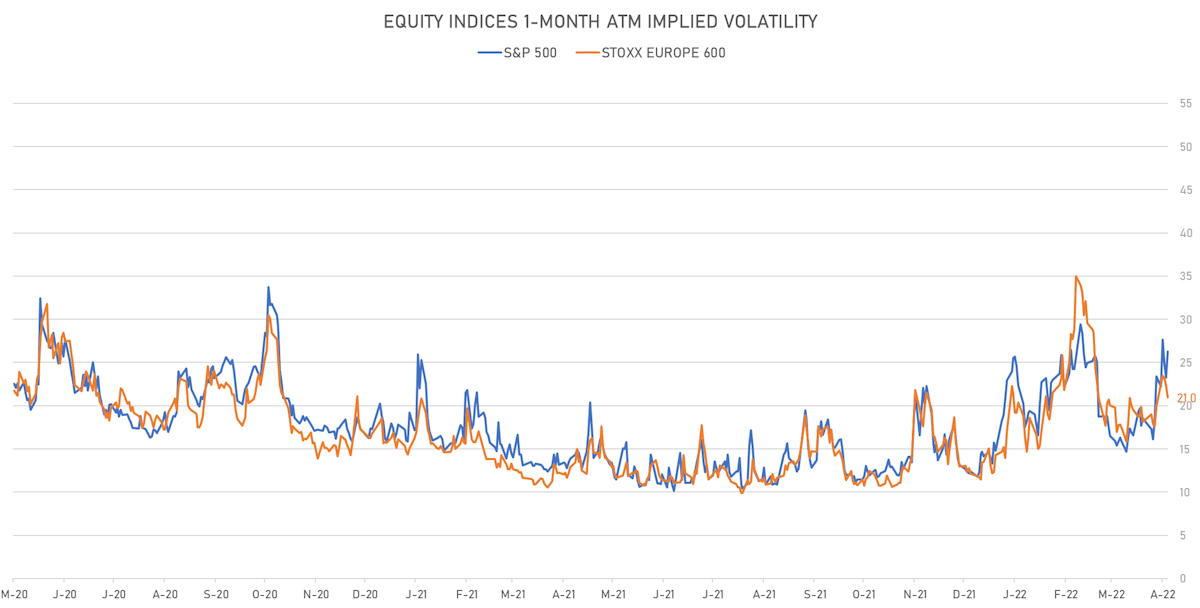
- 1-month at-the-money implied volatility on the S&P 500 at 26.3%, up from 23.3%
- 1-month at-the-money implied volatility on the Europe Stoxx 600 at 21.0%, down from 22.3%
TOP WINNERS
- Full Truck Alliance Co Ltd (YMM), up 20.6% to $6.03 / YTD price return: -28.0% / 12-Month Price Range: $ 4.12-22.80 / Short interest (% of float): 3.0%; days to cover: 2.6
- Hello Group Inc (MOMO), up 17.4% to $5.32 / YTD price return: -33.1% / 12-Month Price Range: $ 3.96-14.45
- Forge Global Holdings Inc (FRGE), up 15.9% to $18.90 / YTD price return: +92.1% / 12-Month Price Range: $ 9.10-47.50 / Short interest (% of float): 0.1%; days to cover: 0.1
- Nutex Health Inc (NUTX), up 15.7% to $9.42 / YTD price return: +128.6% / 12-Month Price Range: $ 1.86-52.80
- Pinduoduo Inc (PDD), up 13.5% to $43.09 / YTD price return: -26.1% / 12-Month Price Range: $ 23.21-143.11
- ProShares UltraPro Short QQQ (SQQQ), up 13.1% to $49.03 / YTD price return: +65.1% / 12-Month Price Range: $ 28.15-65.85 / Short interest (% of float): 10.3%; days to cover: 0.1
- Kanzhun Ltd (BZ), up 12.9% to $23.53 / YTD price return: -32.5% / 12-Month Price Range: $ 13.46-44.96
- Lantheus Holdings Inc (LNTH), up 12.3% to $66.41 / YTD price return: +129.9% / 12-Month Price Range: $ 19.30-64.14 / Short interest (% of float): 3.3%; days to cover: 1.6
- TAL Education Group (TAL), up 11.9% to $3.39 / YTD price return: -13.7% / 12-Month Price Range: $ 1.60-62.18 / Short interest (% of float): 5.6%; days to cover: 2.1
- ProShares Ultra VIX Short-Term Futures ETF (UVXY), up 11.7% to $18.27 / YTD price return: +47.0% / 12-Month Price Range: $ 11.16-63.10 / Short interest (% of float): 17.6%; days to cover: 0.2 (the stock is currently on the short sale restriction list)
BIGGEST LOSERS
- B Riley Financial Inc (RILY), down 15.8% to $45.16 / YTD price return: -49.2% / 12-Month Price Range: $ 51.22-91.24 / Short interest (% of float): 12.0%; days to cover: 9.2 (the stock is currently on the short sale restriction list)
- Swvl Holdings Corp (SWVL), down 14.9% to $8.59 / YTD price return: -13.2% / 12-Month Price Range: $ 4.17-11.40 / Short interest (% of float): 0.7%; days to cover: 0.6 (the stock is currently on the short sale restriction list)
- Verisign Inc (VRSN), down 14.3% to $178.69 / YTD price return: -29.6% / 12-Month Price Range: $ 198.53-257.03 / Short interest (% of float): 1.0%; days to cover: 1.8 (the stock is currently on the short sale restriction list)
- Amazon.com Inc (AMZN), down 14.0% to $2,485.63 / YTD price return: -25.5% / 12-Month Price Range: $ 2,671.45-3,773.08 (the stock is currently on the short sale restriction list)
- Atlassian Corporation PLC (TEAM), down 13.5% to $224.83 / YTD price return: -41.0% / 12-Month Price Range: $ 207.83-483.13 / Short interest (% of float): 1.7%; days to cover: 1.2 (the stock is currently on the short sale restriction list)
- SoundHound AI Inc (SOUN), down 13.3% to $6.50 / 12-Month Price Range: $ 7.34-10.80 (the stock is currently on the short sale restriction list)
- ProShares UltraPro QQQ (TQQQ), down 13.1% to $36.53 / YTD price return: -56.1% / 12-Month Price Range: $ 37.37-91.68 / Short interest (% of float): 3.2%; days to cover: 0.1 (the stock is currently on the short sale restriction list)
- Direxion Daily Semiconductor Bull 3X Shares (SOXL), down 13.1% to $22.24 / YTD price return: -67.3% / 12-Month Price Range: $ 21.48-74.21 / Short interest (% of float): 1.2%; days to cover: 0.1 (the stock is currently on the short sale restriction list)
- Century Aluminum Co (CENX), down 12.7% to $16.87 / YTD price return: +1.9% / 12-Month Price Range: $ 10.39-30.36 / Short interest (% of float): 9.0%; days to cover: 2.2 (the stock is currently on the short sale restriction list)
- Western Union Co (WU), down 12.6% to $16.76 / YTD price return: -6.1% / 12-Month Price Range: $ 15.69-26.49 (the stock is currently on the short sale restriction list)
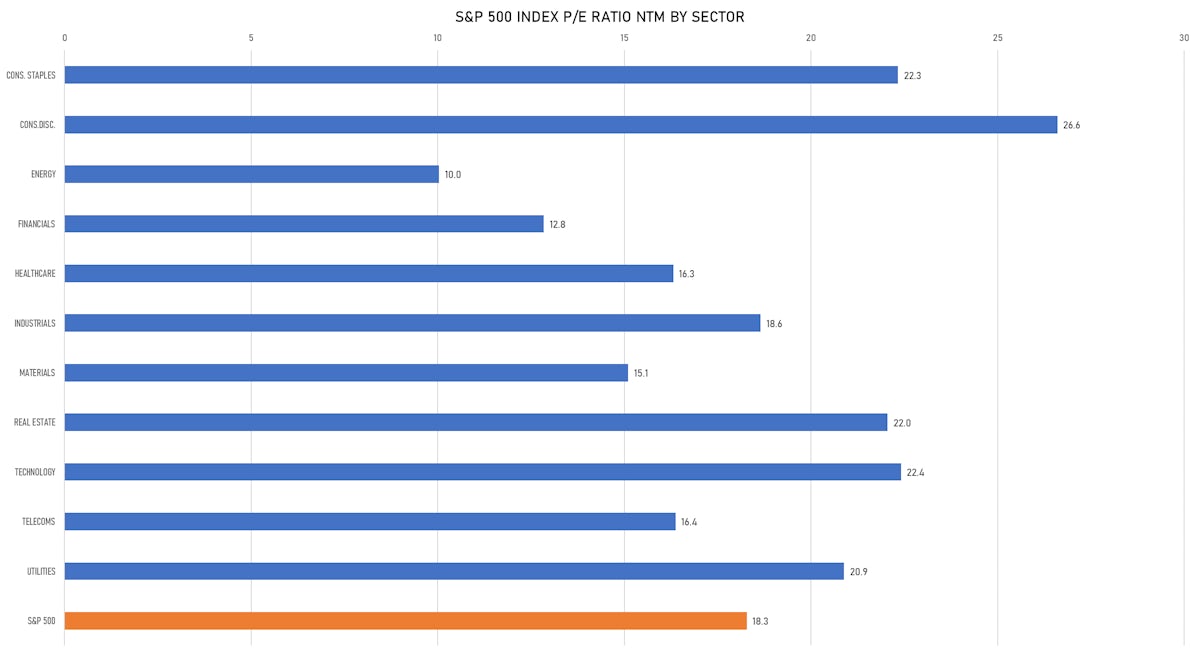
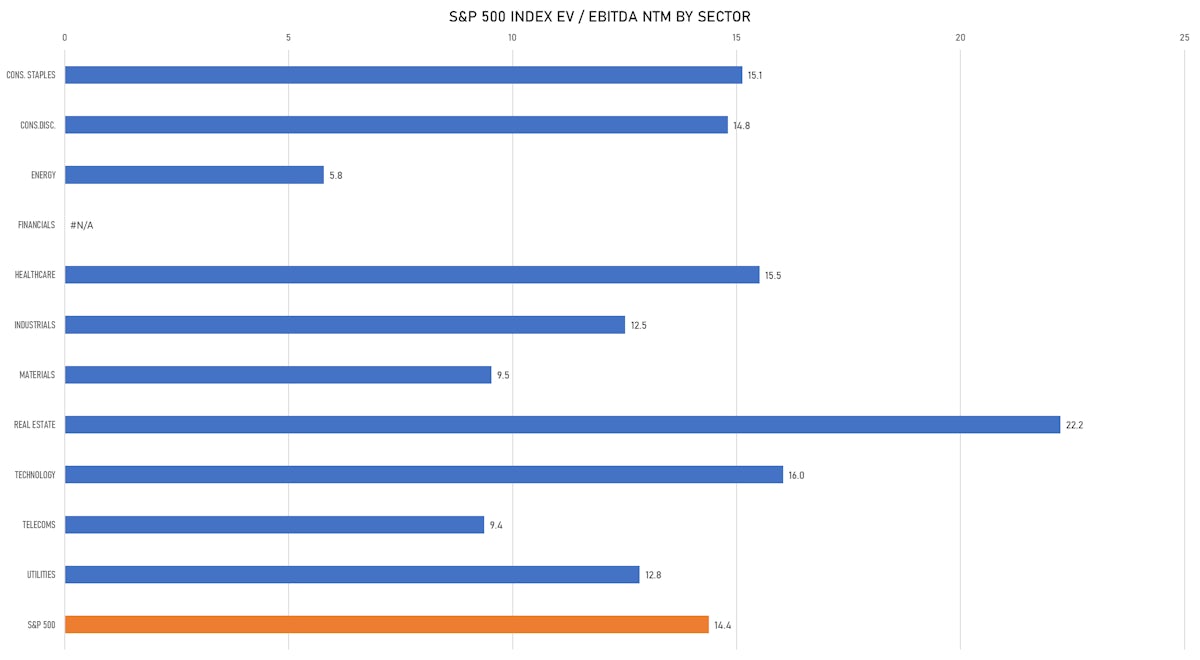
VALUATION MULTIPLES BY SECTORS
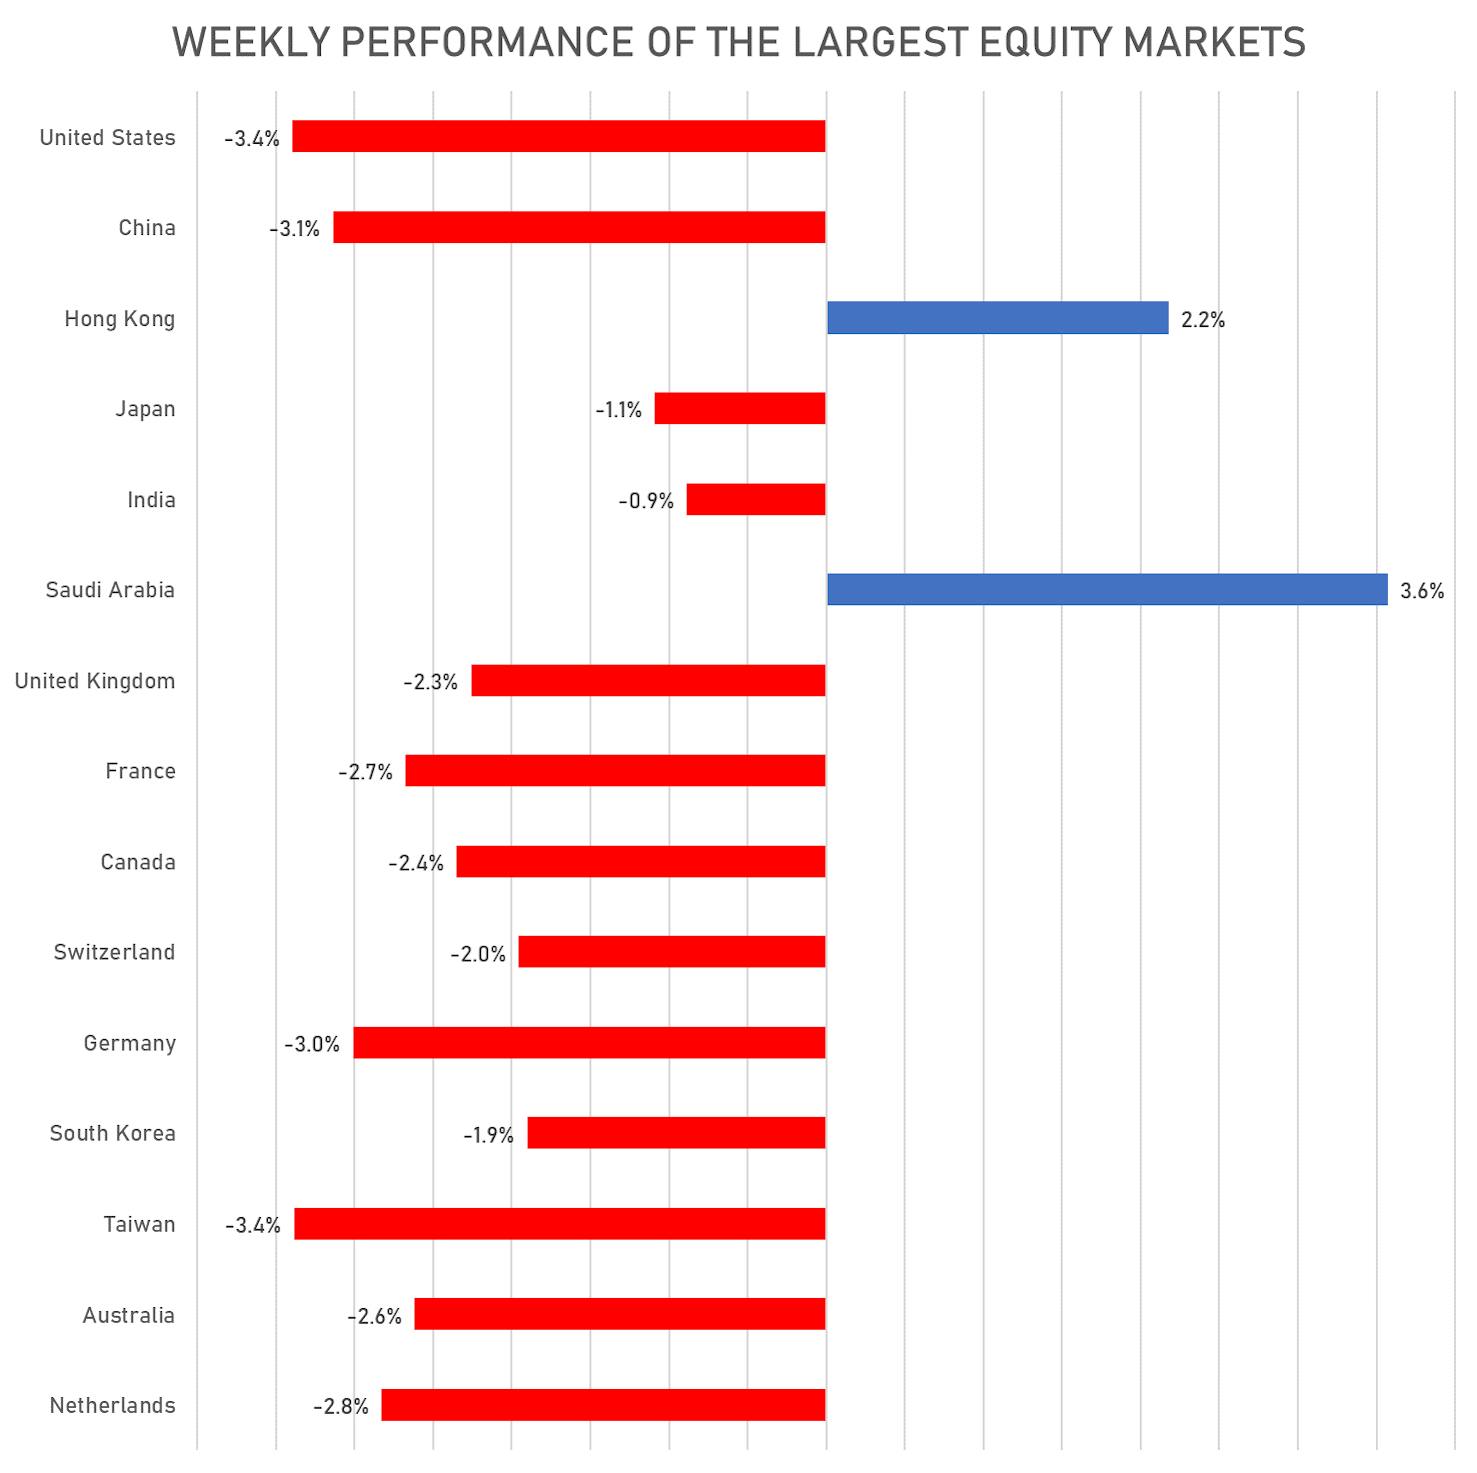
WEEKLY TOTAL RETURNS OF MAJOR GLOBAL EQUITY MARKETS
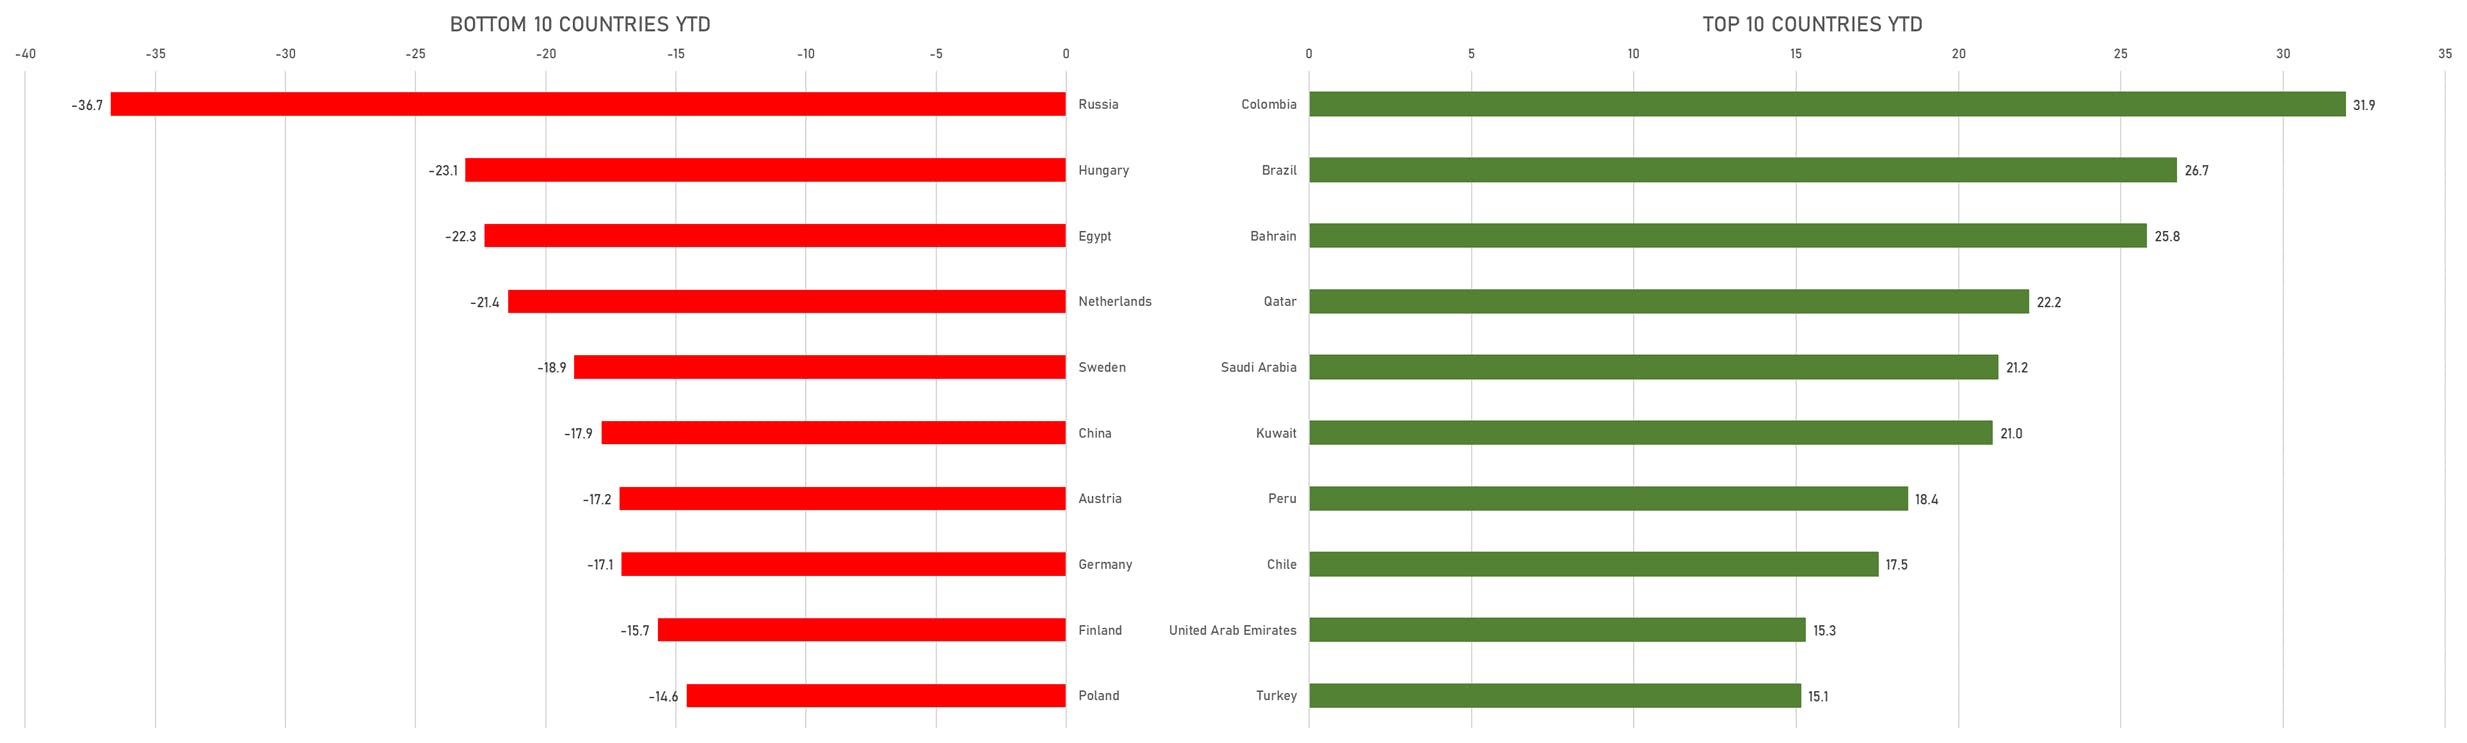
TOP / BOTTOM PERFORMING WORLD MARKETS YTD
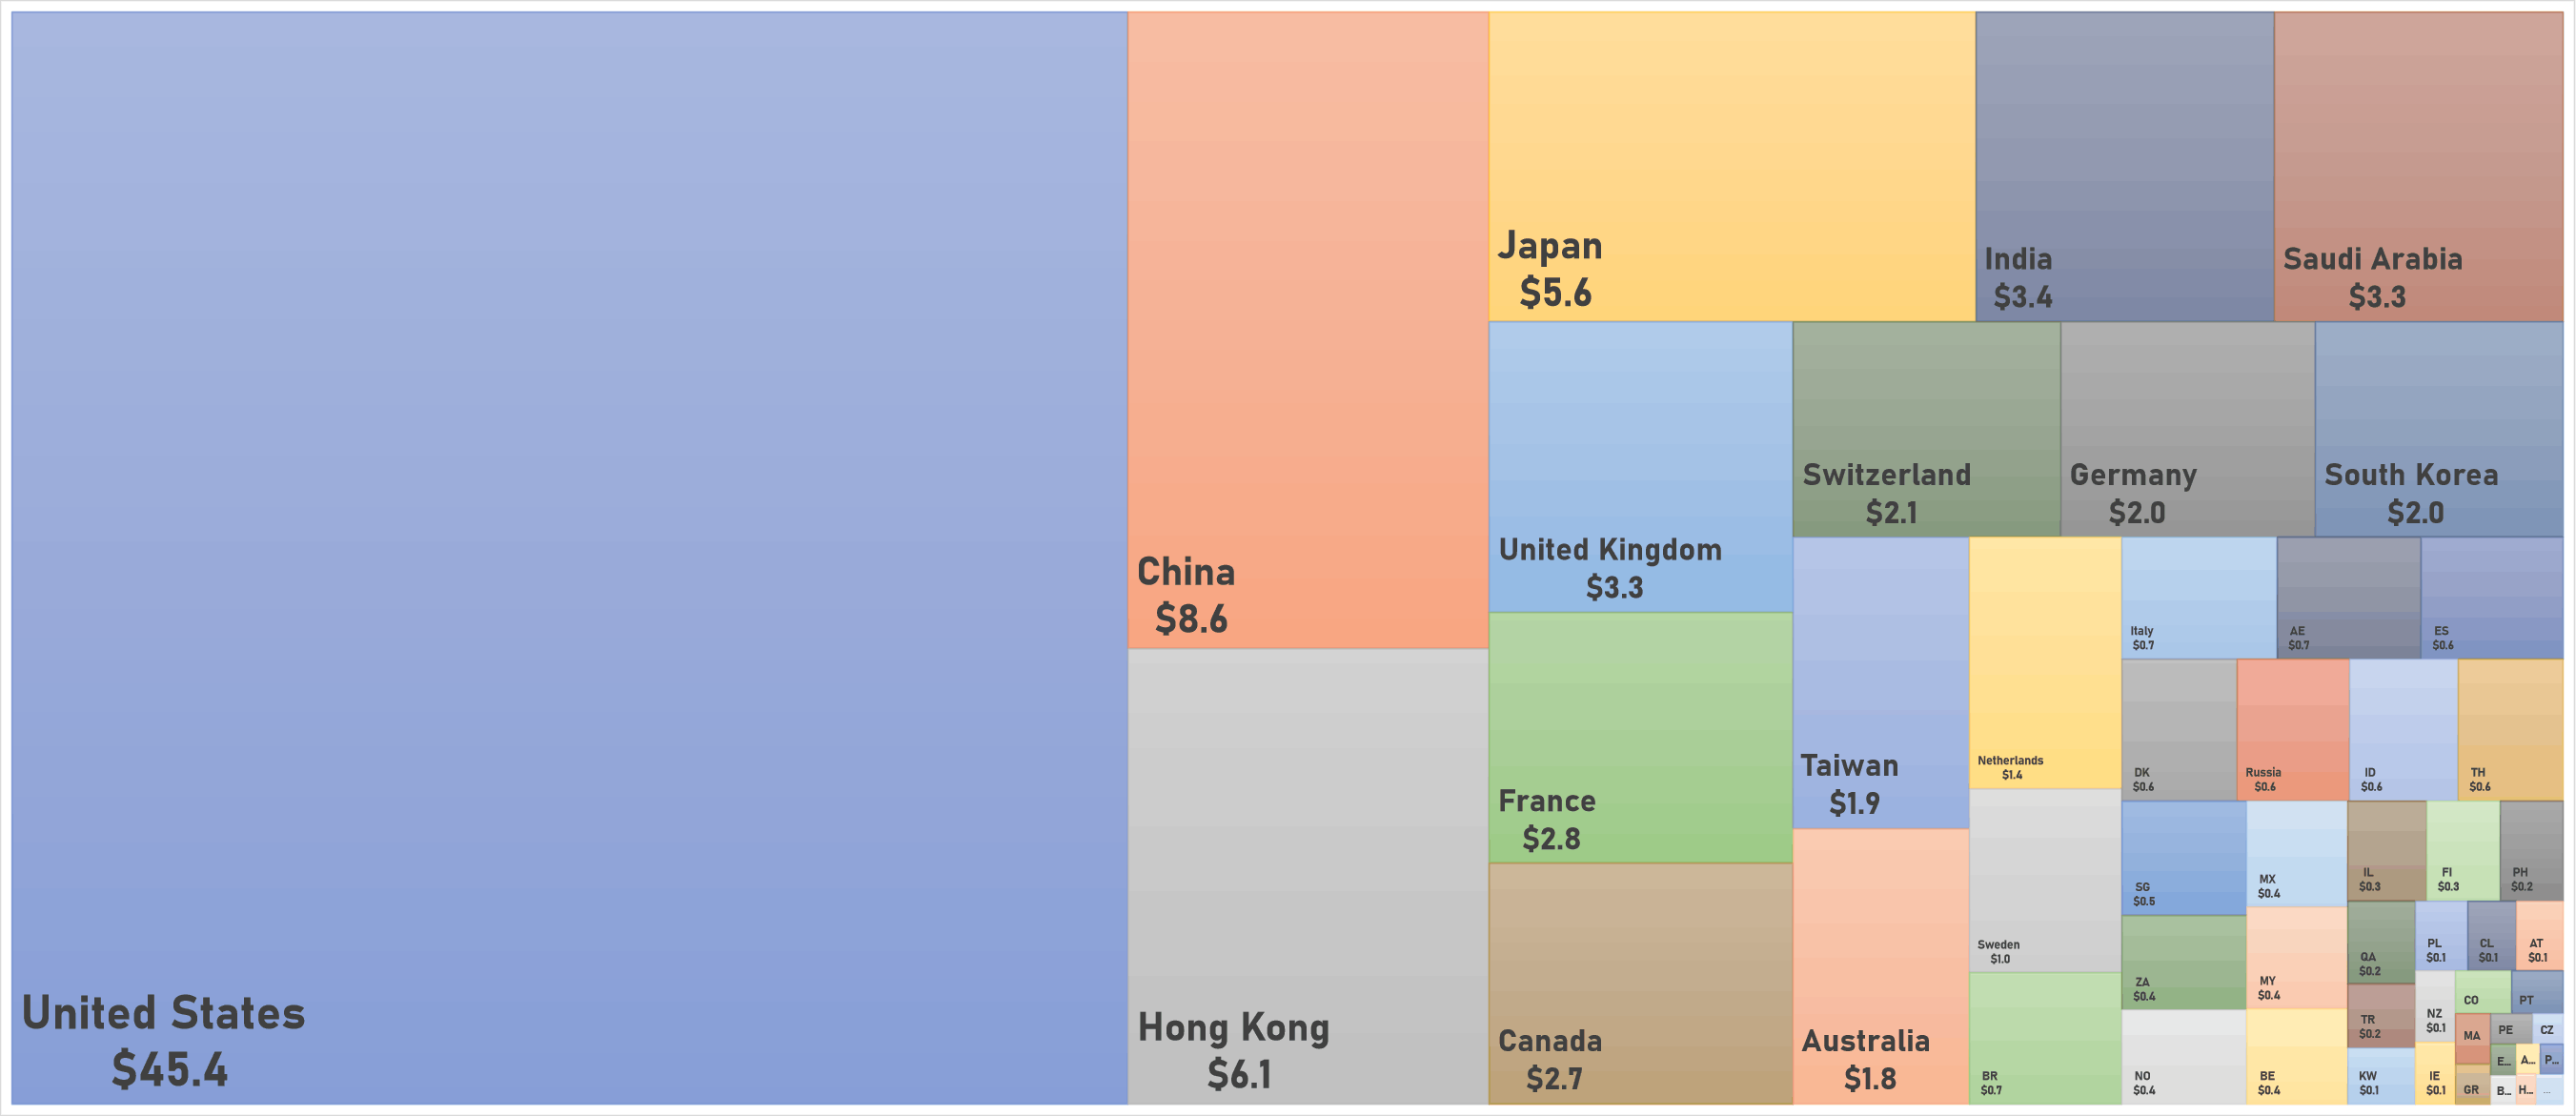
WORLD MARKET CAPITALIZATION (US$ Trillion)