Equities
Higher Real Yields Brought Extensive Losses To US Equities After The FOMC, Leaving Just 27% Of S&P 500 Stocks Above Their 50 DMA
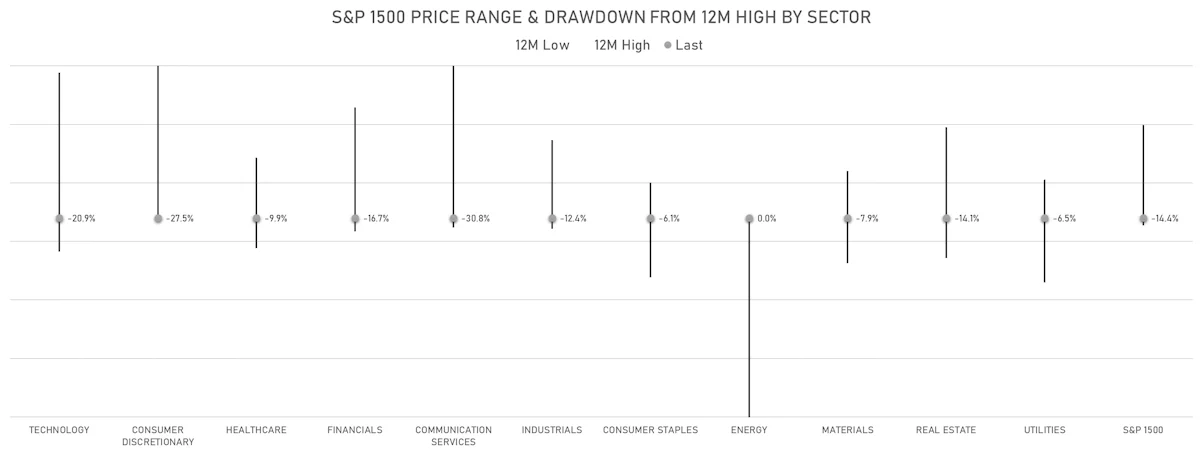
In line with other risky assets, equities continue to trade very poorly: energy is the only sector now at a 12-month high, with communication services and consumer discretionary both down close to 30% from their 12M high
Published ET
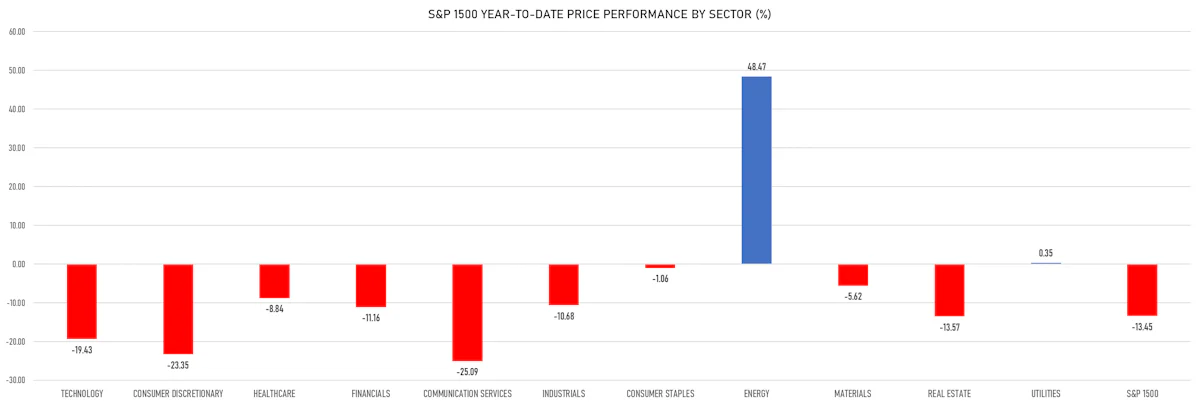
S&P 1500 Price Performance By Sector YTD (%) | Sources: ϕpost, Refinitiv data
QUICK SUMMARY
- Daily performance of US indices: S&P 500 down -0.57%; Nasdaq Composite down -1.40%; Wilshire 5000 down -0.88%
- 30.3% of S&P 500 stocks were up today, with 34.5% of stocks above their 200-day moving average (DMA) and 27.5% above their 50-DMA
- Top performing sectors in the S&P 500: energy up 2.91% and utilities up 0.80%
- Bottom performing sectors in the S&P 500: materials down -1.36% and consumer discretionary down -1.31%
- The number of shares in the S&P 500 traded today was 717m for a total turnover of US$ 81 bn
- The S&P 500 Value Index was down -0.3%, while the S&P 500 Growth Index was down -0.9%; the S&P small caps index was down -1.1% and mid-caps were down -1.3%
- The volume on CME's INX (S&P 500 Index) was 2.7m (3-month z-score: 0.3); the 3-month average volume is 2.6m and the 12-month range is 1.3 - 4.6m
- Daily performance of international indices: Europe Stoxx 600 down -1.91%; UK FTSE 100 down -1.54%; Hang Seng SH-SZ-HK 300 Index down -3.02%; Japan's TOPIX 500 up 0.96%
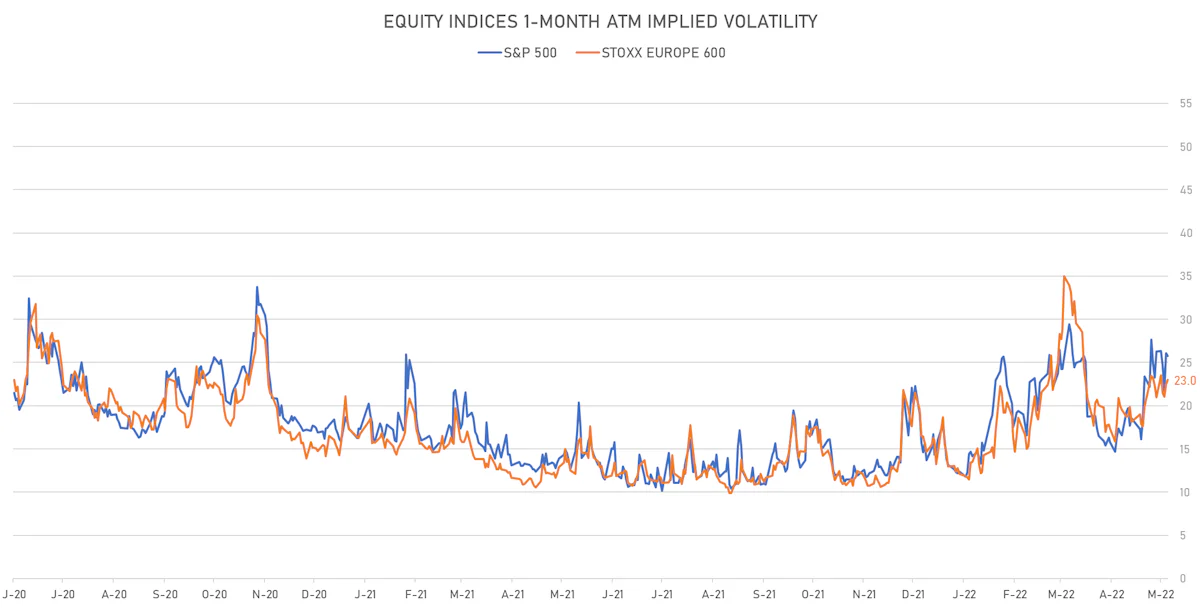
VOLATILITY
- 1-month at-the-money implied volatility on the S&P 500 at 25.8%, down from 26.1%
- 1-month at-the-money implied volatility on the Europe Stoxx 600 at 23.0%, up from 22.5%
TOP WINNERS TODAY
- Funko Inc (FNKO), up 26.9% to $21.22 / YTD price return: +12.9% / 12-Month Price Range: $ 15.28-27.20 / Short interest (% of float): 4.9%; days to cover: 2.1
- Forge Global Holdings Inc (FRGE), up 20.7% to $32.58 / 12-Month Price Range: $ 9.10-47.50 / Short interest (% of float): 0.1%; days to cover: 0.1 (the stock is currently on the short sale restriction list)
- Radius Global Infrastructure Inc (RADI), up 17.7% to $14.71 / 12-Month Price Range: $ 11.70-18.79 / Short interest (% of float): 7.2%; days to cover: 7.0
- Bellring Brands Inc (BRBR), up 17.1% to $24.42 / YTD price return: -14.4% / 12-Month Price Range: $ 20.36-34.19 / Short interest (% of float): 2.6%; days to cover: 1.5
- Udemy Inc (UDMY), up 16.7% to $12.54 / YTD price return: -35.8% / 12-Month Price Range: $ 9.66-32.62 / Short interest (% of float): 1.6%; days to cover: 6.7
- Cazoo Group Ltd (CZOO), up 15.8% to $1.32 / 12-Month Price Range: $ 1.06-10.13 / Short interest (% of float): 2.5%; days to cover: 9.5 (the stock is currently on the short sale restriction list)
- Grid Dynamics Holdings Inc (GDYN), up 15.6% to $17.39 / 12-Month Price Range: $ 9.09-42.81 / Short interest (% of float): 5.1%; days to cover: 1.5
- Stem Inc (STEM), up 15.1% to $8.79 / 12-Month Price Range: $ 7.01-37.79 / Short interest (% of float): 9.6%; days to cover: #N/A (the stock is currently on the short sale restriction list)
- Unum Group (UNM), up 13.8% to $36.31 / YTD price return: +47.8% / 12-Month Price Range: $ 22.25-34.28 / Short interest (% of float): 2.7%; days to cover: 2.3
- Maravai LifeSciences Holdings Inc (MRVI), up 13.4% to $32.37 / YTD price return: -22.7% / 12-Month Price Range: $ 23.16-63.55 / Short interest (% of float): 4.5%; days to cover: 2.8
BIGGEST LOSERS TODAY
- Under Armour Inc (UA), down 25.9% to $9.85 / YTD price return: -45.5% / 12-Month Price Range: $ 12.61-23.00 / Short interest (% of float): 5.1%; days to cover: 3.2 (the stock is currently on the short sale restriction list)
- Under Armour Inc (UAA), down 23.8% to $10.89 / YTD price return: -48.6% / 12-Month Price Range: $ 13.70-27.28 (the stock is currently on the short sale restriction list)
- Guardant Health Inc (GH), down 22.5% to $39.32 / YTD price return: -60.7% / 12-Month Price Range: $ 46.87-137.84 (the stock is currently on the short sale restriction list)
- Bill.com Holdings Inc (BILL), down 20.5% to $121.00 / YTD price return: -51.4% / 12-Month Price Range: $ 128.00-348.50 (the stock is currently on the short sale restriction list)
- Bloom Energy Corp (BE), down 20.2% to $15.13 / YTD price return: -31.0% / 12-Month Price Range: $ 12.55-37.01 (the stock is currently on the short sale restriction list)
- Zai Lab Ltd (ZLAB), down 20.2% to $28.55 / YTD price return: -54.6% / 12-Month Price Range: $ 25.74-181.92 / Short interest (% of float): 4.2%; days to cover: 2.7 (the stock is currently on the short sale restriction list)
- Remitly Global Inc (RELY), down 20.1% to $8.30 / 12-Month Price Range: $ 7.93-53.65 / Short interest (% of float): 2.4%; days to cover: 2.6 (the stock is currently on the short sale restriction list)
- DISH Network Corp (DISH), down 19.1% to $22.22 / YTD price return: -31.5% / 12-Month Price Range: $ 25.84-47.05 (the stock is currently on the short sale restriction list)
- Axsome Therapeutics Inc (AXSM), down 18.8% to $29.82 / YTD price return: -21.1% / 12-Month Price Range: $ 19.38-74.10 / Short interest (% of float): 14.8%; days to cover: 6.2 (the stock is currently on the short sale restriction list)
- CareDx Inc (CDNA), down 18.6% to $25.78 / YTD price return: -43.3% / 12-Month Price Range: $ 27.87-96.88 / Short interest (% of float): 8.1%; days to cover: 5.7 (the stock is currently on the short sale restriction list)
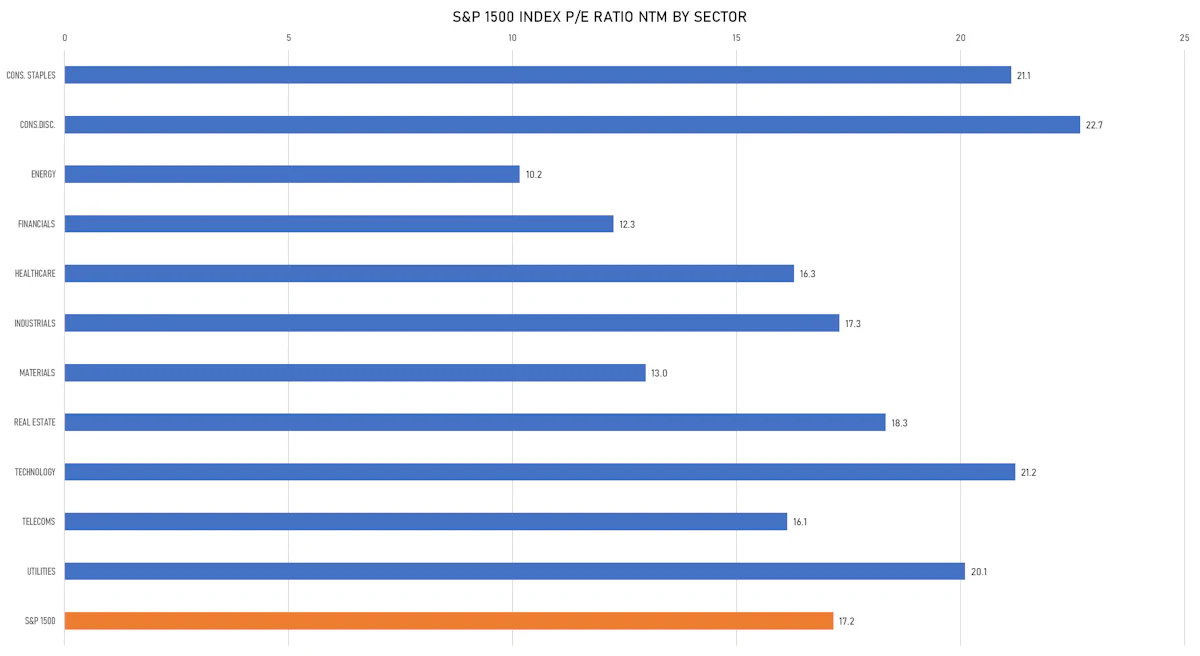
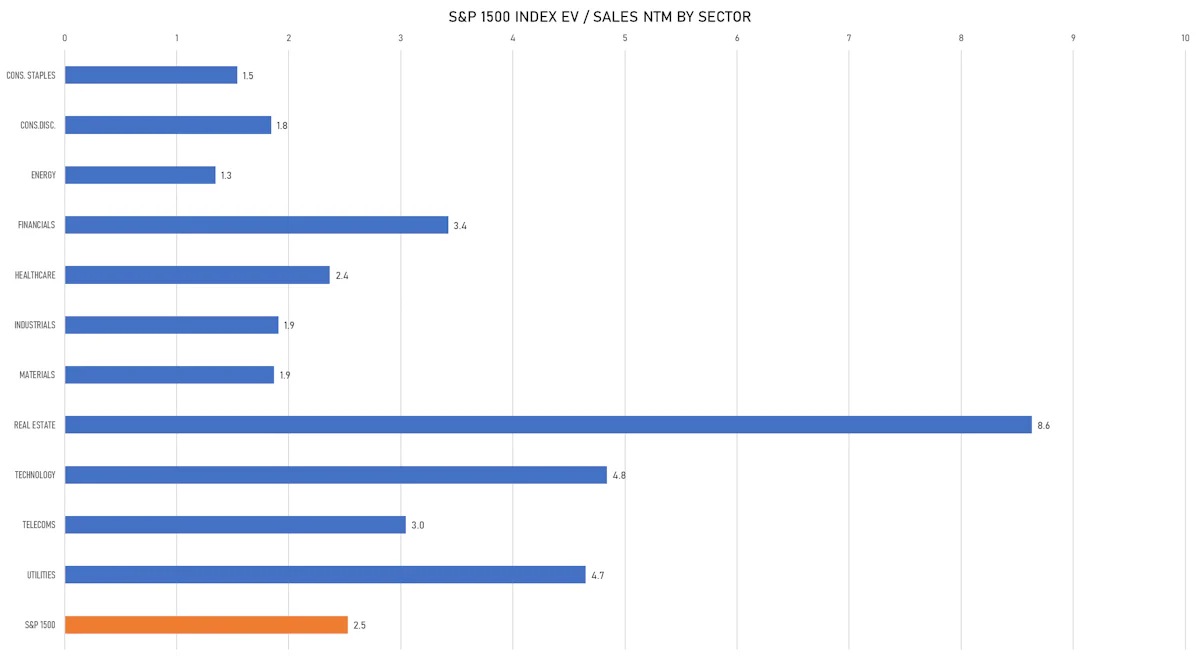
US VALUATION MULTIPLES BY SECTORS
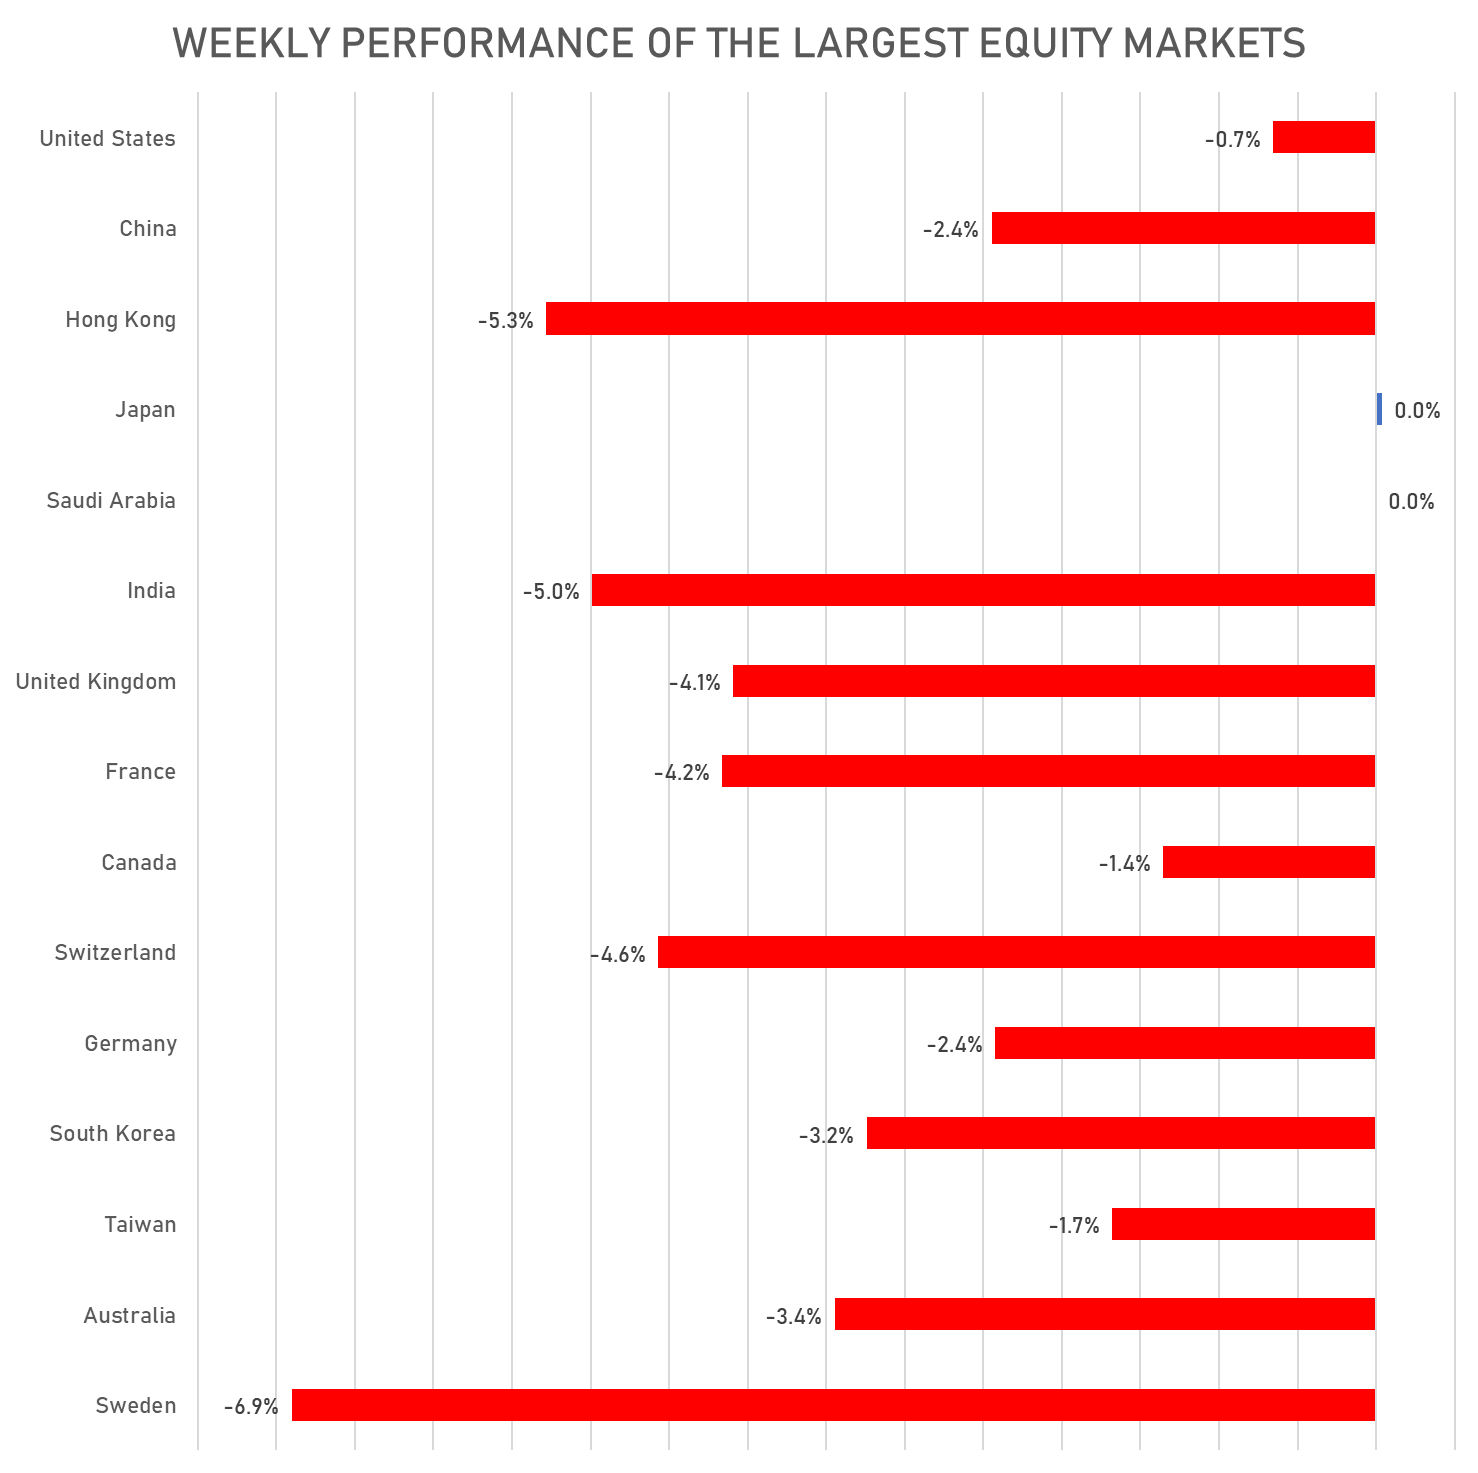
WEEKLY TOTAL RETURNS OF MAJOR GLOBAL EQUITY MARKETS
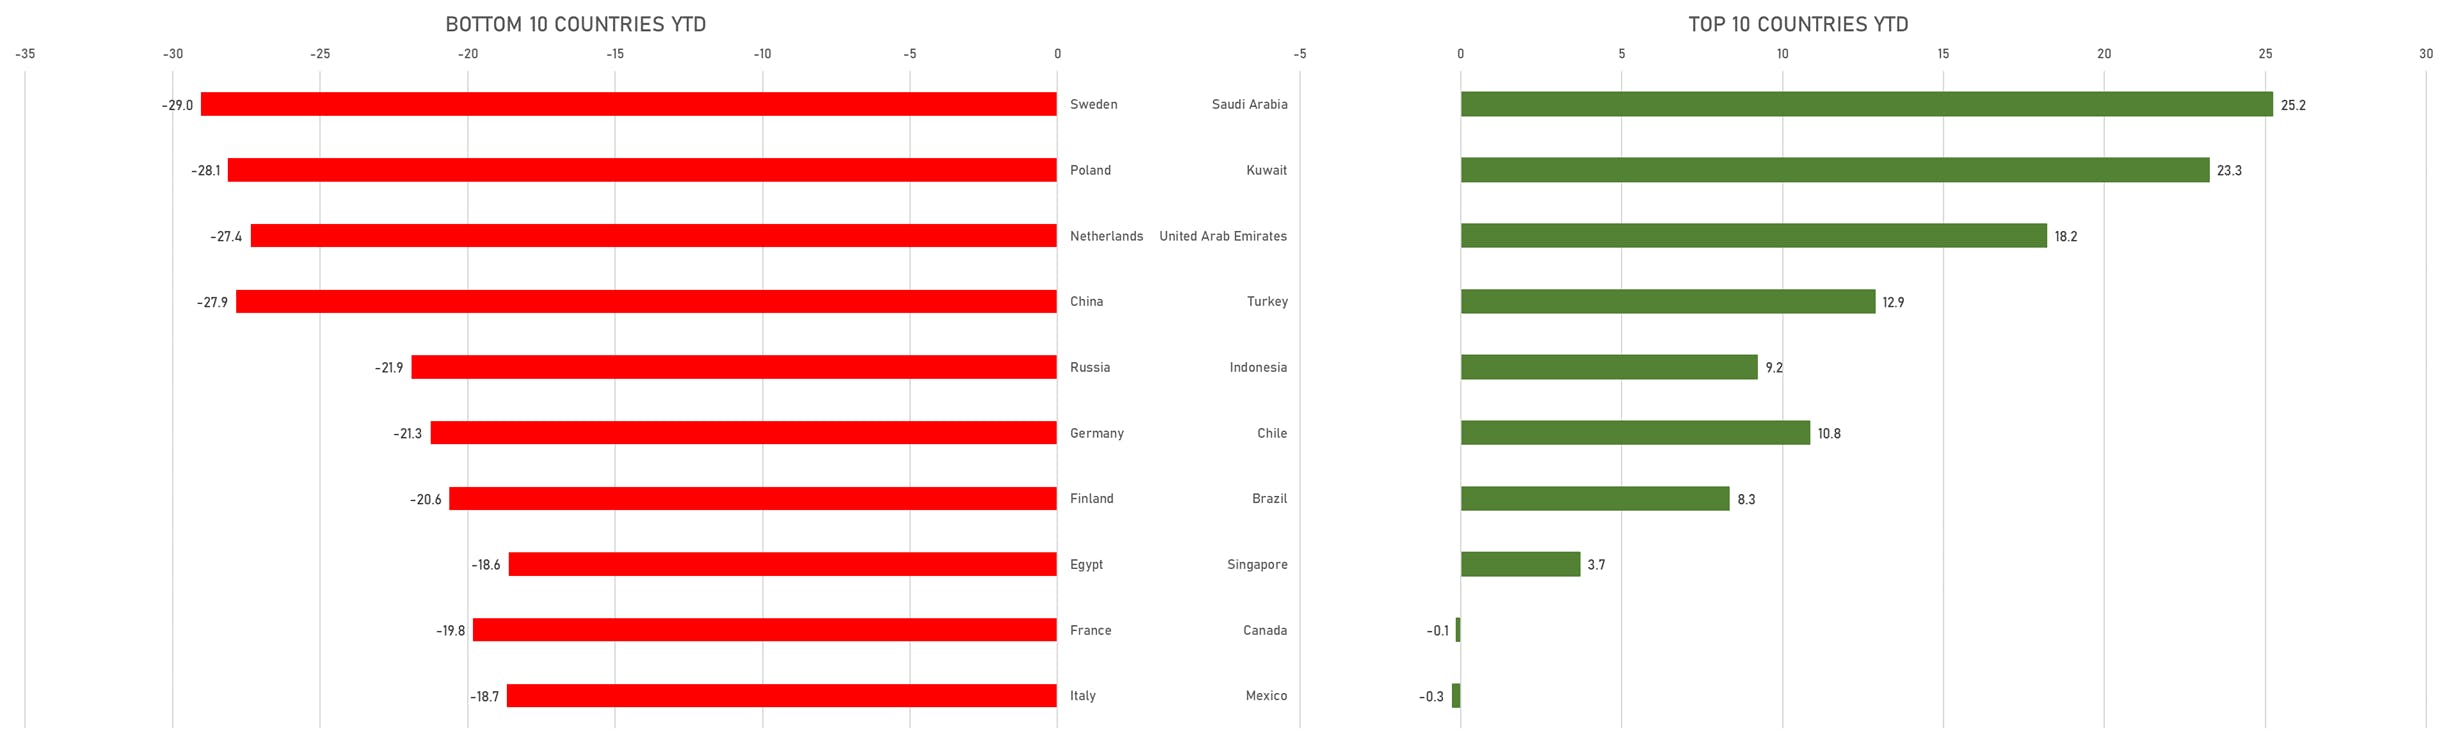
TOP / BOTTOM PERFORMING WORLD MARKETS YTD
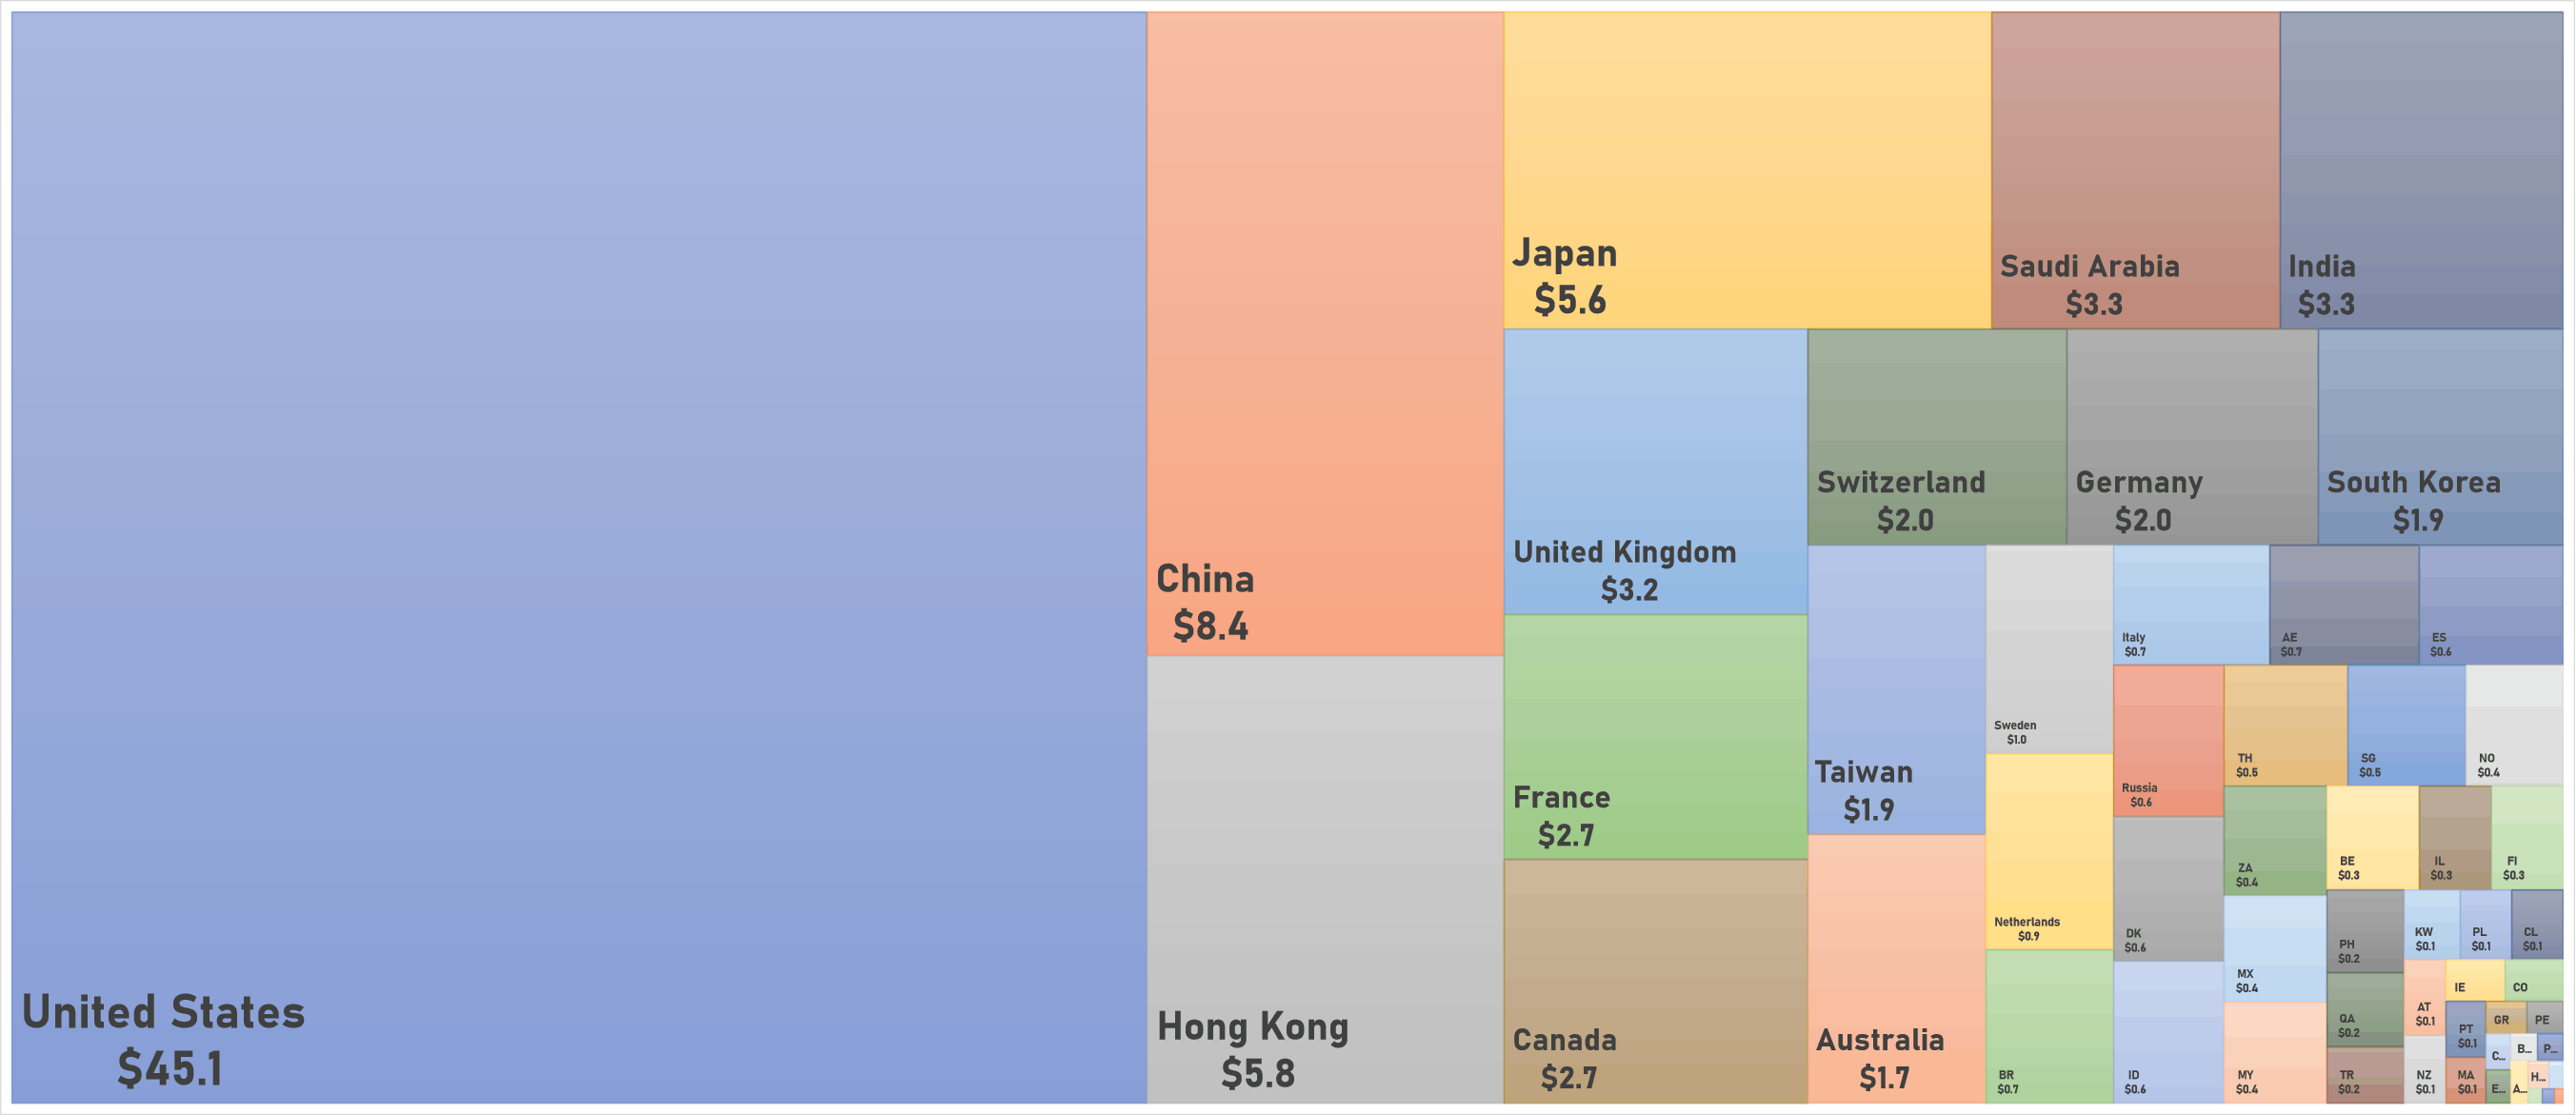
WORLD MARKET CAPITALIZATION (US$ Trillion)
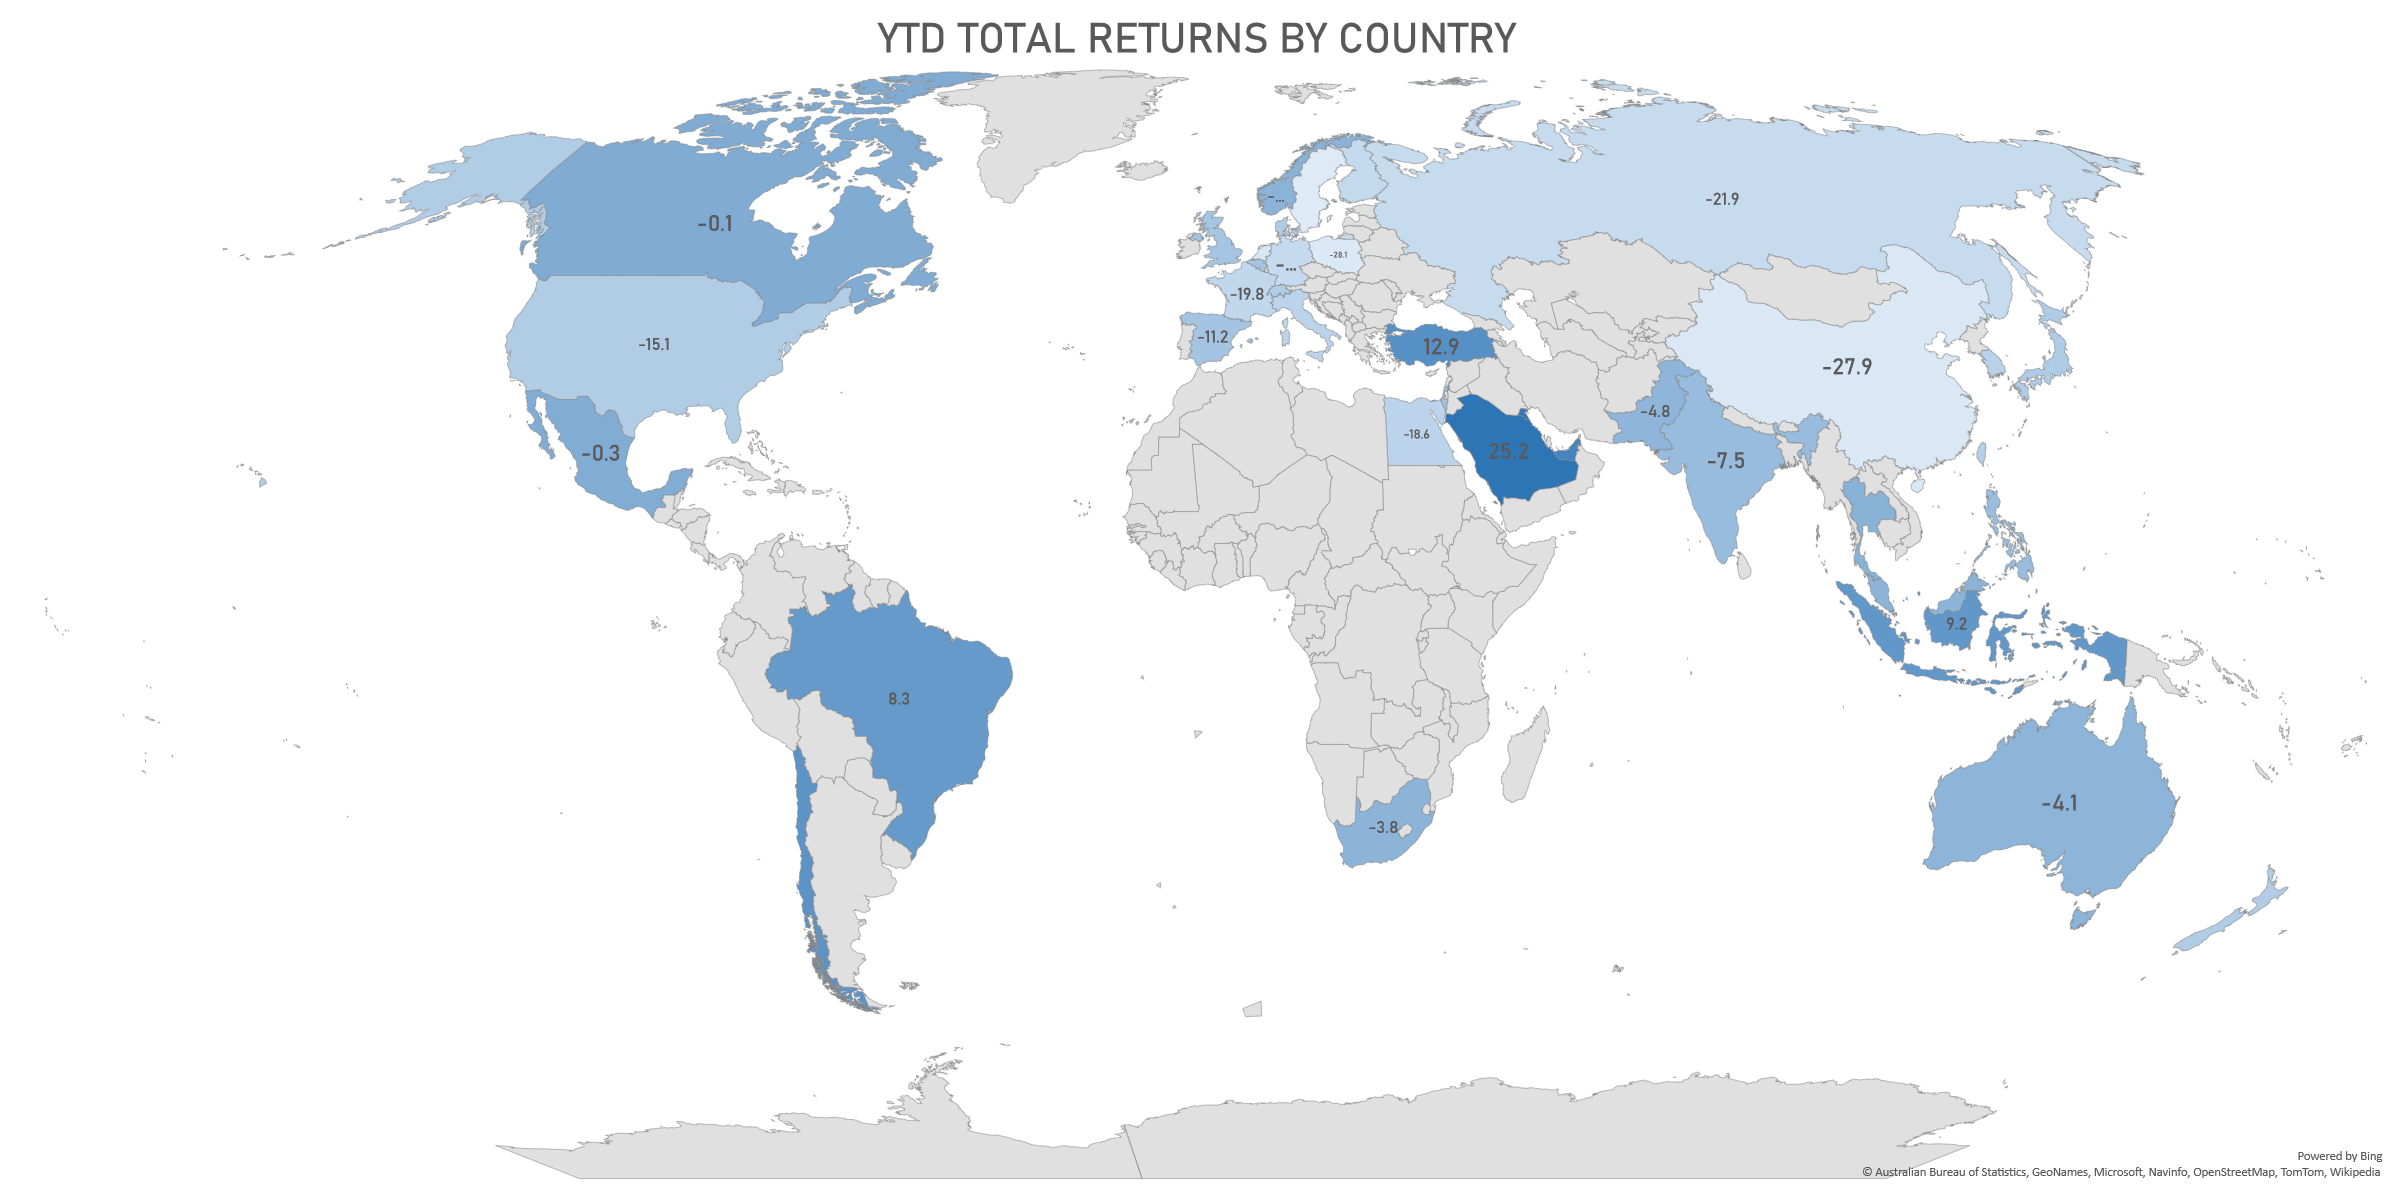
YTD TOTAL RETURNS BY COUNTRY (%)