Equities
Huge Bounce In US Equities Into The Weekend, As Over 92% Of S&P 500 Stocks End Higher on Friday
Despite the return in risk appetite today, it was a rough week for stocks, with Goldman Sachs pointing out that their prime brokerage business saw the largest 5-day reduction ever in gross leverage for fundamental long/short hedge funds
Published ET
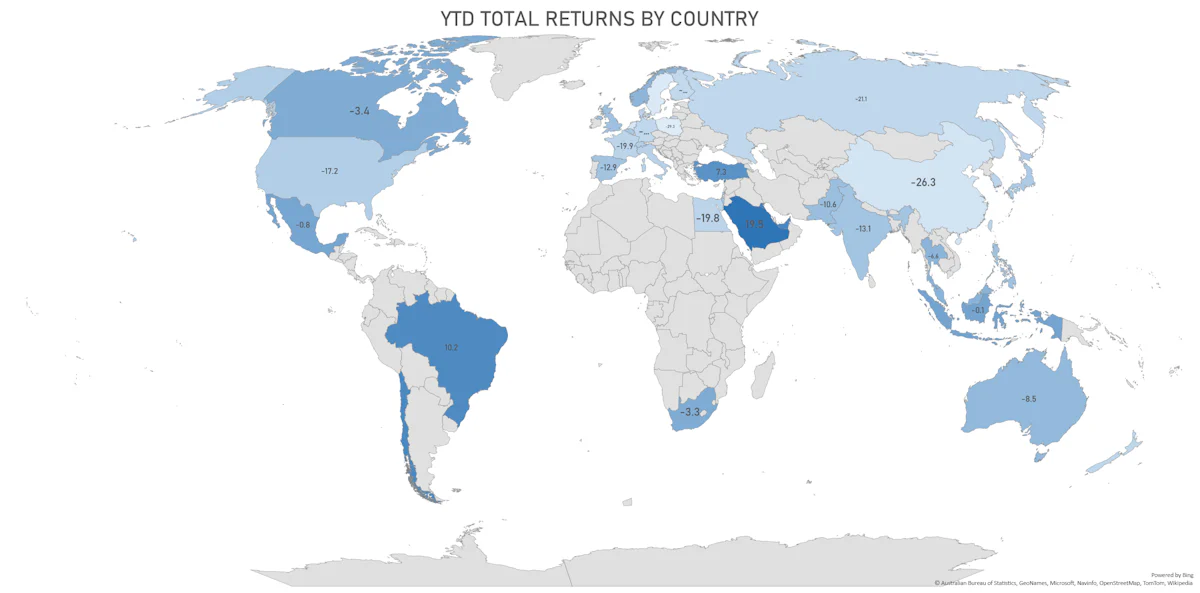
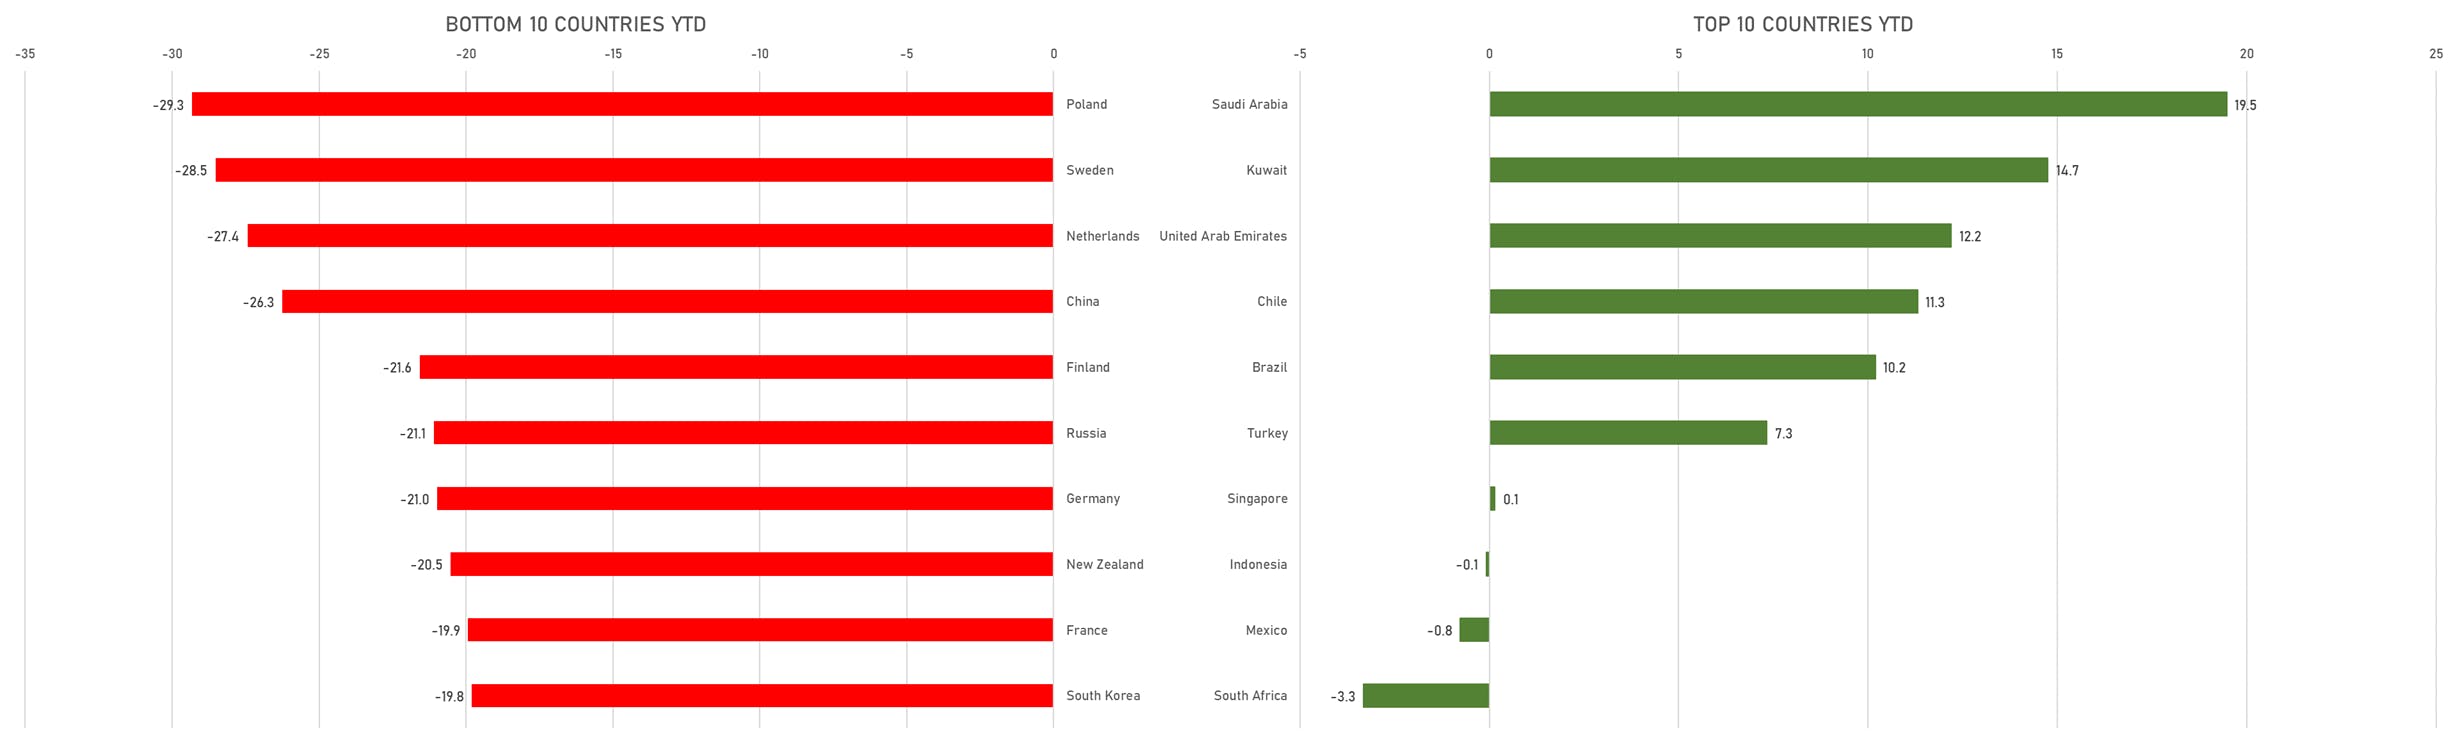
YTD Total Returns By Country (US$), With US Equities Having Worst Annual Start Since 1932 | Sources: ϕpost, Refinitiv data
QUICK SUMMARY
- Daily performance of US indices: S&P 500 up 2.39%; Nasdaq Composite up 3.82%; Wilshire 5000 up 2.74%
- 92.3% of S&P 500 stocks were up today, with 30.9% of stocks above their 200-day moving average (DMA) and 21.4% above their 50-DMA
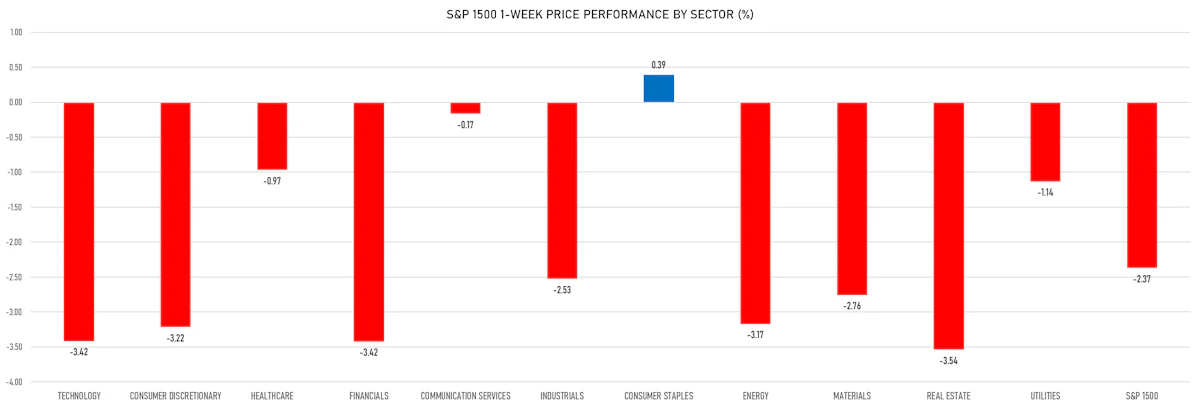
- Top performing sectors in the S&P 500: consumer discretionary up 4.10% and technology up 3.44%
- Bottom performing sectors in the S&P 500: healthcare up 1.05% and utilities up 1.09%
- The number of shares in the S&P 500 traded today was 657m for a total turnover of US$ 73 bn
- The S&P 500 Value Index was up 1.6%, while the S&P 500 Growth Index was up 3.3%; the S&P small caps index was up 2.4% and mid-caps were up 2.6%
- The volume on CME's INX (S&P 500 Index) was 2.5m (3-month z-score: -0.2); the 3-month average volume is 2.6m and the 12-month range is 1.3 - 4.6m
- Daily performance of international indices: Europe Stoxx 600 up 2.14%; UK FTSE 100 up 2.55%; Hang Seng SH-SZ-HK 300 Index up 1.56%; Japan's TOPIX 500 up 1.90%
VOLATILITY
- 1-month at-the-money implied volatility on the S&P 500 at 25.3%, down from 28.1%
- 1-month at-the-money implied volatility on the Europe Stoxx 600 at 21.8%, down from 23.7%
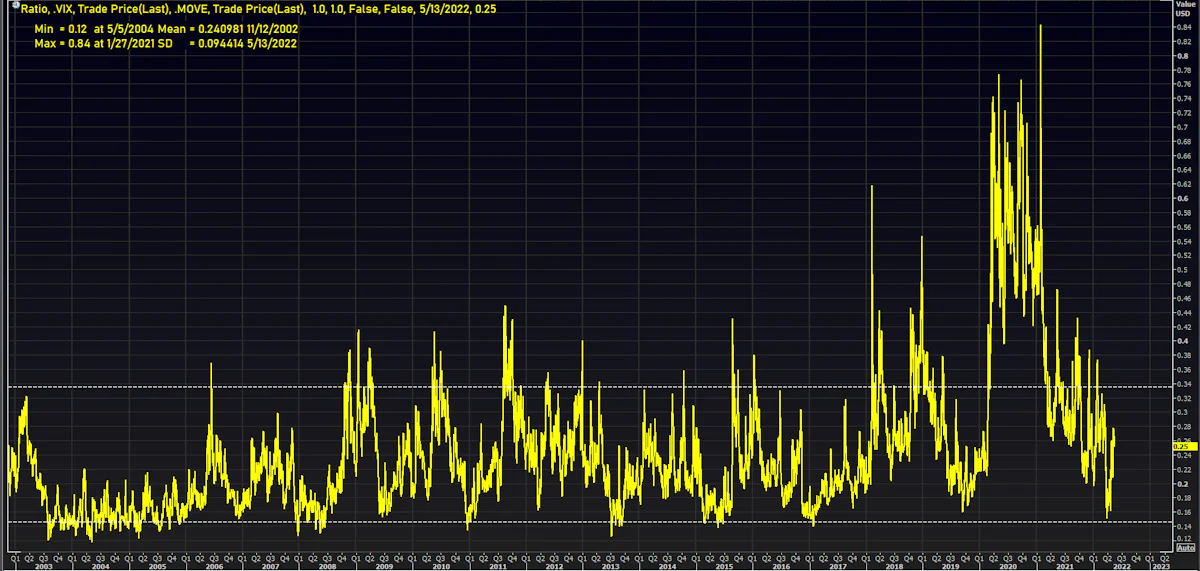
- VIX to MOVE Ratio is pretty much at its long-term average: equity implied vols remain relatively muted compared to rates vols
NOTABLE WINNERS TODAY
- Veru Inc (VERU), up 44.0% to $13.00 / 12-Month Price Range: $ 4.34-17.50 / Short interest (% of float): 24.1%; days to cover: 0.4
- Expensify Inc (EXFY), up 34.4% to $20.49 / YTD price return: -53.4% / 12-Month Price Range: $ 13.58-51.06 / Short interest (% of float): 12.8%; days to cover: 10.4
- Duolingo Inc (DUOL), up 34.0% to $89.77 / YTD price return: -15.4% / 12-Month Price Range: $ 60.50-205.00 / Short interest (% of float): 8.1%; days to cover: 4.3
- Lightspeed Commerce Inc (LSPD), up 32.2% to $21.37 / 12-Month Price Range: $ 15.03-130.02 / Short interest (% of float): 5.2%; days to cover: 6.3
- PagSeguro Digital Ltd (PAGS), up 31.8% to $13.47 / YTD price return: -48.6% / 12-Month Price Range: $ 9.53-61.65
- Affirm Holdings Inc (AFRM), up 31.4% to $23.71 / YTD price return: -76.4% / 12-Month Price Range: $ 13.64-176.65 / Short interest (% of float): 10.1%; days to cover: 2.1
- Payoneer Global Inc (PAYO), up 31.4% to $4.73 / 12-Month Price Range: $ 3.33-11.20 / Short interest (% of float): 3.6%; days to cover: 4.0
- indie Semiconductor Inc (INDI), up 28.5% to $6.94 / YTD price return: -42.1% / 12-Month Price Range: $ 5.07-16.33 / Short interest (% of float): 10.5%; days to cover: 6.4
- Celularity Inc (CELU), up 27.2% to $7.34 / YTD price return: +43.4% / 12-Month Price Range: $ 3.63-13.40 / Short interest (% of float): 4.5%; days to cover: 6.3
- Robinhood Markets Inc (HOOD), up 24.9% to $10.69 / YTD price return: -39.8% / 12-Month Price Range: $ 7.71-85.00 / Short interest (% of float): 8.8%; days to cover: 2.9
BIGGEST LOSERS TODAY
- Figs Inc (FIGS), down 25.0% to $9.64 / YTD price return: -65.0% / 12-Month Price Range: $ 9.64-50.40 (the stock is currently on the short sale restriction list)
- ProShares UltraPro Short QQQ (SQQQ), down 10.8% to $52.44 / YTD price return: +76.6% / 12-Month Price Range: $ 28.15-65.35 / Short interest (% of float): 14.0%; days to cover: 0.1 (the stock is currently on the short sale restriction list)
- Twitter Inc (TWTR), down 9.7% to $40.72 / YTD price return: -5.8% / 12-Month Price Range: $ 31.30-73.34 / Short interest (% of float): 5.0%; days to cover: 0.4 (the stock is currently on the short sale restriction list)
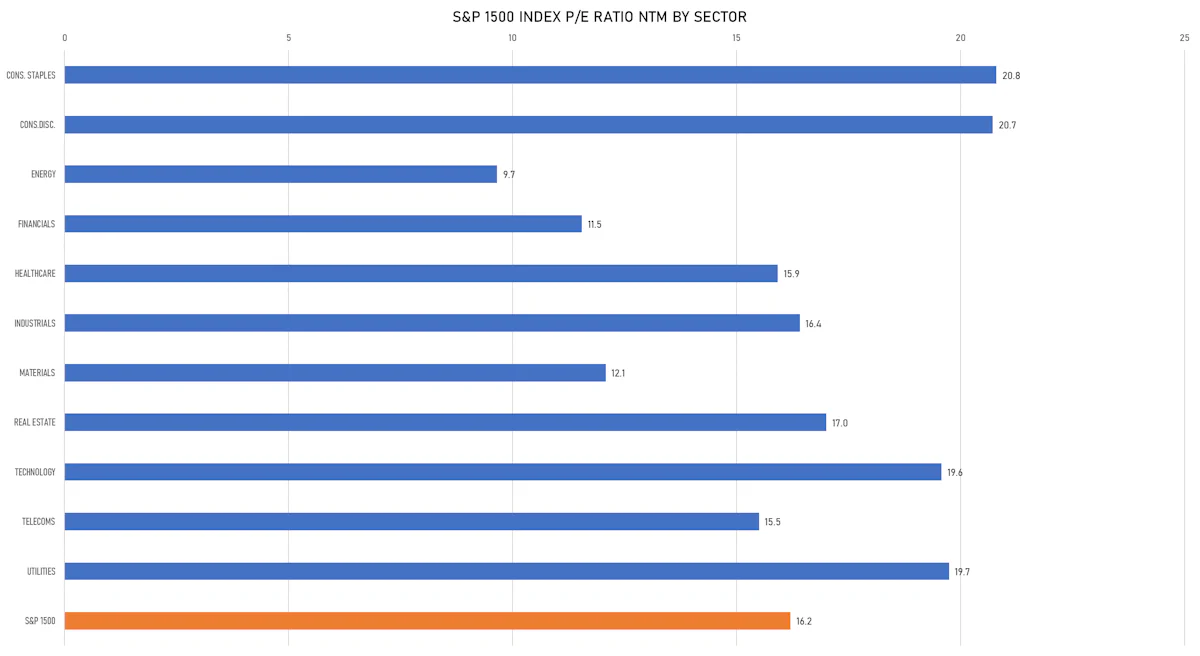
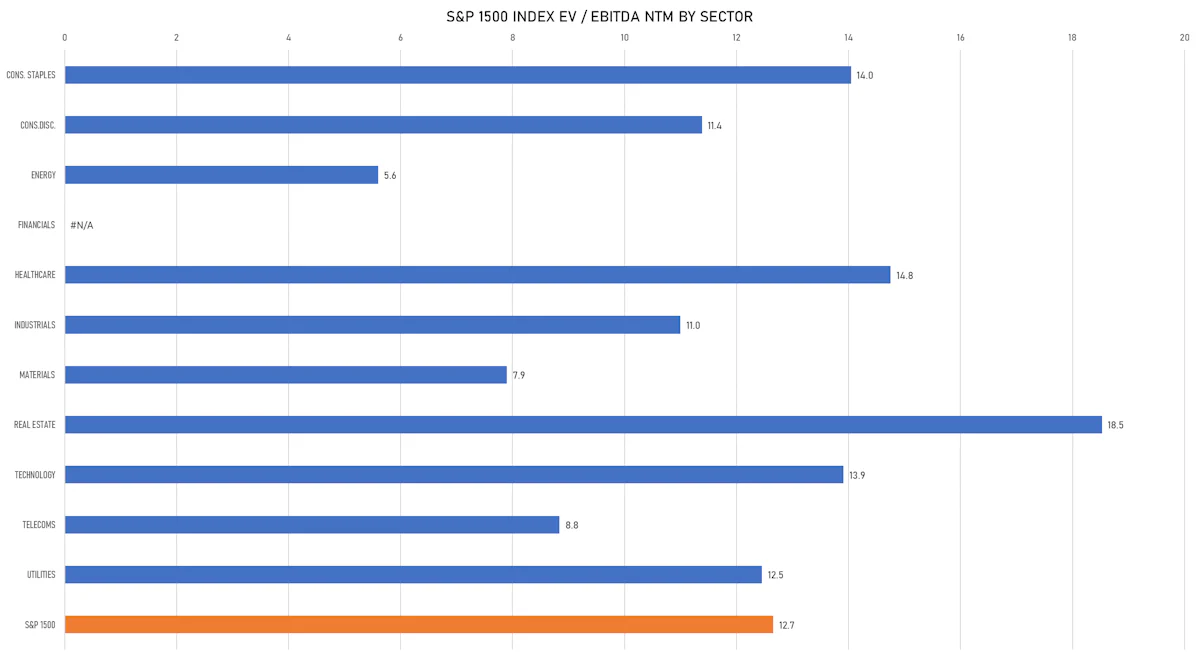
VALUATION MULTIPLES BY SECTORS
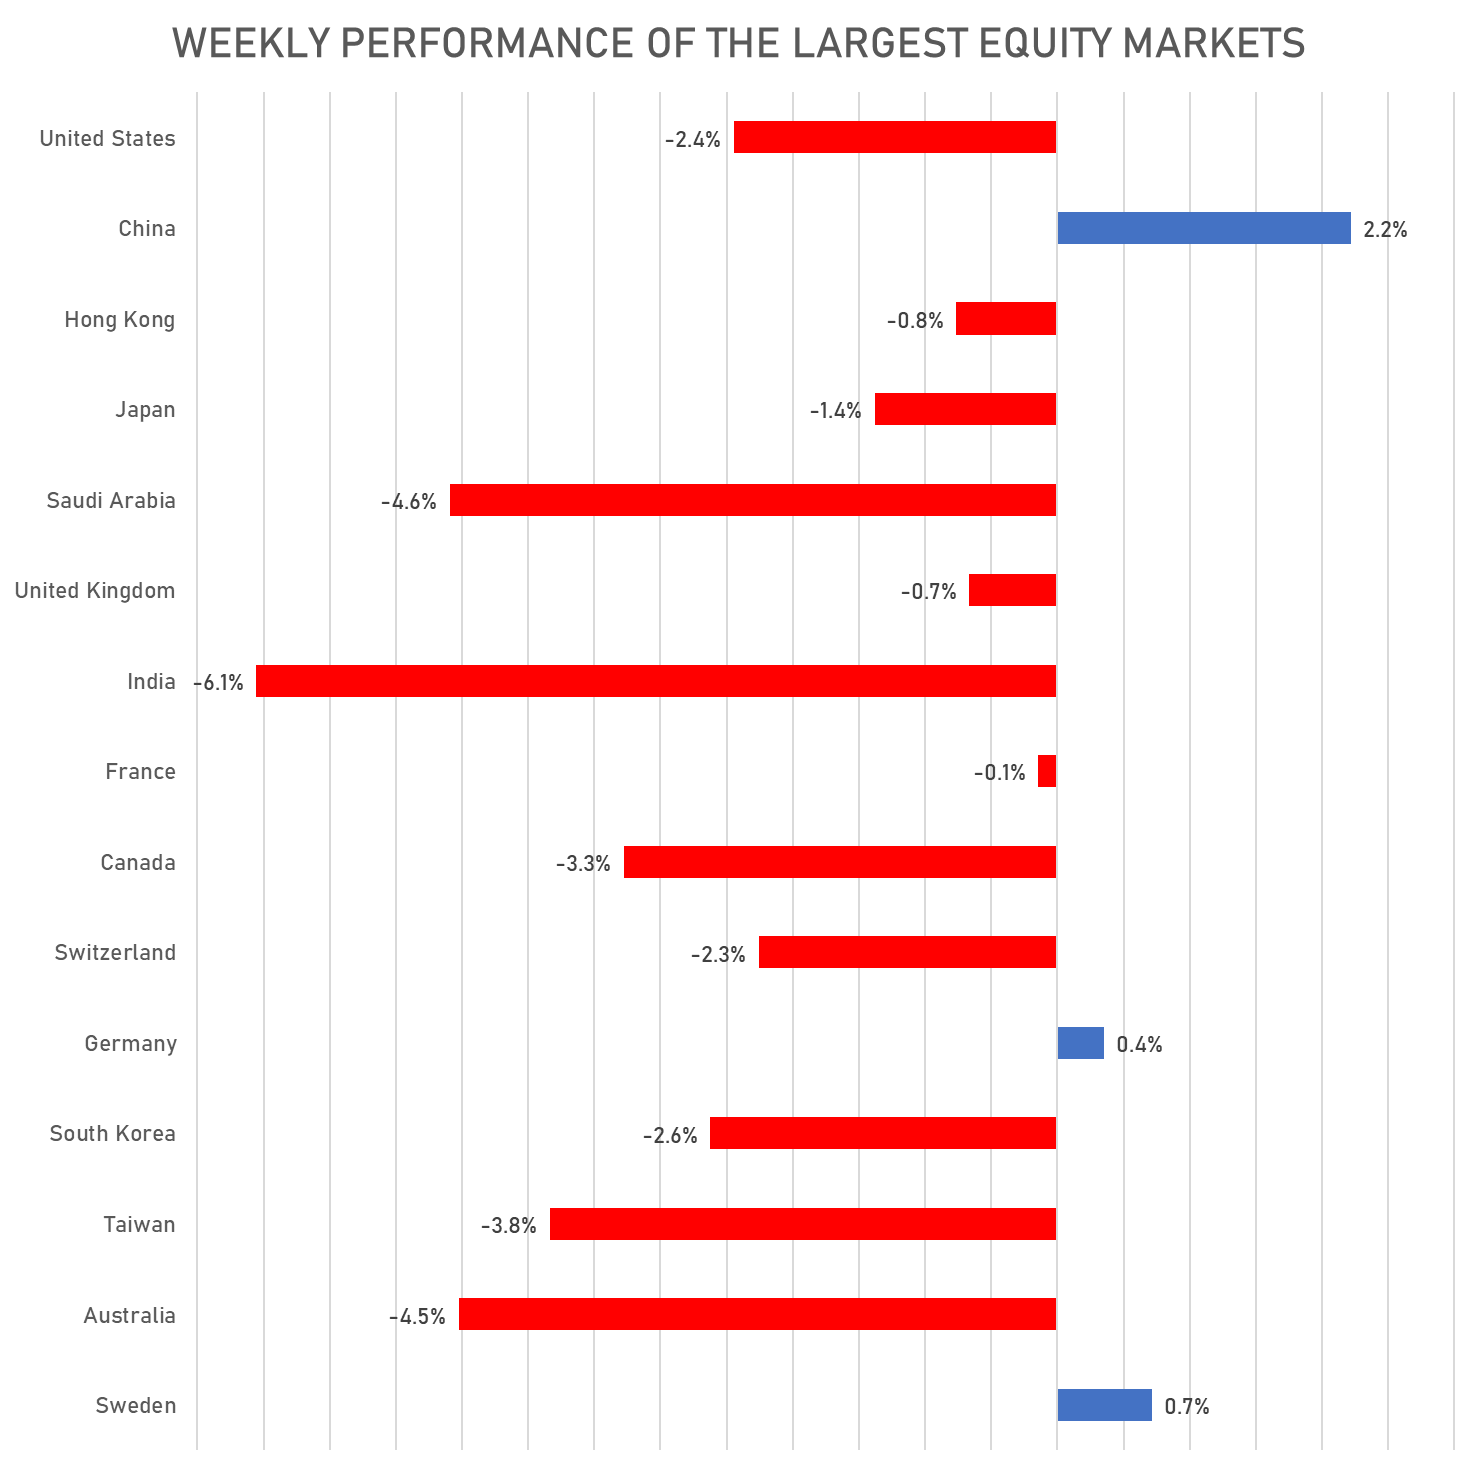
WEEKLY TOTAL RETURNS OF MAJOR GLOBAL EQUITY MARKETS
TOP / BOTTOM PERFORMING WORLD MARKETS YTD
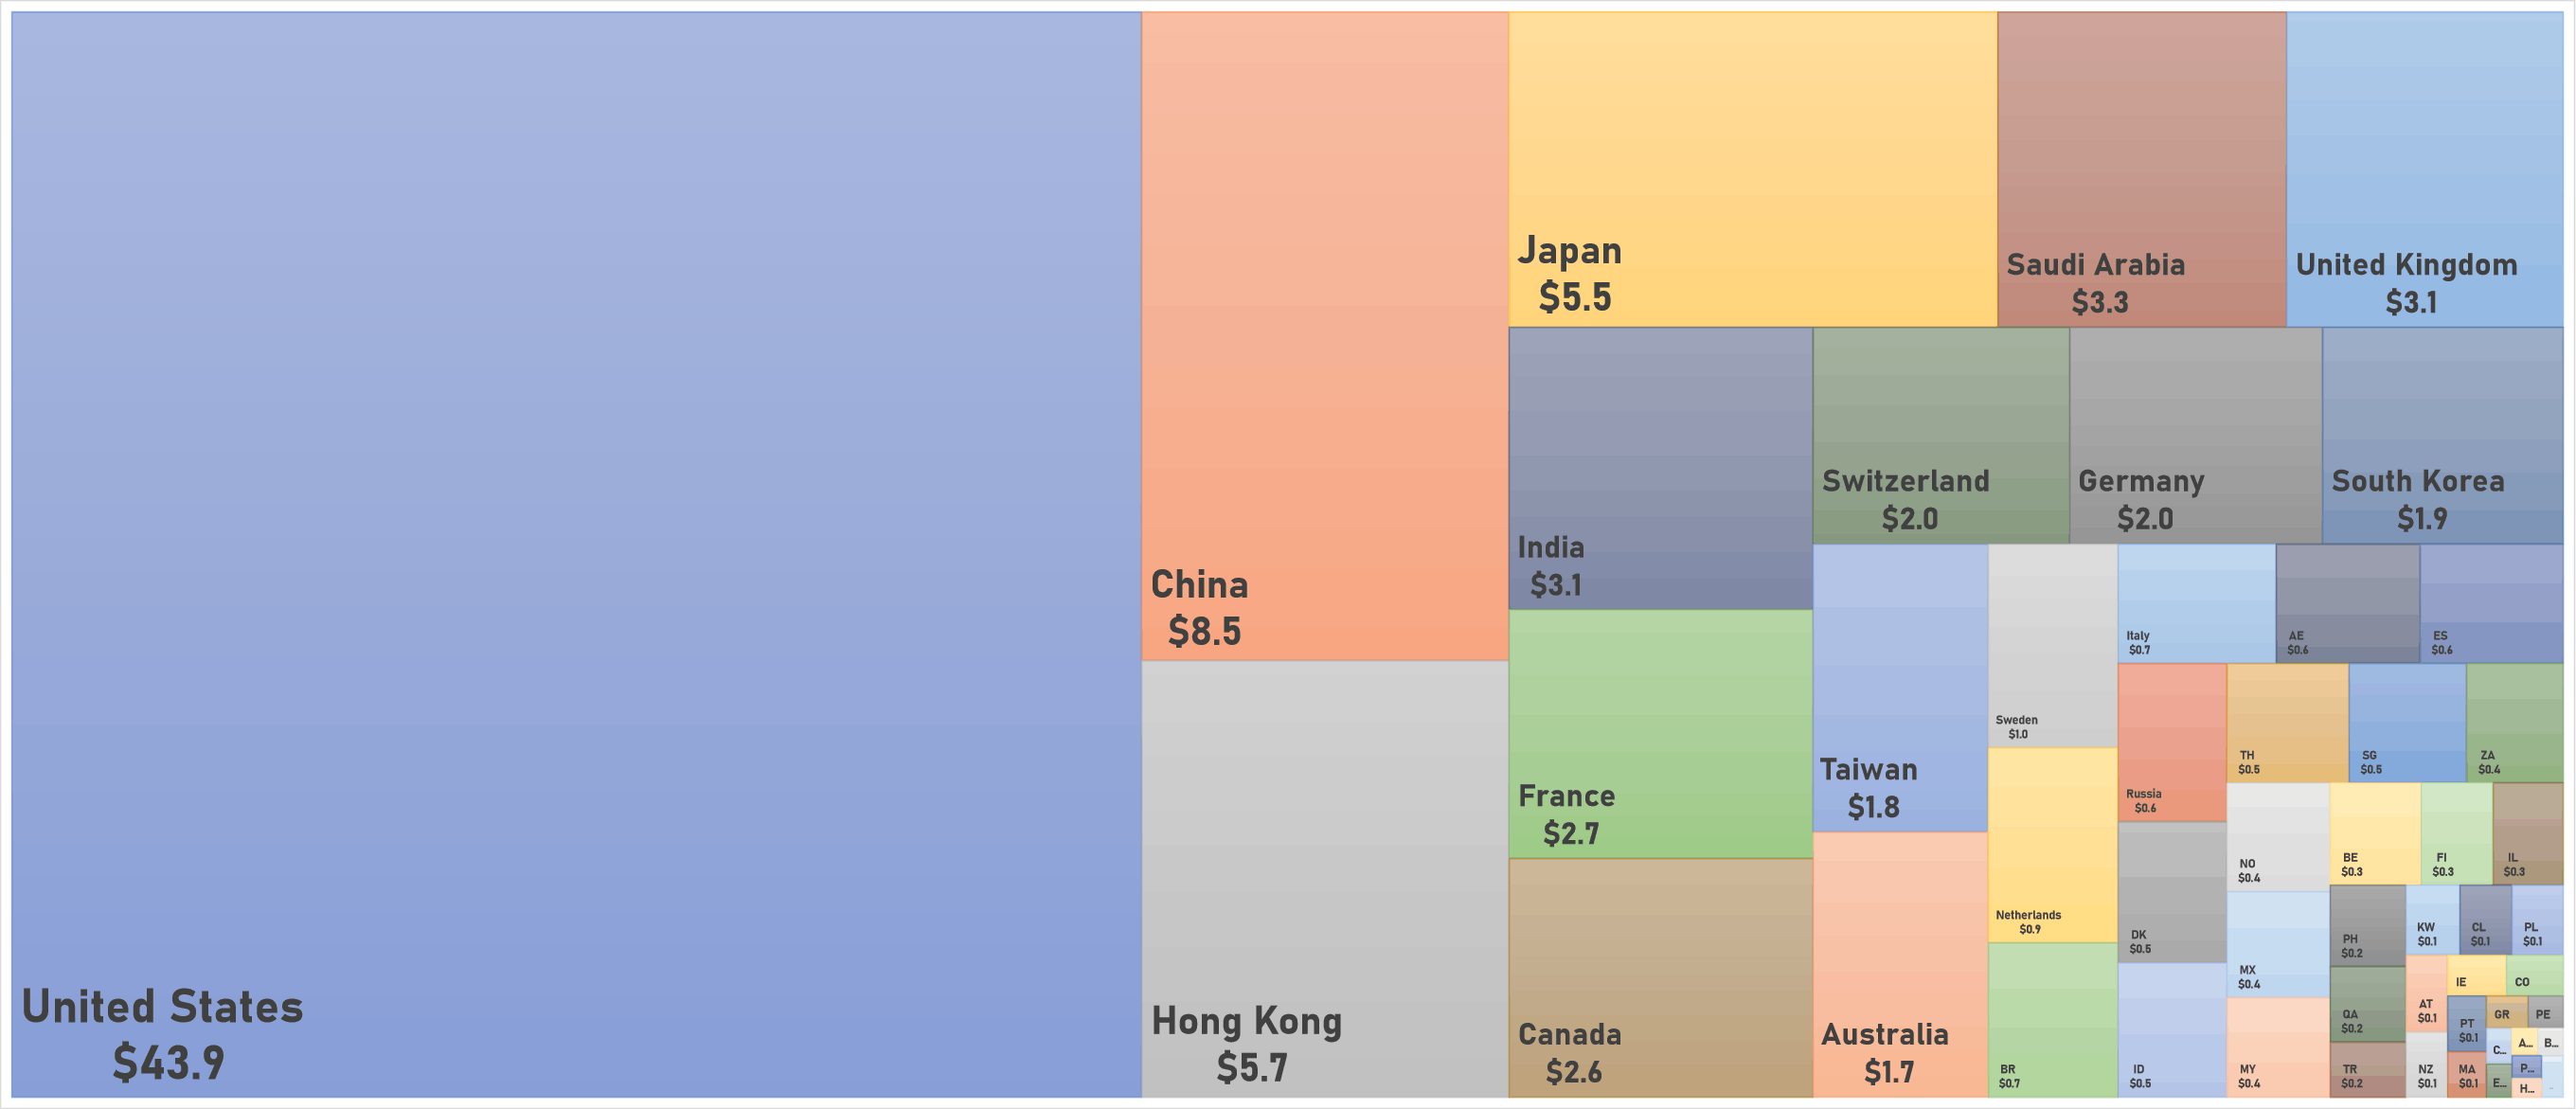
WORLD MARKET CAPITALIZATION (US$ Trillion)