Equities
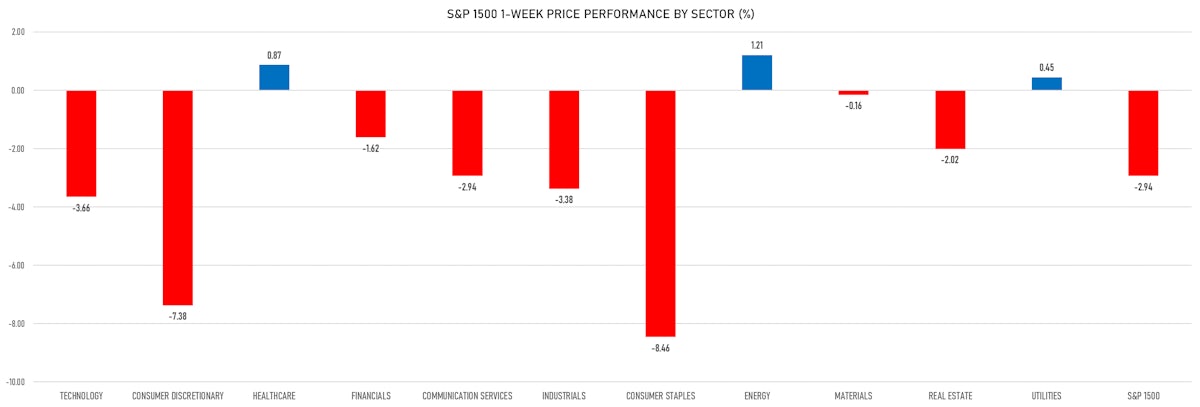
Equities Continue To Slide, Though Weakness Is Now Led By Falling Economic Growth Expectations Hitting The Consumer Staples And Consumer Discretionary Sectors
Looking at Walmart's earnings miss this week, the consensus seems too high for 2023: S&P 500 earnings per share are projected to grow by 10% next year, but further gross margin expansion is unlikely, as corporate pricing power is hitting a limit (wages growing slower than inflation at the moment)
Published ET
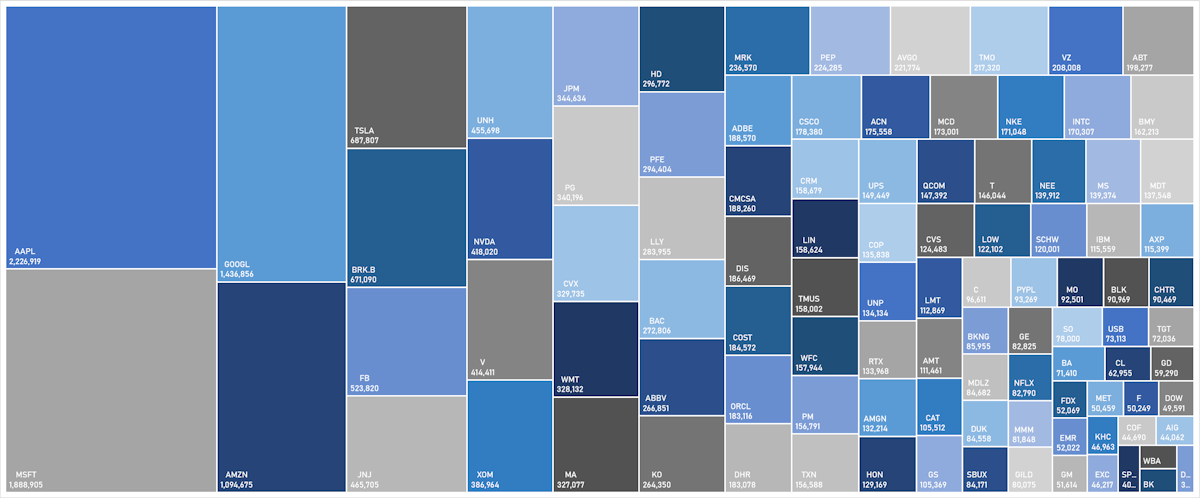
S&P 100 Market Cap | Sources: ϕpost, Refinitiv data
QUICK SUMMARY
- Daily performance of US indices: S&P 500 up 0.01%; Nasdaq Composite down -0.30%; Wilshire 5000 down -0.02%
- 57.8% of S&P 500 stocks were up today, with 24.6% of stocks above their 200-day moving average (DMA) and 13.7% above their 50-DMA
- Top performing sectors in the S&P 500: healthcare up 1.26% and real estate up 1.19%
- Bottom performing sectors in the S&P 500: consumer discretionary down -1.53% and industrials down -1.07%
- The number of shares in the S&P 500 traded today was 846m for a total turnover of US$ 91 bn
- The S&P 500 Value Index was up 0.1%, while the S&P 500 Growth Index was down -0.1%; the S&P small caps index was down -0.4% and mid-caps were down -0.3%
- The volume on CME's INX (S&P 500 Index) was 3.0m (3-month z-score: 0.8); the 3-month average volume is 2.7m and the 12-month range is 1.3 - 4.6m
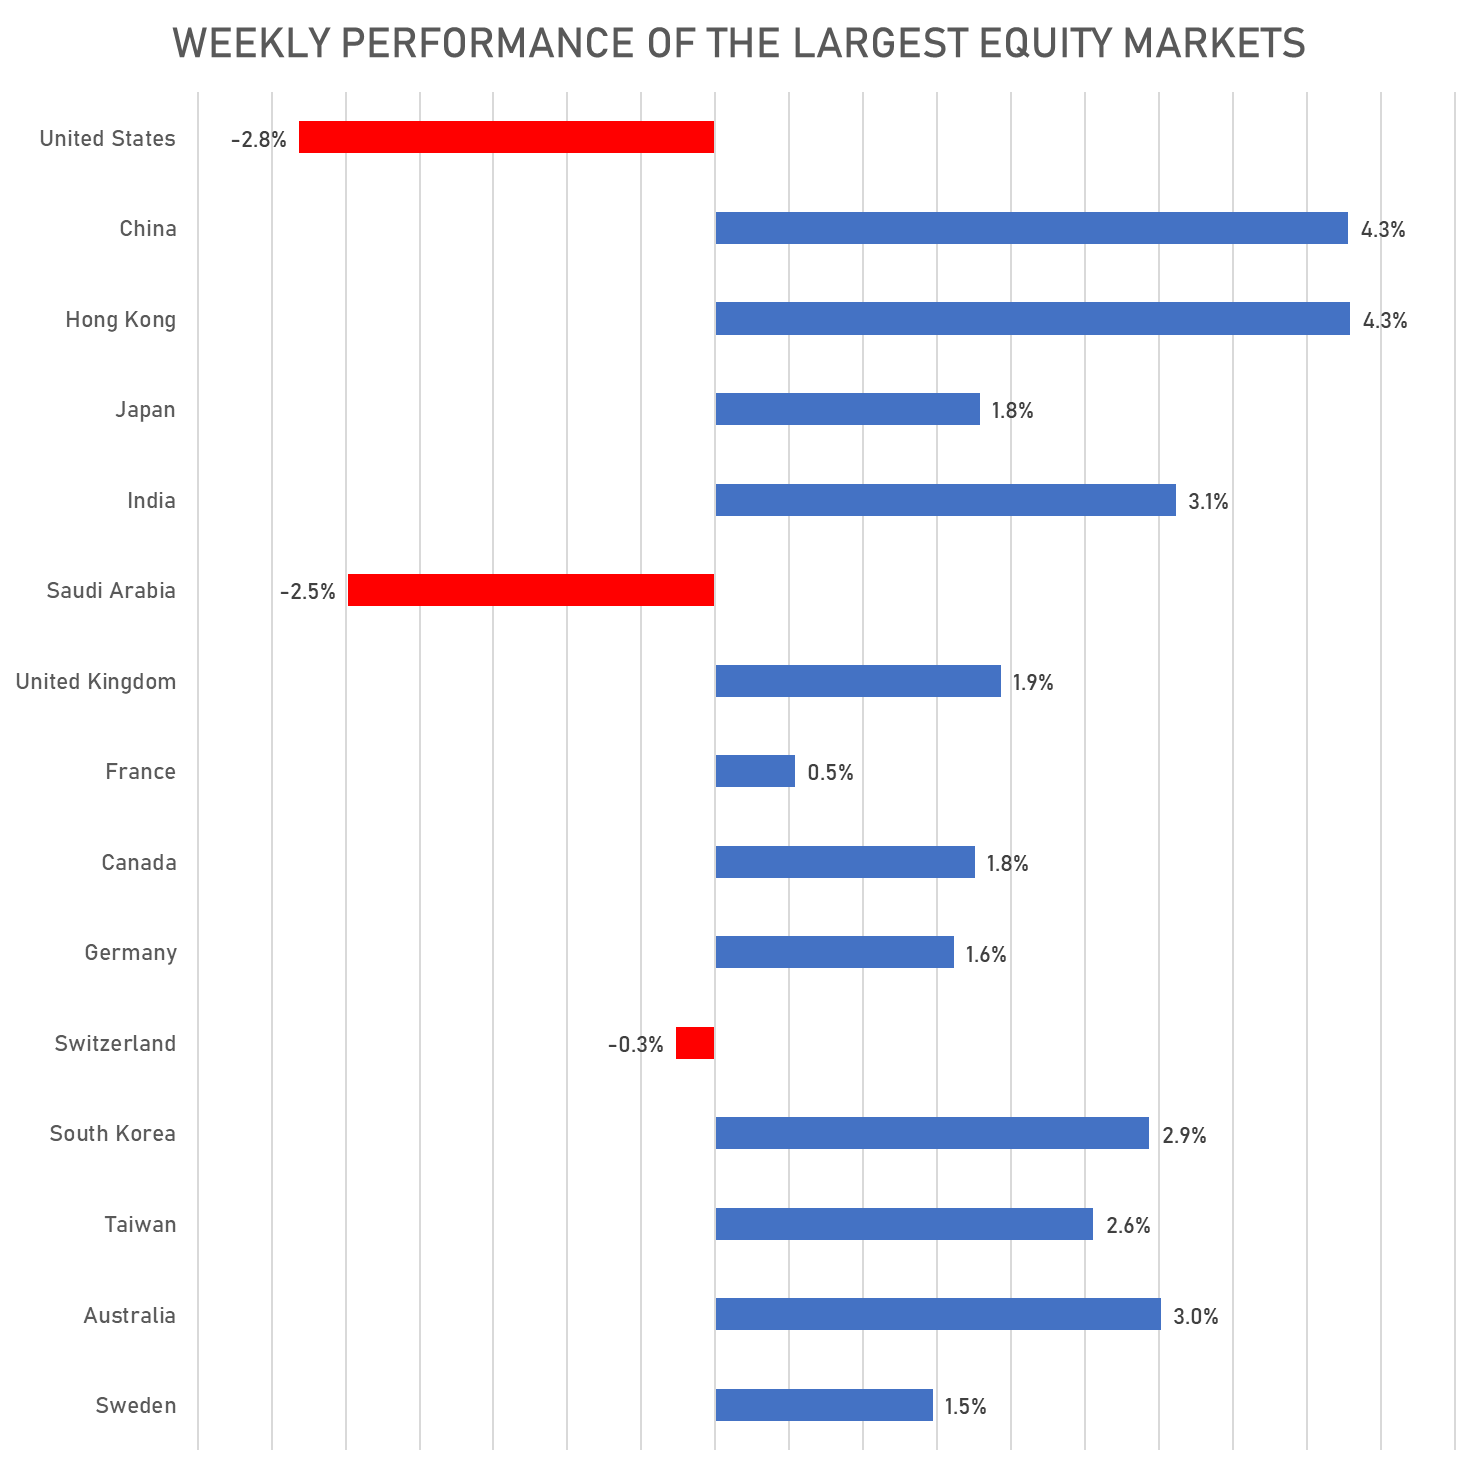
- Daily performance of international indices: Europe Stoxx 600 up 0.73%; UK FTSE 100 up 1.19%; Hang Seng SH-SZ-HK 300 Index up 2.01%; Japan's TOPIX 500 up 0.92%
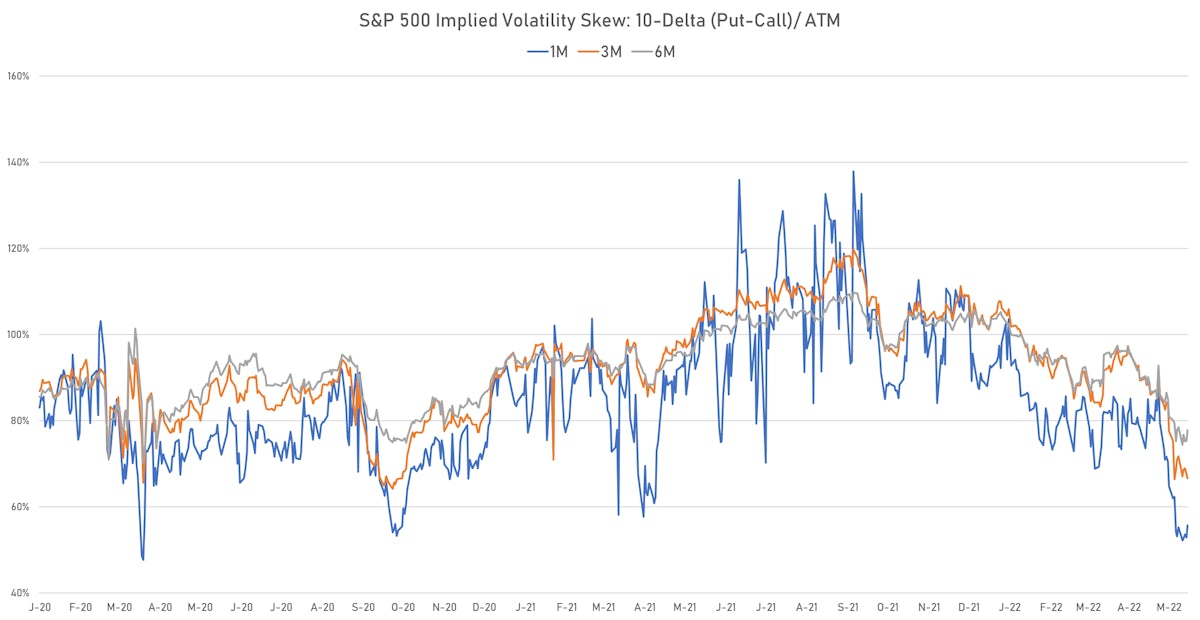
VOLATILITY
- 1-month at-the-money implied volatility on the S&P 500 at 25.3%, up from 25.2%
- 1-month at-the-money implied volatility on the Europe Stoxx 600 at 21.5%, down from 22.7%
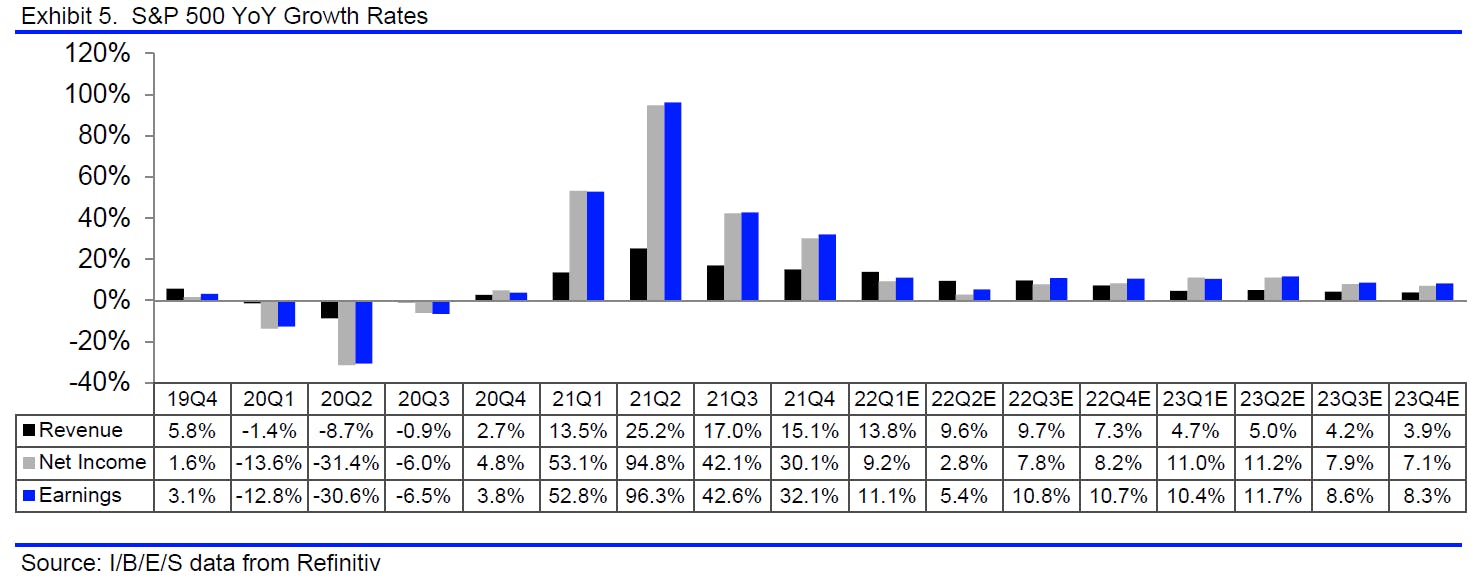
EARNINGS SUMMARY
- The S&P 500 net income growth rate for Q1 currently stands at 9.1%, which is much better than the consensus (expectation was 4.7%)
- According to FactSet: "Of the 95% of S&P 500 companies that have reported for Q1, 77% have beaten consensus EPS expectations, below the 83% one-year average but level with the five-year average of 77%"
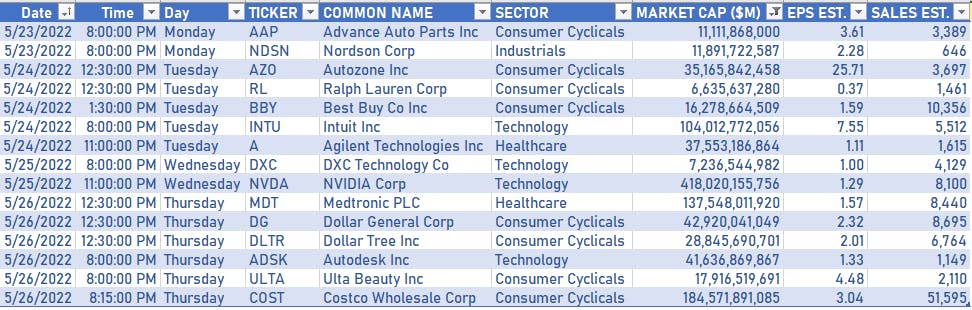
NOTABLE US EARNINGS RELEASES NEXT WEEK
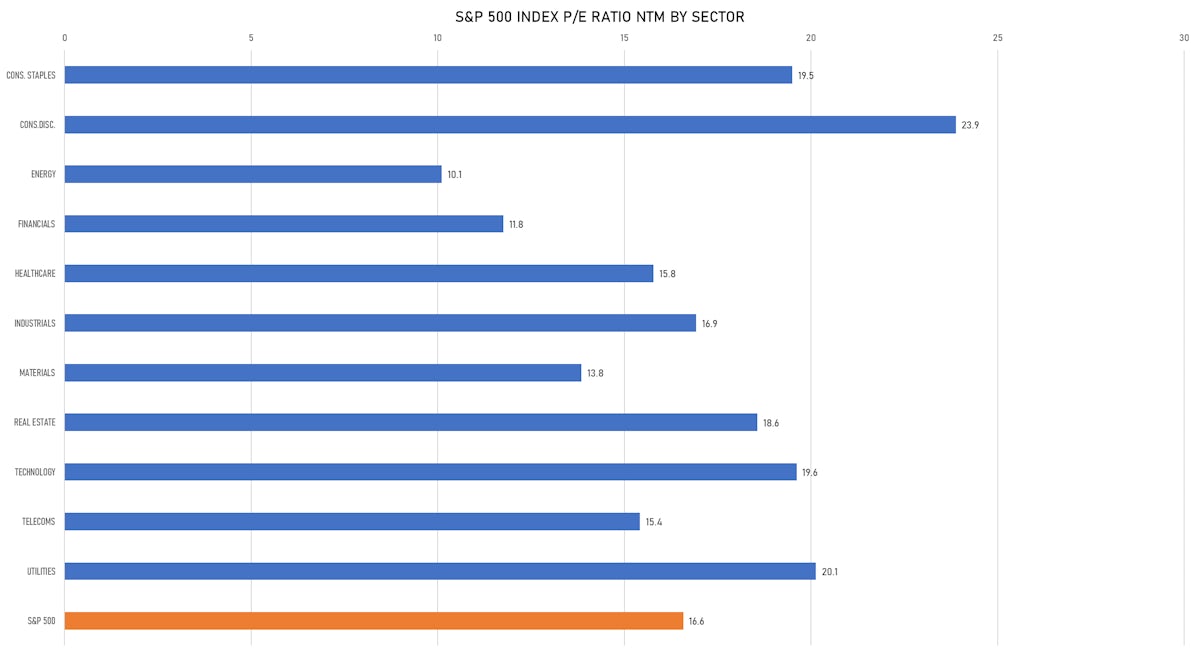
VALUATION MULTIPLES BY SECTORS
WEEKLY US$ TOTAL RETURNS OF MAJOR GLOBAL EQUITY MARKETS
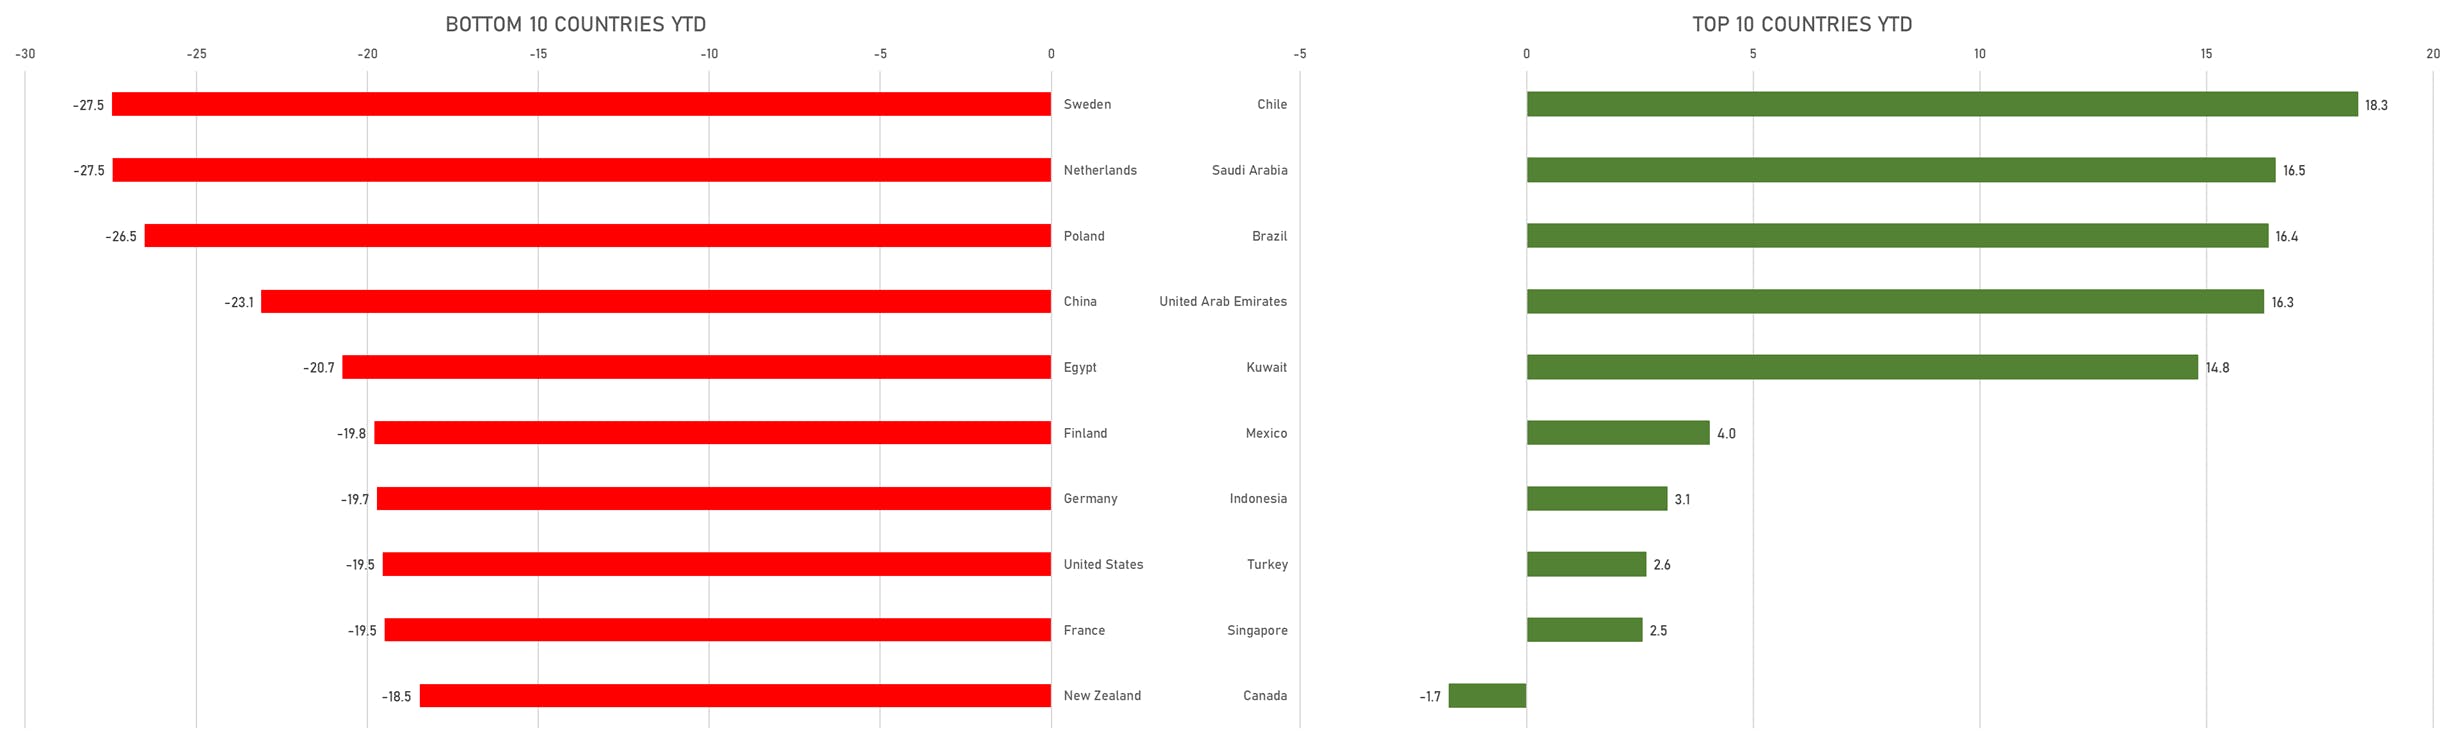
TOP / BOTTOM PERFORMING WORLD MARKETS YTD
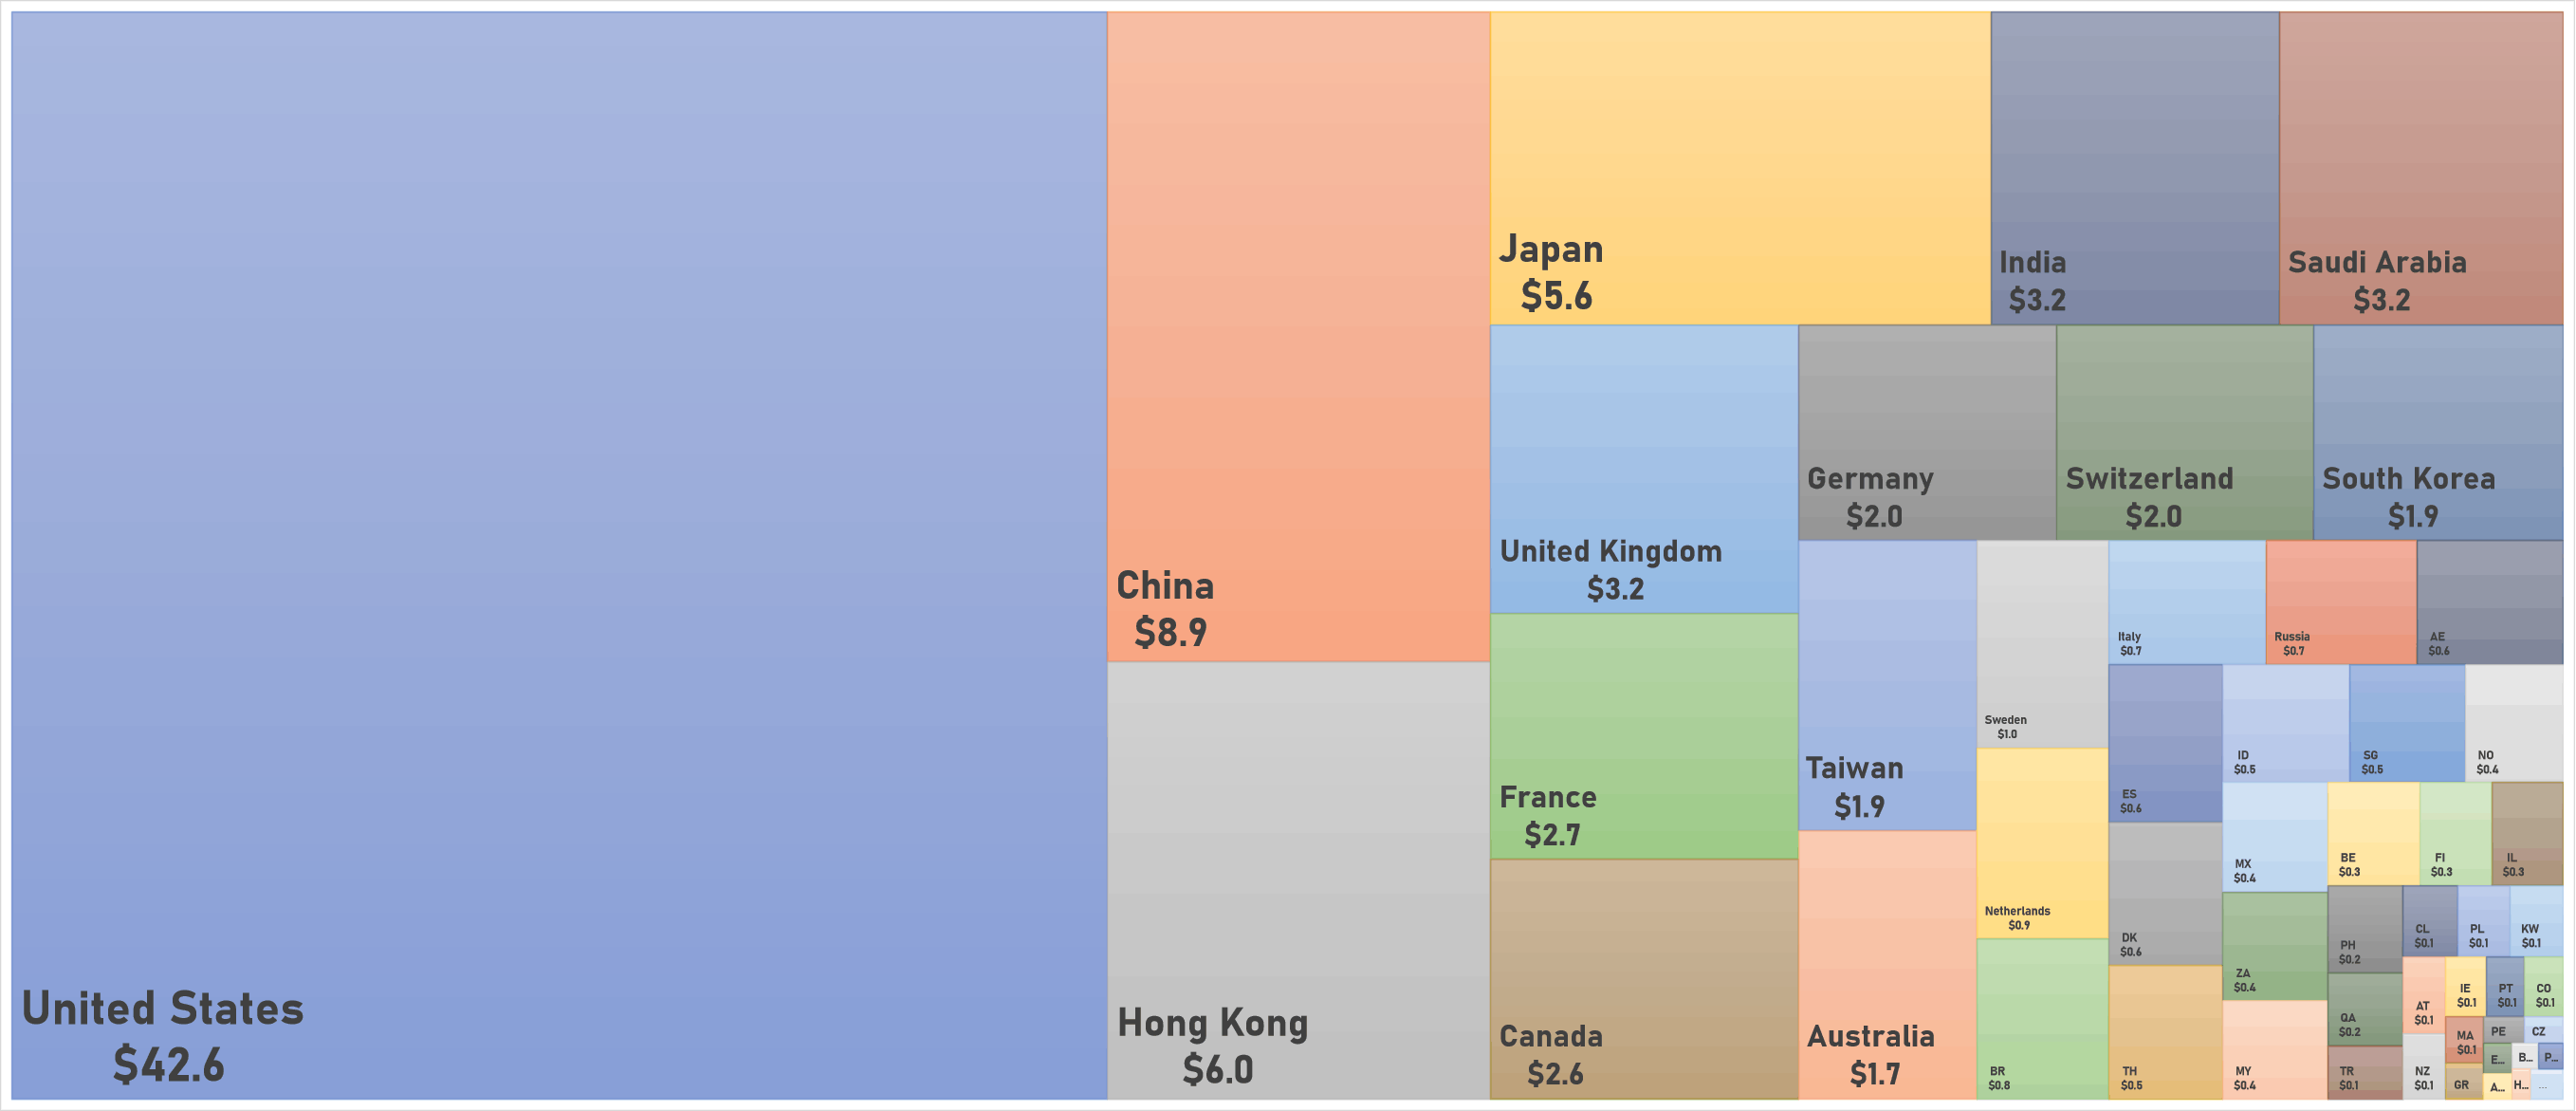
WORLD MARKET CAPITALIZATION (US$ Trillion)