Equities
96% Up Day For S&P 500 Stock, With US Equities Ending A Positive Week Near Best Levels
Although a large number of sell-side strategists don't think equities have bottomed yet, the technical picture looks clearly tilted towards a continued rebound next week, in the context of a bear market rally for technology stocks
Published ET
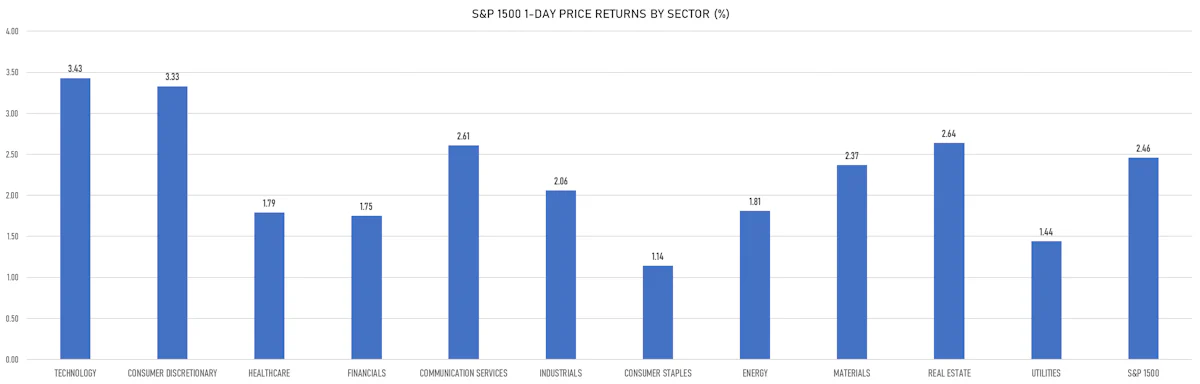
S&P 1500 Price Returns By Sector Today | Sources: ϕpost, Refinitiv data
DAILY SUMMARY
- Daily performance of US indices: S&P 500 up 2.47%; Nasdaq Composite up 3.33%; Wilshire 5000 up 2.59%
- 96.0% of S&P 500 stocks were up today, with 37.2% of stocks above their 200-day moving average (DMA) and 44.6% above their 50-DMA
- Top performing sectors in the S&P 500: consumer discretionary up 3.47% and technology up 3.44%
- Bottom performing sectors in the S&P 500: consumer staples up 1.09% and utilities up 1.48%
- The number of shares in the S&P 500 traded today was 608m for a total turnover of US$ 74 bn
- The S&P 500 Value Index was up 1.7%, while the S&P 500 Growth Index was up 3.3%; the S&P small caps index was up 2.3% and mid-caps were up 2.3%
- The volume on CME's INX (S&P 500 Index) was 2.2m (3-month z-score: -1.1); the 3-month average volume is 2.6m and the 12-month range is 1.3 - 4.6m
- Daily performance of international indices: Europe Stoxx 600 up 1.42%; UK FTSE 100 up 0.27%; Hang Seng SH-SZ-HK 300 Index up 1.39%; Japan's TOPIX 500 up 0.50%
VOLATILITY
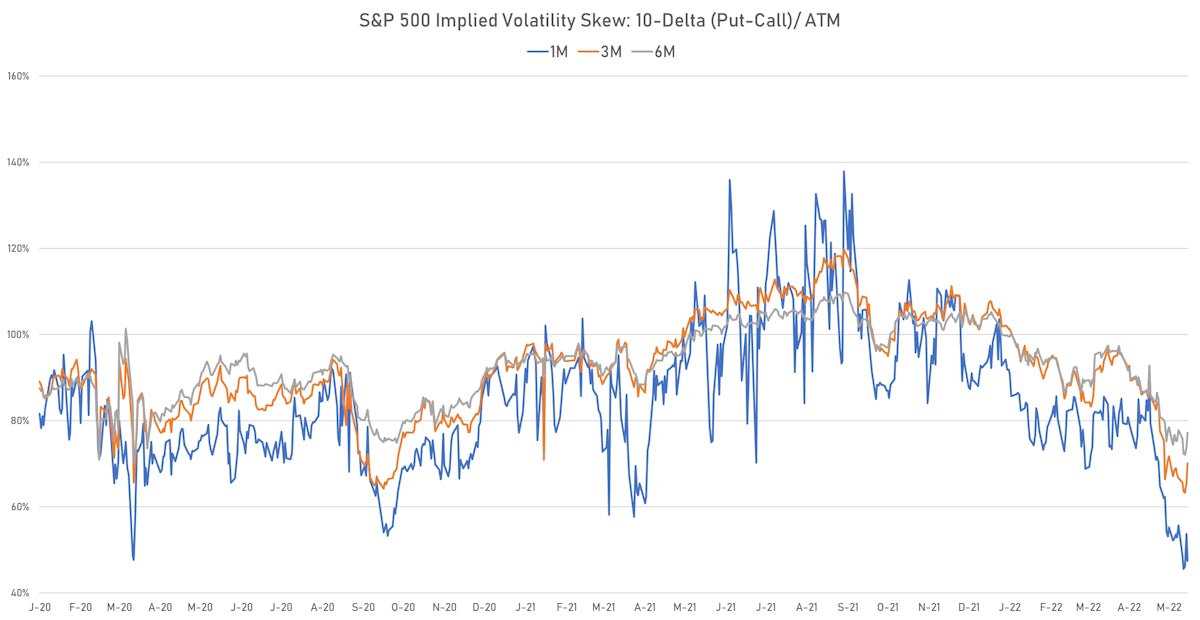
- 1-month at-the-money implied volatility on the S&P 500 at 22.0%, down from 24.0%
- 1-month at-the-money implied volatility on the Europe Stoxx 600 at 17.4%, down from 18.8%
NOTABLE US EARNINGS RELEASES
- Macy's Inc (M | Consumer Cyclicals): beat EPS median estimate (1.08 act. vs. 0.83 est.) and beat revenue median estimate (5,348m act. vs. 5,320m est.), up 2.27% today, closed at $ 23.44 / share and traded at $ 23.52 (+0.34%) after hours
TOP WINNERS
- Farfetch Ltd (FTCH), up 26.7% to $9.73 / YTD price return: -70.9% / 12-Month Price Range: $ 6.53-53.77 / Short interest (% of float): 7.1%; days to cover: 2.4
- SoundHound AI Inc (SOUN), up 21.3% to $7.91 / 12-Month Price Range: $ 4.34-18.14 / Short interest (% of float): 0.1%; days to cover: 0.0
- Qurate Retail Inc (QRTEB), up 18.6% to $5.43 / 12-Month Price Range: $ 4.14-14.14 / Short interest (% of float): 0.4%; days to cover: 2.6
- AMC Entertainment Holdings Inc (AMC), up 18.0% to $14.43 / YTD price return: -46.9% / 12-Month Price Range: $ 9.70-72.62 / Short interest (% of float): 21.1%; days to cover: 2.8
- Novavax Inc (NVAX), up 17.5% to $55.29 / YTD price return: -61.4% / 12-Month Price Range: $ 41.33-277.80 / Short interest (% of float): 18.4%; days to cover: 2.7
- Upstart Holdings Inc (UPST), up 16.8% to $50.33 / YTD price return: -66.7% / 12-Month Price Range: $ 25.43-401.49 / Short interest (% of float): 32.0%; days to cover: 1.9
- Pinduoduo Inc (PDD), up 15.2% to $48.30 / YTD price return: -17.2% / 12-Month Price Range: $ 23.21-143.11 / Short interest (% of float): 1.5%; days to cover: 1.3
- Opendoor Technologies Inc (OPEN), up 14.9% to $7.49 / YTD price return: -48.7% / 12-Month Price Range: $ 5.15-25.33 / Short interest (% of float): 20.4%; days to cover: 5.7
- Immunitybio Inc (IBRX), up 14.6% to $3.92 / YTD price return: -35.5% / 12-Month Price Range: $ 2.60-18.14 / Short interest (% of float): 21.1%; days to cover: 9.8
- Viasat Inc (VSAT), up 14.3% to $41.77 / 12-Month Price Range: $ 35.05-68.76 / Short interest (% of float): 8.2%; days to cover: 12.9
BIGGEST LOSERS
- Iovance Biotherapeutics Inc (IOVA), down 53.6% to $7.02 / YTD price return: -63.2% / 12-Month Price Range: $ 11.91-28.00 / Short interest (% of float): 11.9%; days to cover: 7.5 (the stock is currently on the short sale restriction list)
- Mirati Therapeutics Inc (MRTX), down 31.9% to $39.81 / YTD price return: -72.9% / 12-Month Price Range: $ 51.16-195.99 / Short interest (% of float): 10.0%; days to cover: 6.7 (the stock is currently on the short sale restriction list)
- Canopy Growth Corp (CGC), down 12.1% to $4.88 / YTD price return: -44.1% / 12-Month Price Range: $ 4.70-26.96 / Short interest (% of float): 19.2%; days to cover: 7.8 (the stock is currently on the short sale restriction list)
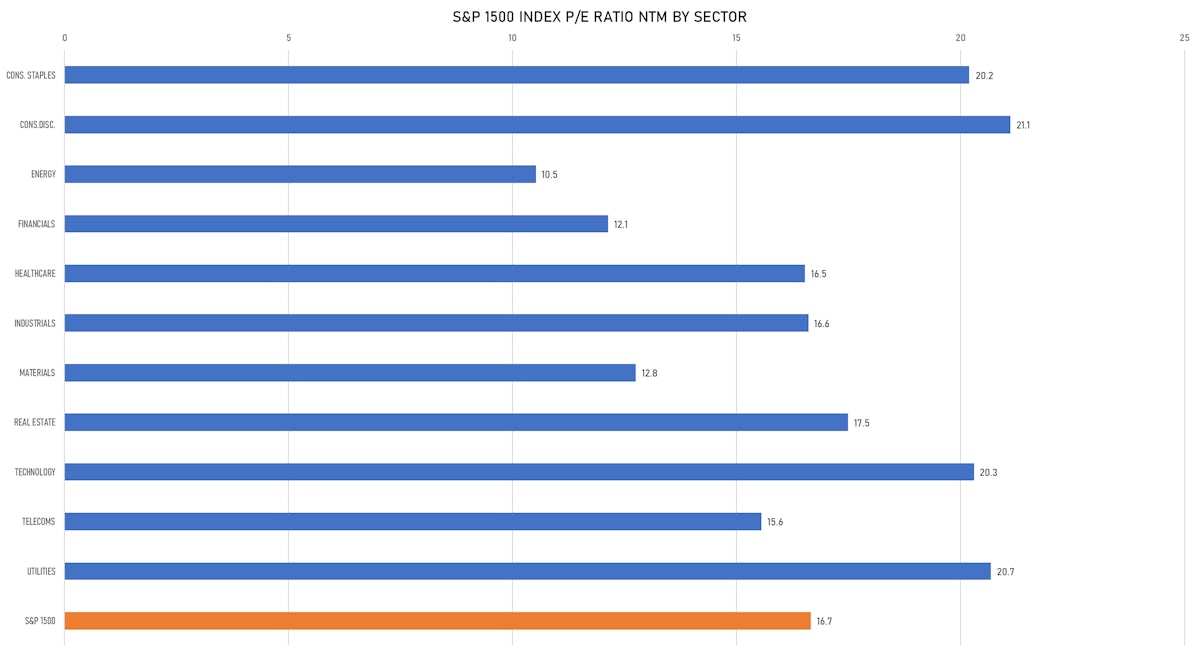
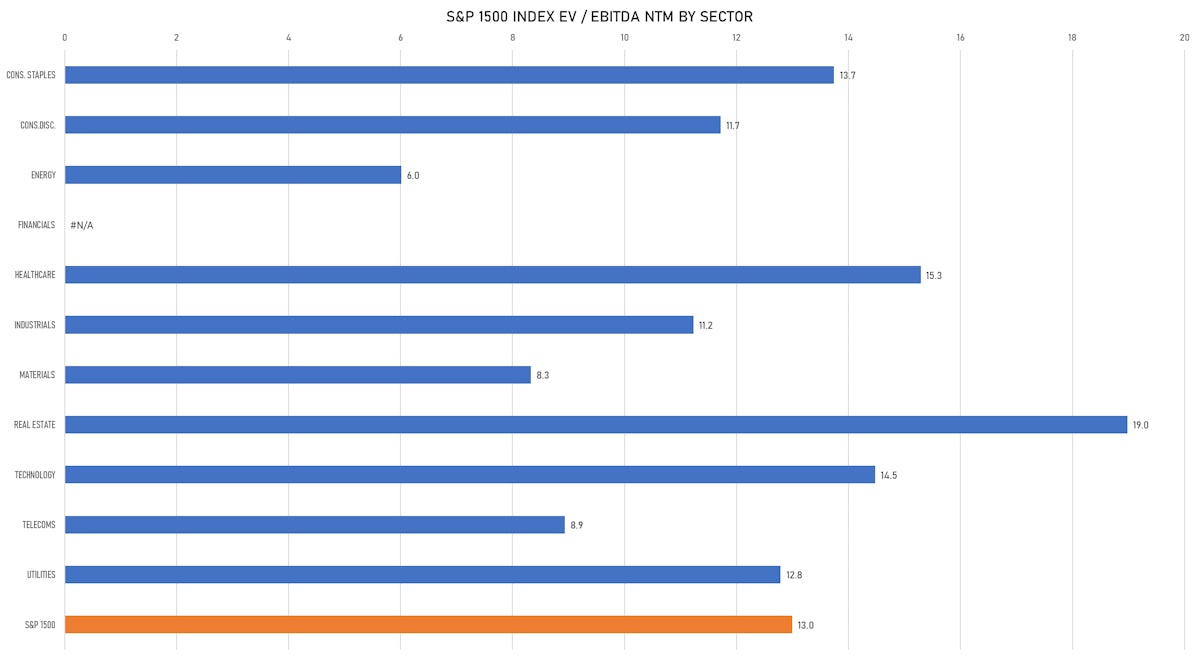
VALUATION MULTIPLES BY SECTORS
WEEKLY TOTAL RETURNS OF MAJOR GLOBAL EQUITY MARKETS
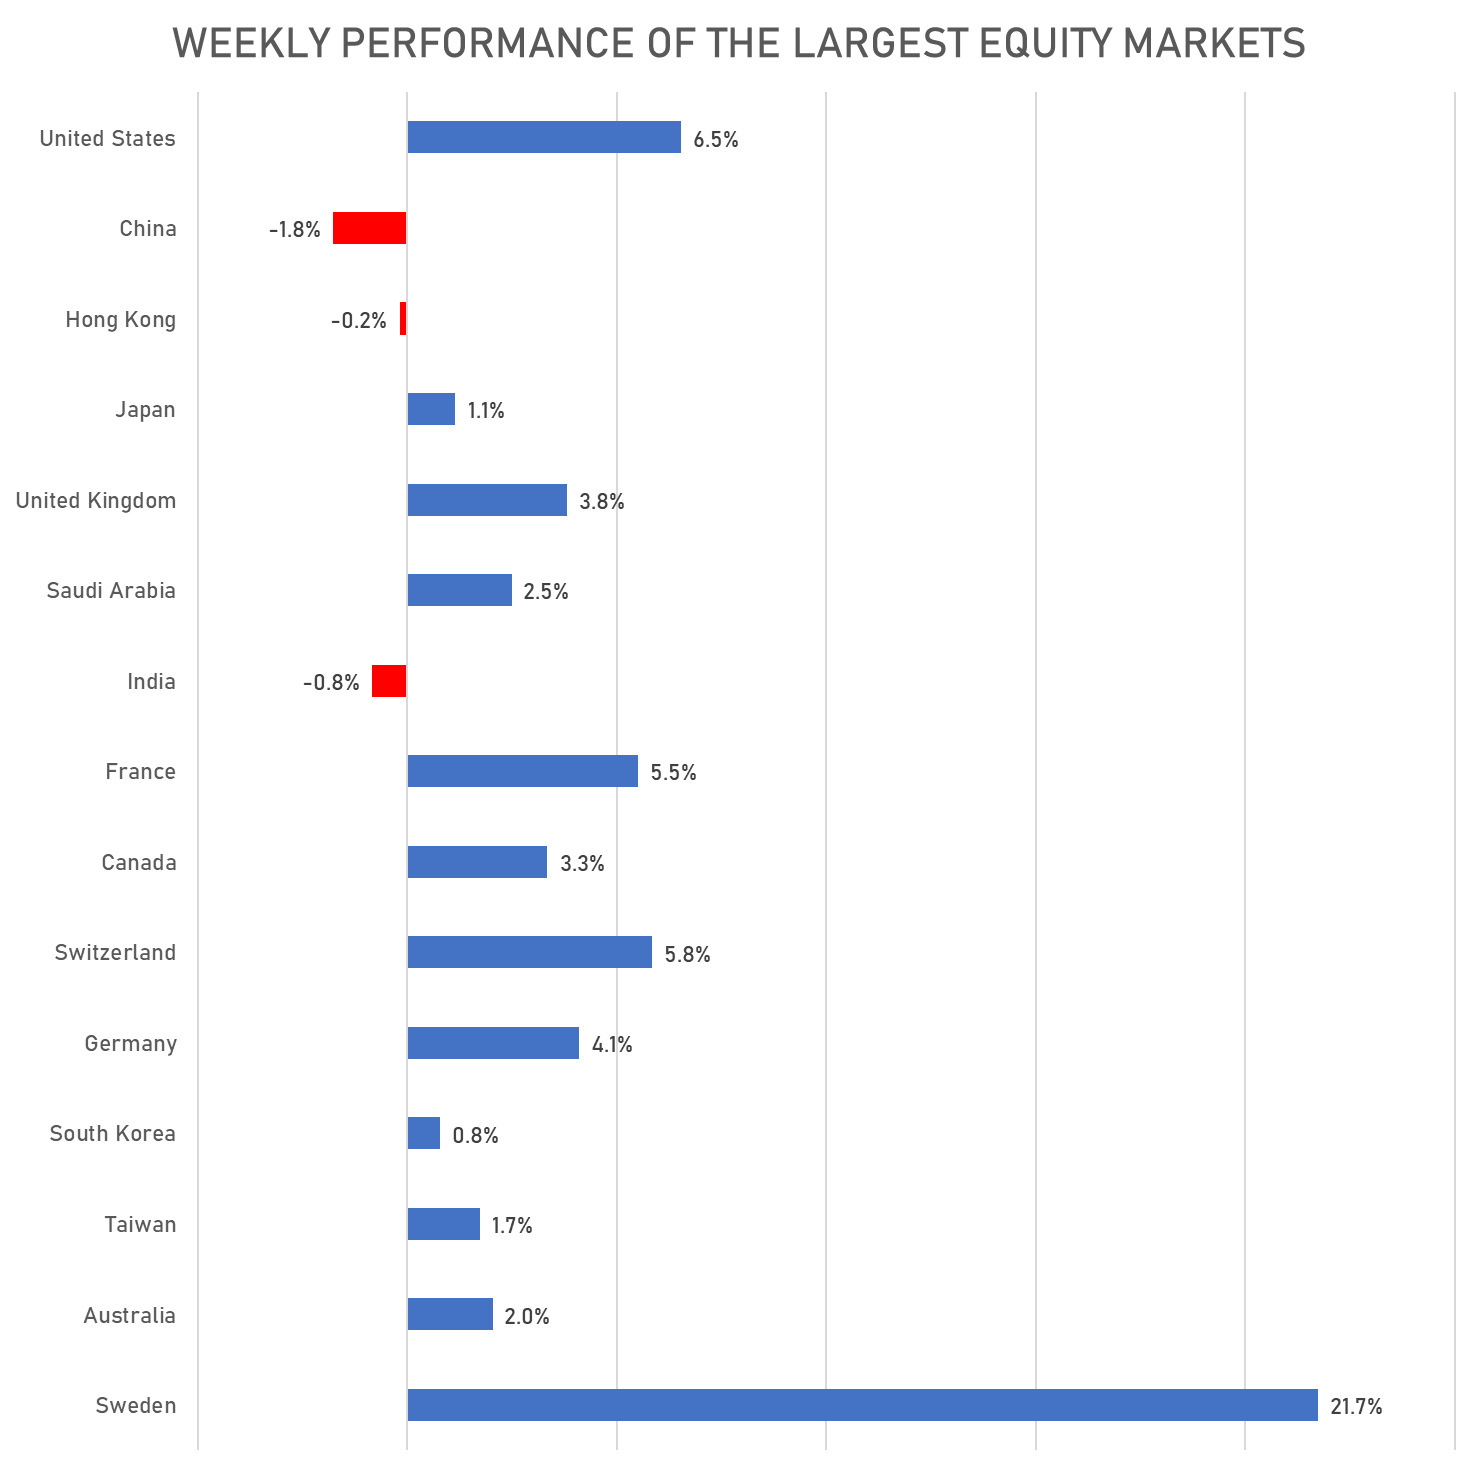
Sources: ϕpost, FactSet data
TOP / BOTTOM PERFORMING WORLD MARKETS YTD
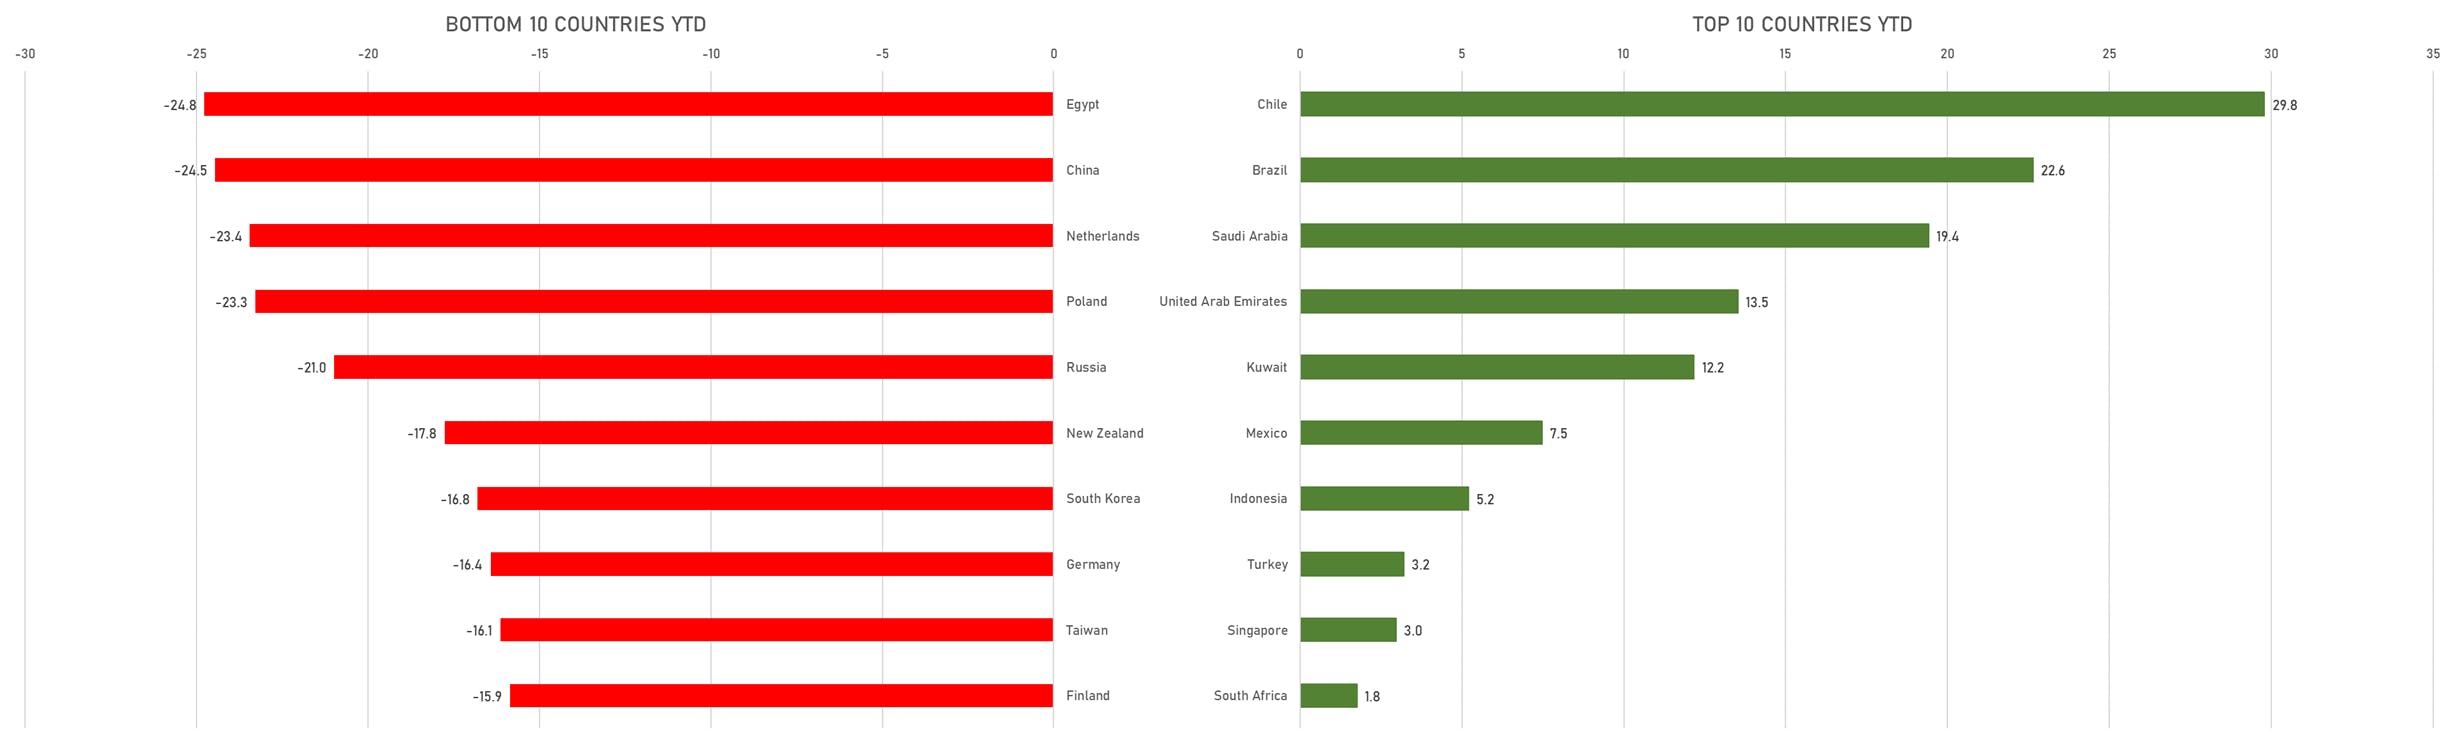
Sources: ϕpost, FactSet data
WORLD MARKET CAPITALIZATION (US$ Trillion)
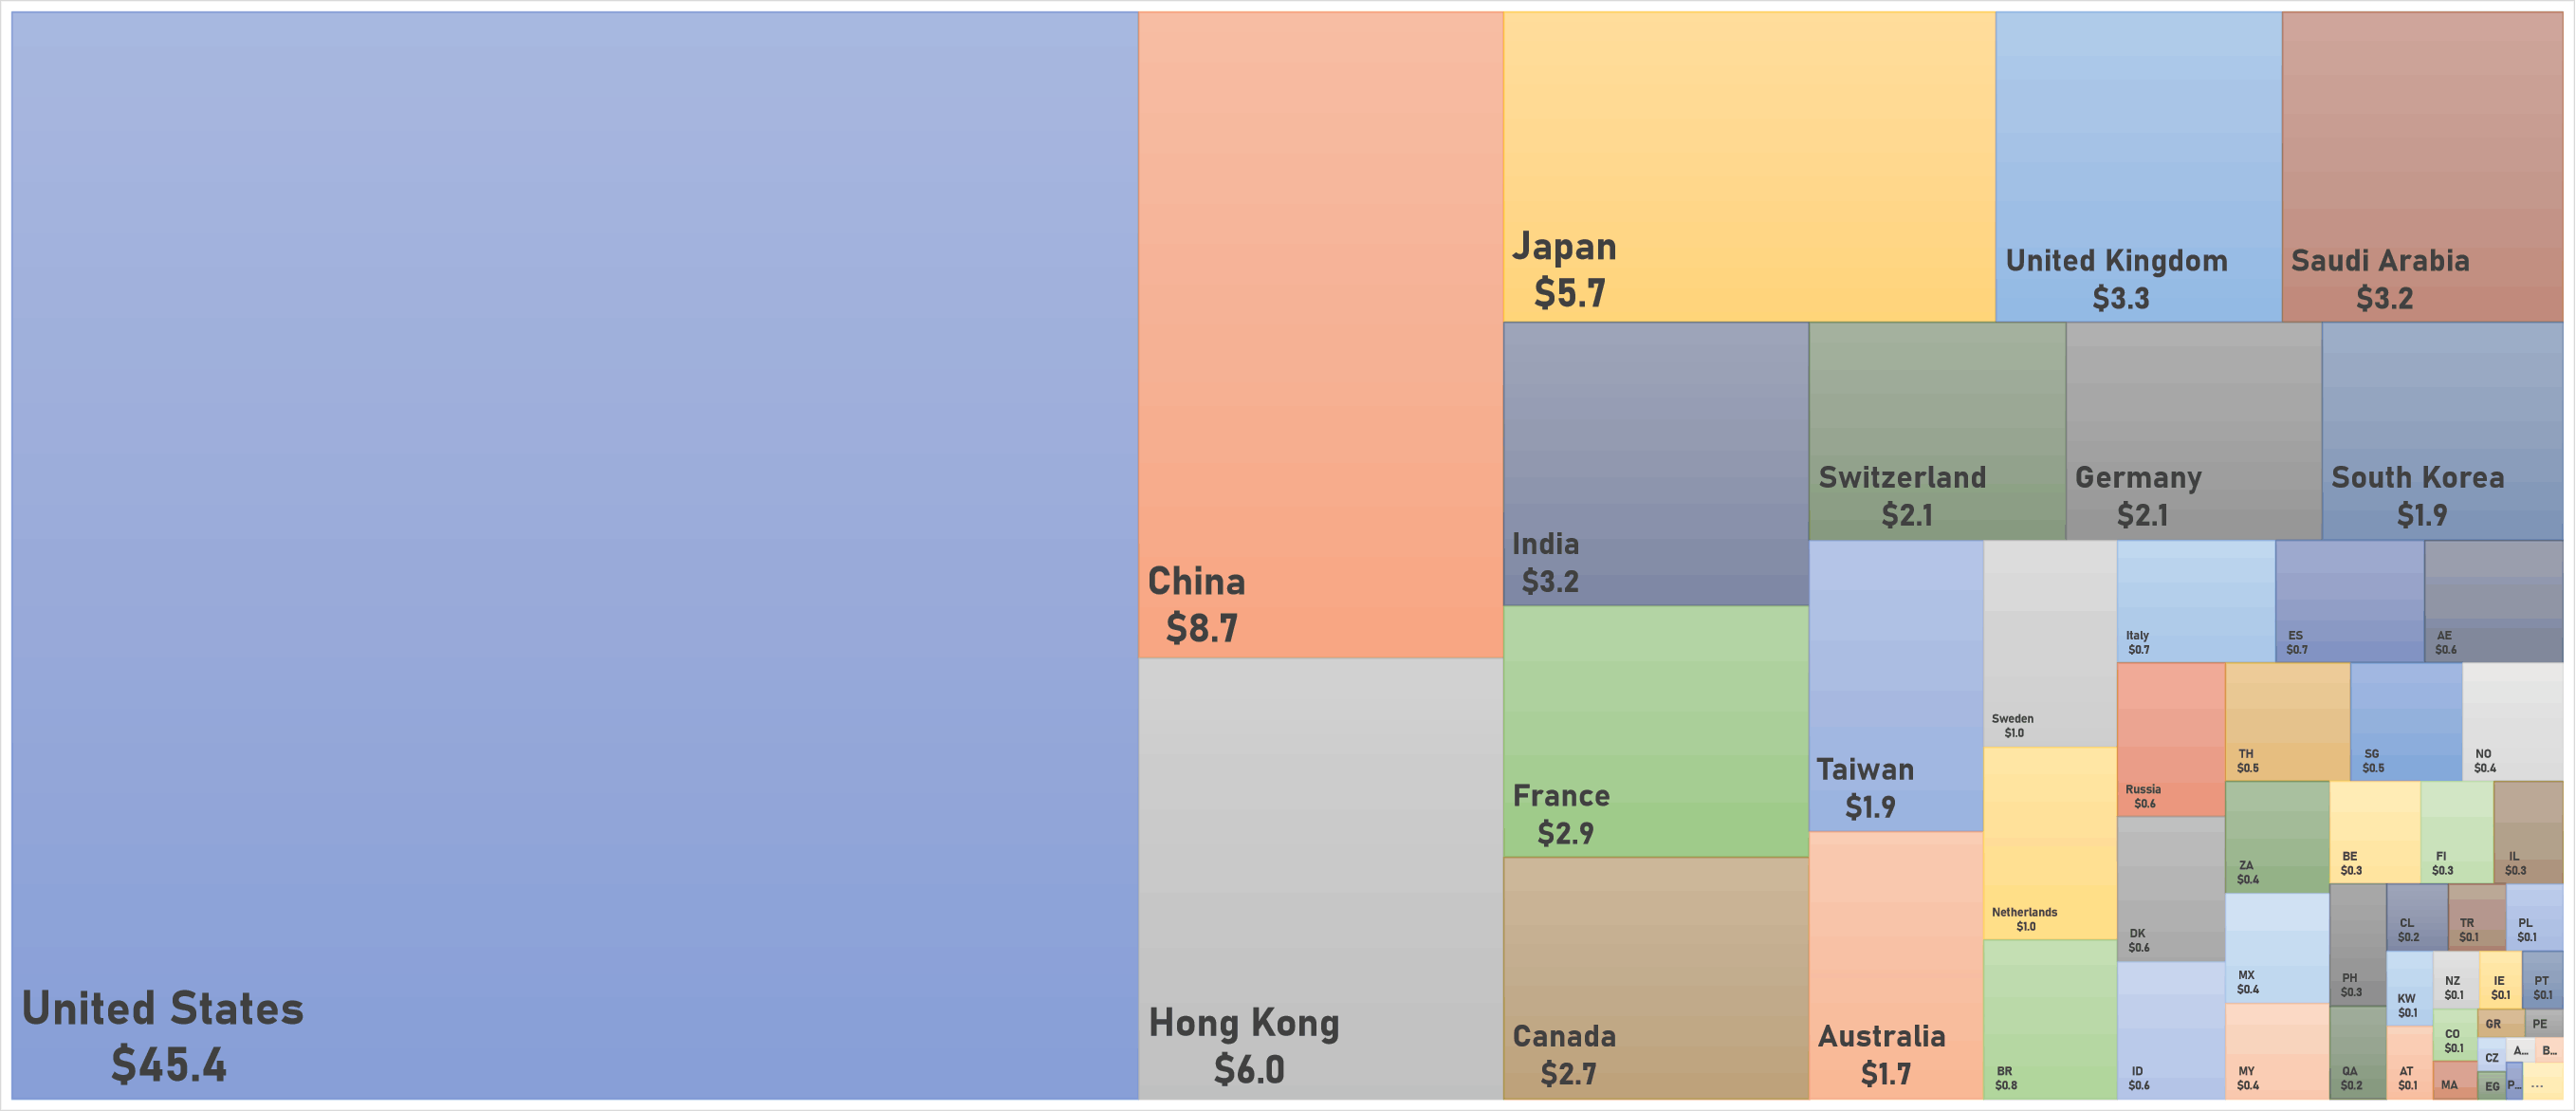
Sources: ϕpost, FactSet data