Equities
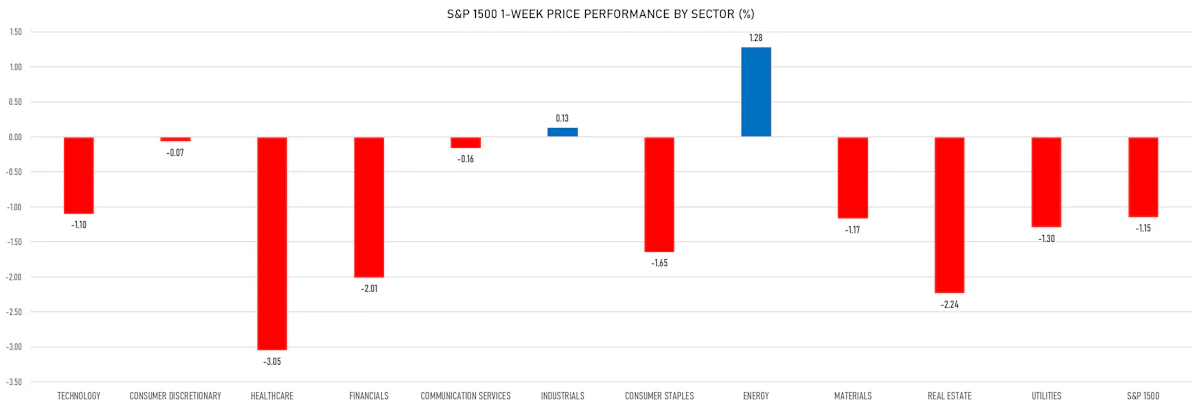
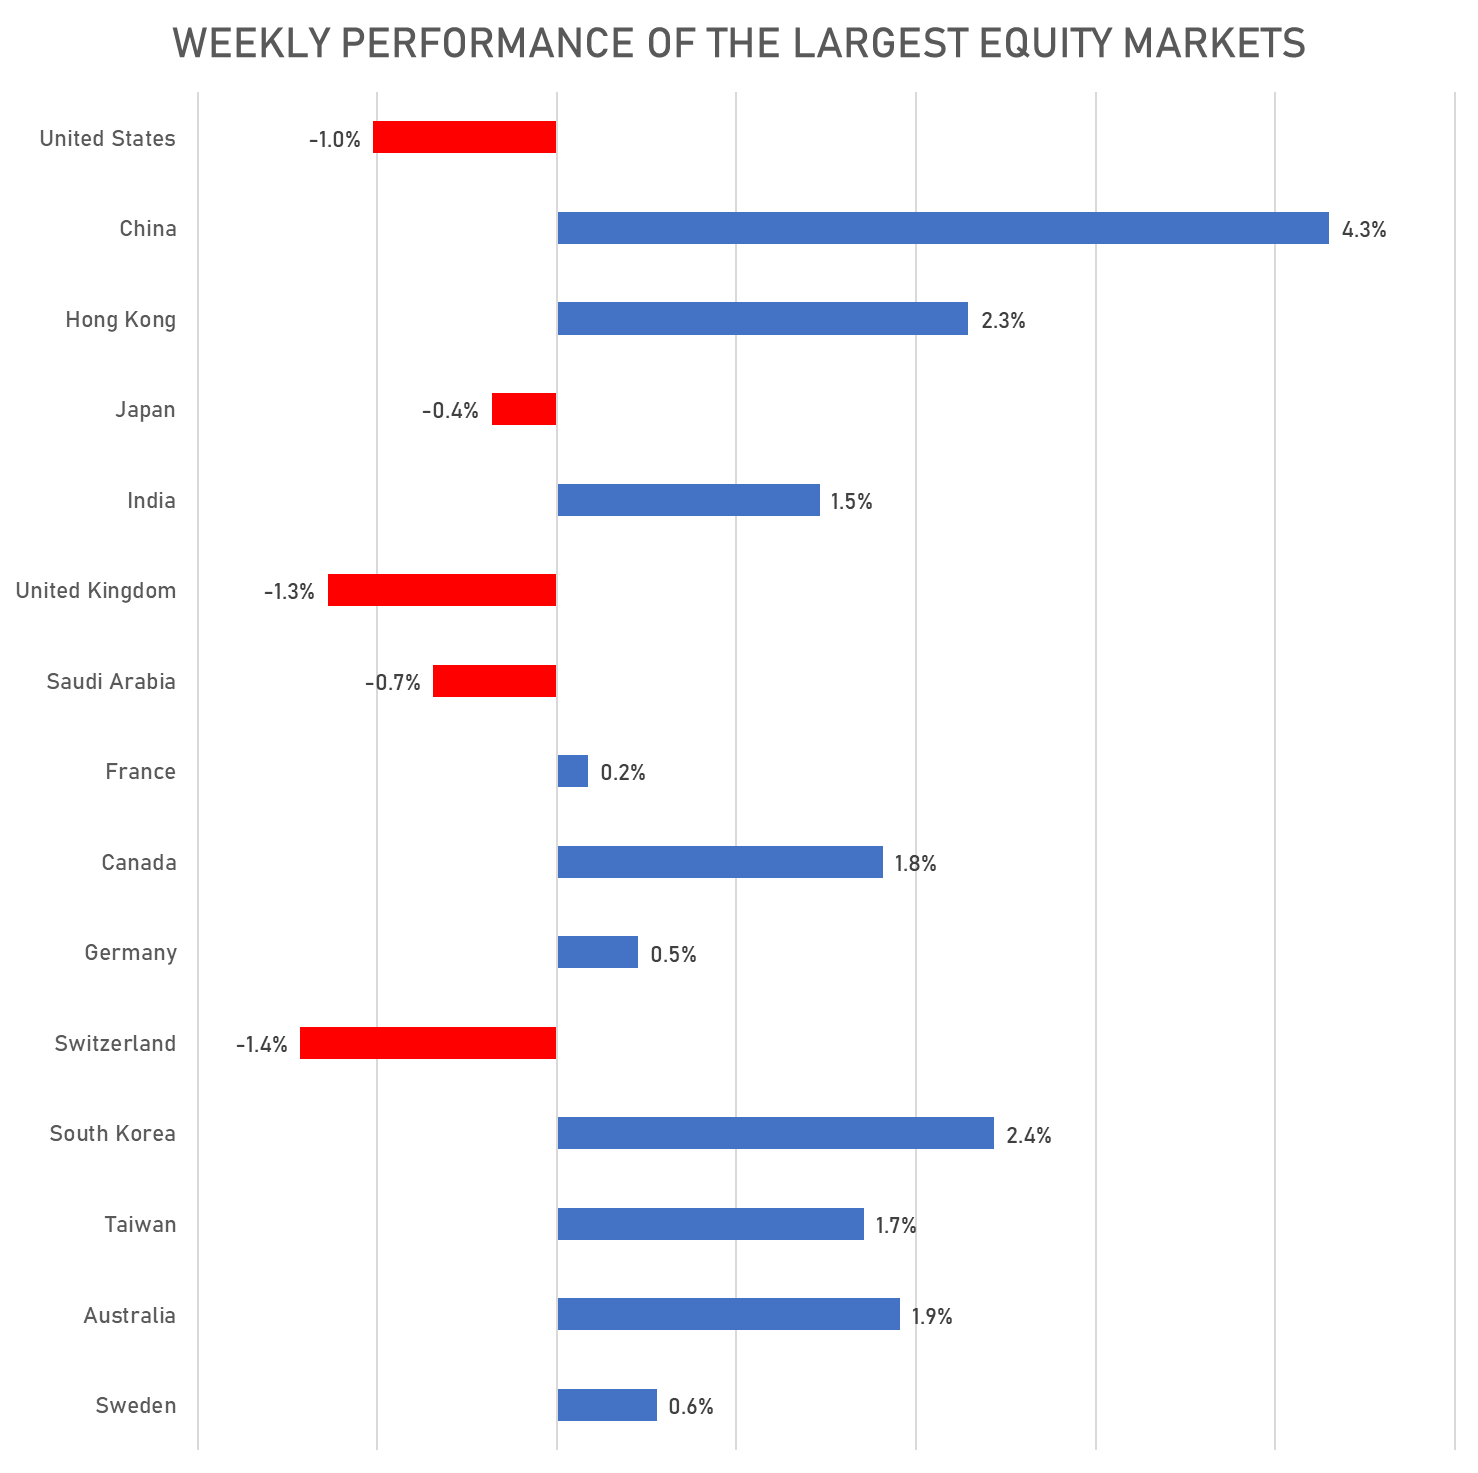
US Equities Fell This Week, With The Exception Of Energy Stocks, While Chinese Markets Jumped As Shanghai Reopened
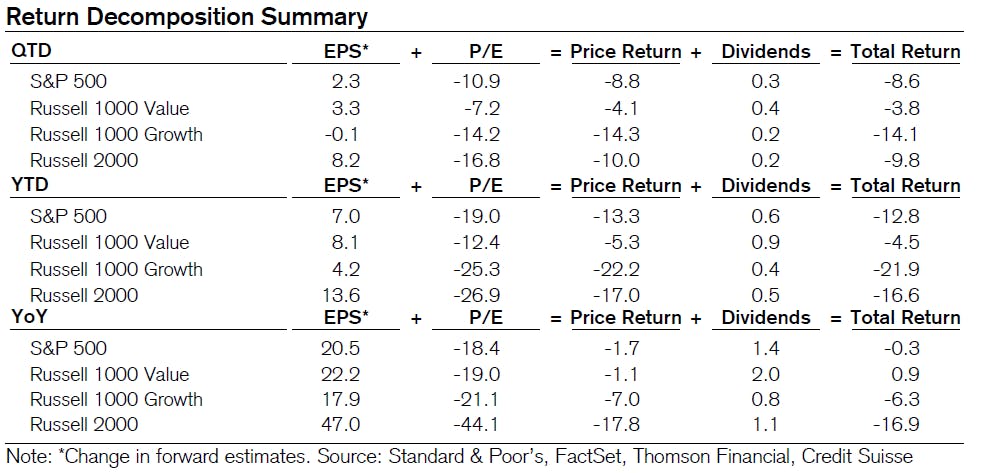
The S&P 500 total return this year through May is -12.8%: May was flat, value continued to overperform growth (1.9% vs. -2.3%), with the energy sector delivering 15.8% returns last month (energy up 58.5% YTD)
Published ET
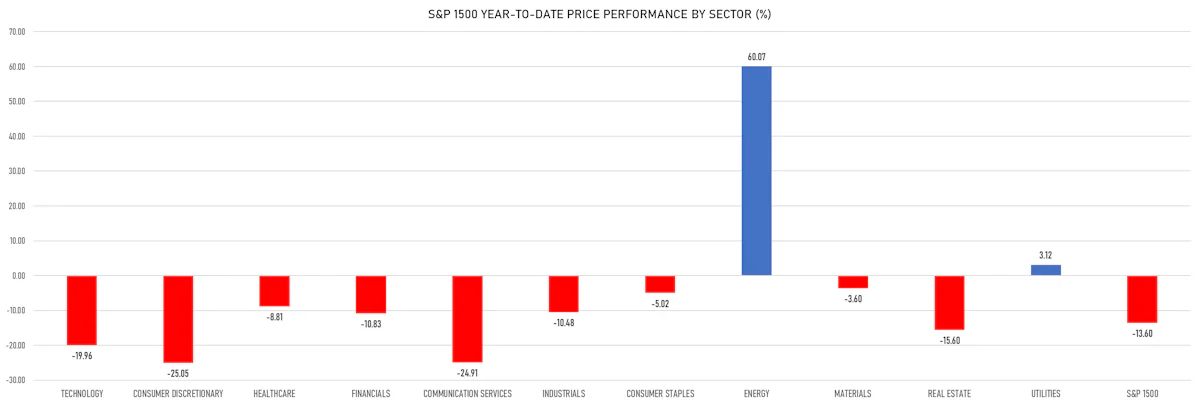
S&P 1500 Price Returns YTD on 3 June 2022 | Sources: ϕpost, Refinitiv data
DAILY SUMMARY
- Performance of US indices: S&P 500 down -1.63%; Nasdaq Composite down -2.47%; Wilshire 5000 down -1.62%
- 14.5% of S&P 500 stocks were up today, with 32.9% of stocks above their 200-day moving average (DMA) and 34.9% above their 50-DMA
- Top performing sectors in the S&P 500: energy up 1.40% and industrials down -0.36%
- Bottom performing sectors in the S&P 500: consumer discretionary down -2.85% and technology down -2.48%
- The number of shares in the S&P 500 traded today was 507m for a total turnover of US$ 60 bn
- The S&P 500 Value Index was down -0.9%, while the S&P 500 Growth Index was down -2.4%; the S&P small caps index was down -0.9% and mid-caps were down -1.1%
- The volume on CME's INX (S&P 500 Index) was 1.9m (3-month z-score: -1.6); the 3-month average volume is 2.6m and the 12-month range is 1.3 - 4.6m
- Performance of international indices: Europe Stoxx 600 down -0.26%; UK FTSE 100 down -0.98%; Hang Seng SH-SZ-HK 300 Index down -0.37%; Japan's TOPIX 500 up 0.34%
VOLATILITY TODAY
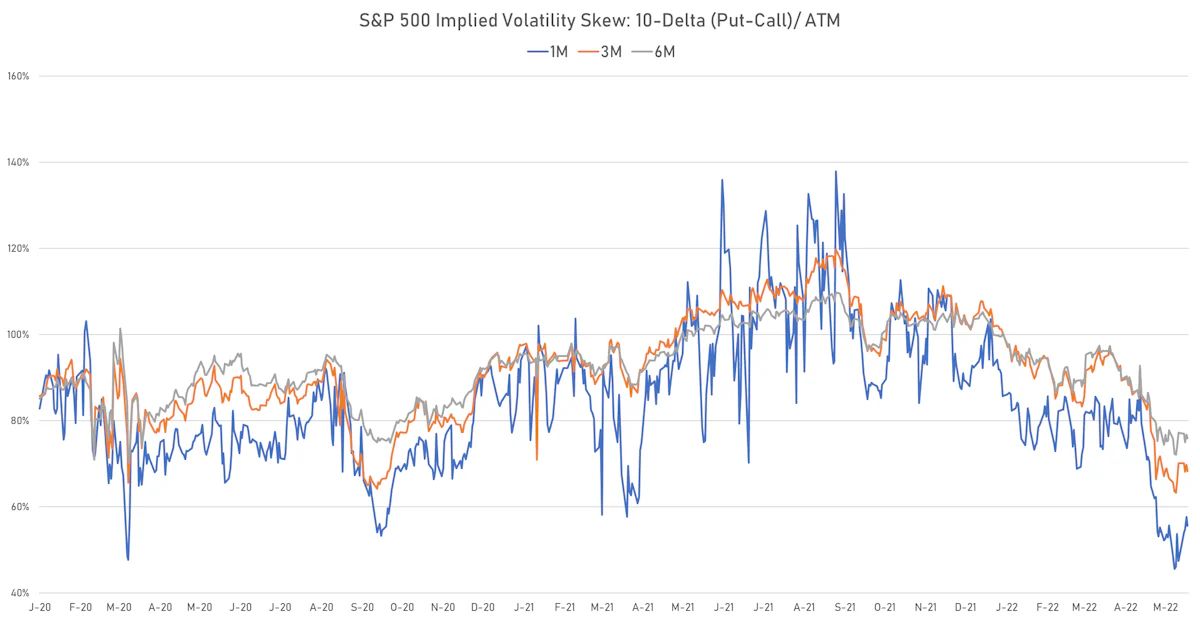
- 1-month at-the-money implied volatility on the S&P 500 at 21.4%, unchanged
- 1-month at-the-money implied volatility on the Europe Stoxx 600 at 18.1%, unchanged
TOP WINNERS TODAY
- Turning Point Therapeutics Inc (TPTX), up 118.4% to $74.59 / YTD price return: +56.4% / 12-Month Price Range: $ 23.77-83.06 / Short interest (% of float): 8.3%; days to cover: 5.4
- Iovance Biotherapeutics Inc (IOVA), up 18.9% to $7.85 / YTD price return: -58.9% / 12-Month Price Range: $ 6.18-28.00 / Short interest (% of float): 11.9%; days to cover: 7.5
- Qurate Retail Inc (QRTEB), up 14.9% to $5.08 / YTD price return: -33.2% / 12-Month Price Range: $ 4.14-12.75 / Short interest (% of float): 0.4%; days to cover: 2.6
- Global Blue Group Holding Ltd (GB), up 14.8% to $5.74 / YTD price return: -10.2% / 12-Month Price Range: $ 3.96-11.15 / Short interest (% of float): 0.3%; days to cover: 4.7
- StoneCo Ltd (STNE), up 13.2% to $11.80 / YTD price return: -30.0% / 12-Month Price Range: $ 6.81-71.08 / Short interest (% of float): 8.0%; days to cover: 2.4
- C3.ai Inc (AI), up 12.6% to $19.84 / YTD price return: -36.5% / 12-Month Price Range: $ 13.37-70.30 (the stock is currently on the short sale restriction list)
- MannKind Corp (MNKD), up 11.4% to $4.61 / YTD price return: +5.5% / 12-Month Price Range: $ 2.49-5.53
- Reata Pharmaceuticals Inc (RETA), up 10.9% to $31.71 / YTD price return: +20.3% / 12-Month Price Range: $ 20.24-153.41 / Short interest (% of float): 16.5%
BIGGEST LOSERS TODAY
- Novavax Inc (NVAX), down 20.0% to $44.76 / YTD price return: -68.7% / 12-Month Price Range: $ 41.33-277.80 (the stock is currently on the short sale restriction list)
- HashiCorp Inc (HCP), down 17.6% to $34.00 / YTD price return: -62.7% / 12-Month Price Range: $ 29.26-102.95 / Short interest (% of float): 30.6%; days to cover: 7.5 (the stock is currently on the short sale restriction list)
- MSP Recovery Inc (MSPR), down 14.3% to $1.02 / YTD price return: -89.8% / 12-Month Price Range: $ 1.09-11.70 (the stock is currently on the short sale restriction list)
- Solid Power Inc (SLDP), down 14.1% to $7.66 / YTD price return: -12.4% / 12-Month Price Range: $ 5.61-14.85 / Short interest (% of float): 2.7%; days to cover: 2.4 (the stock is currently on the short sale restriction list)
- Carvana Co (CVNA), down 11.8% to $26.52 / YTD price return: -88.6% / 12-Month Price Range: $ 25.26-376.83 (the stock is currently on the short sale restriction list)
- Kyndryl Holdings Inc (KD), down 11.4% to $11.45 / YTD price return: -36.7% / 12-Month Price Range: $ 9.93-52.00 / Short interest (% of float): 4.8%; days to cover: 4.5 (the stock is currently on the short sale restriction list)
- Shopify Inc (SHOP), down 11.3% to $353.66 / YTD price return: -74.3% / 12-Month Price Range: $ 308.06-1,762.92 / Short interest (% of float): 4.8%; days to cover: 1.2 (the stock is currently on the short sale restriction list)
- DraftKings Inc (DKNG), down 10.8% to $12.72 / YTD price return: -53.7% / 12-Month Price Range: $ 9.77-64.58 / Short interest (% of float): 12.5%; days to cover: 2.1 (the stock is currently on the short sale restriction list)
- Roblox Corp (RBLX), down 10.4% to $30.00 / YTD price return: -70.9% / 12-Month Price Range: $ 21.65-141.60 / Short interest (% of float): 7.0%; days to cover: 1.3 (the stock is currently on the short sale restriction list)
- BRP Inc (DOOO), down 10.4% to $71.69 / YTD price return: -18.3% / 12-Month Price Range: $ 57.38-102.96 / Short interest (% of float): 2.8%; days to cover: 7.8 (the stock is currently on the short sale restriction list)
US RETURNS DECOMPOSITION
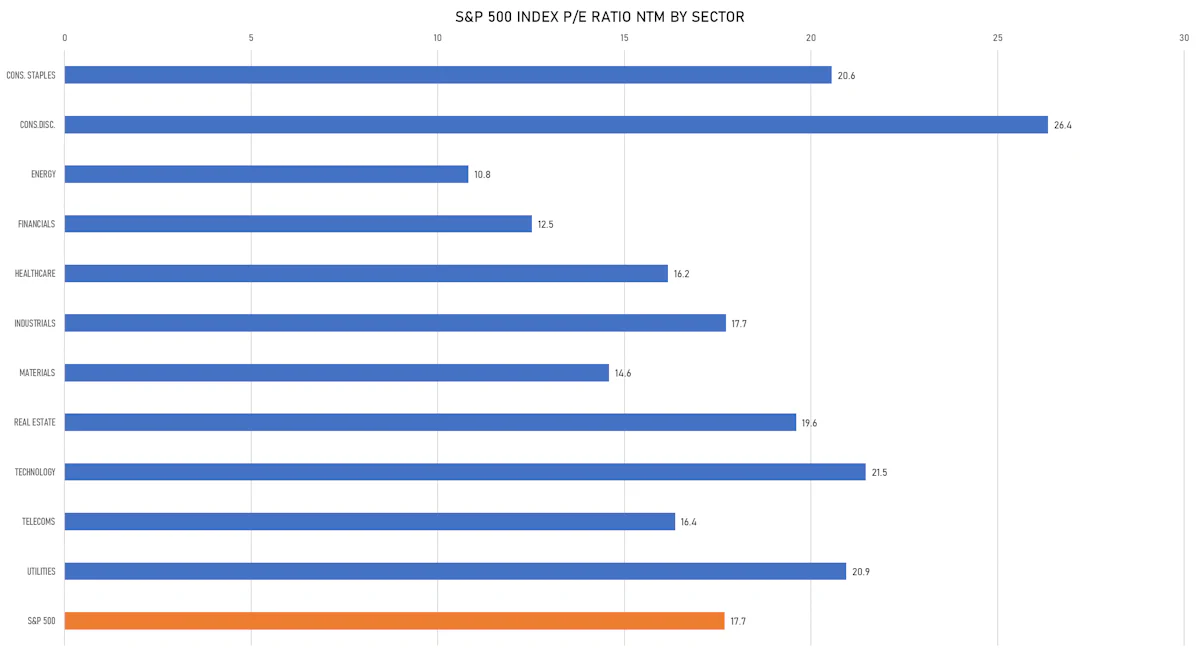
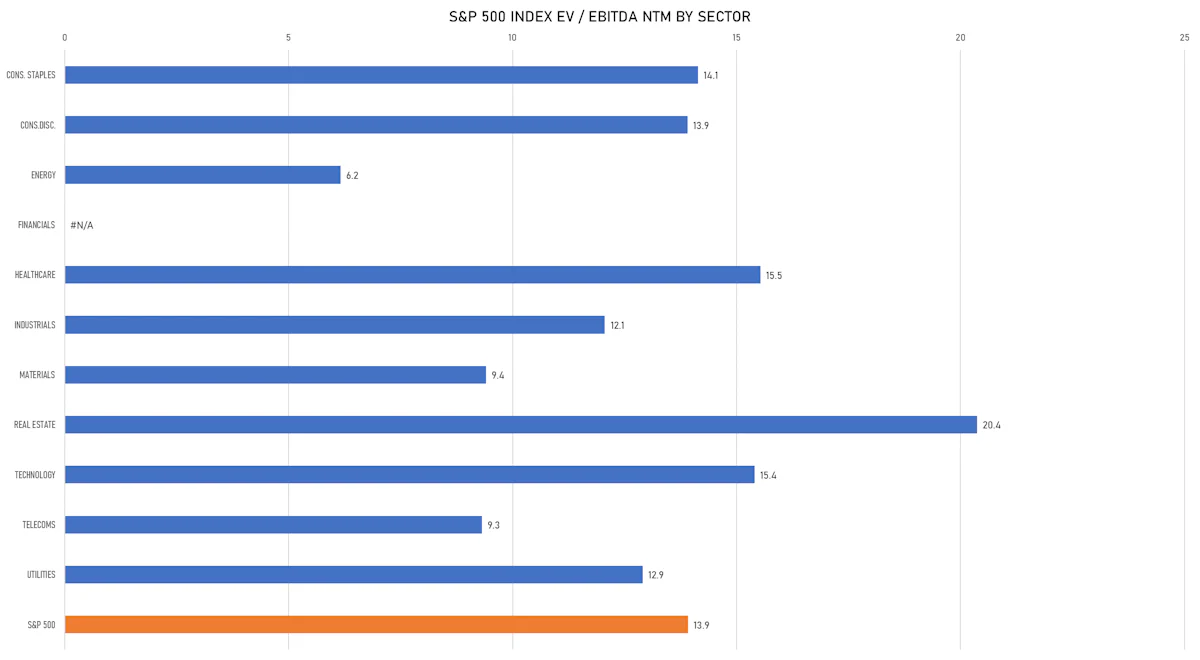
VALUATION MULTIPLES BY SECTORS
WEEKLY TOTAL RETURNS OF MAJOR GLOBAL EQUITY MARKETS
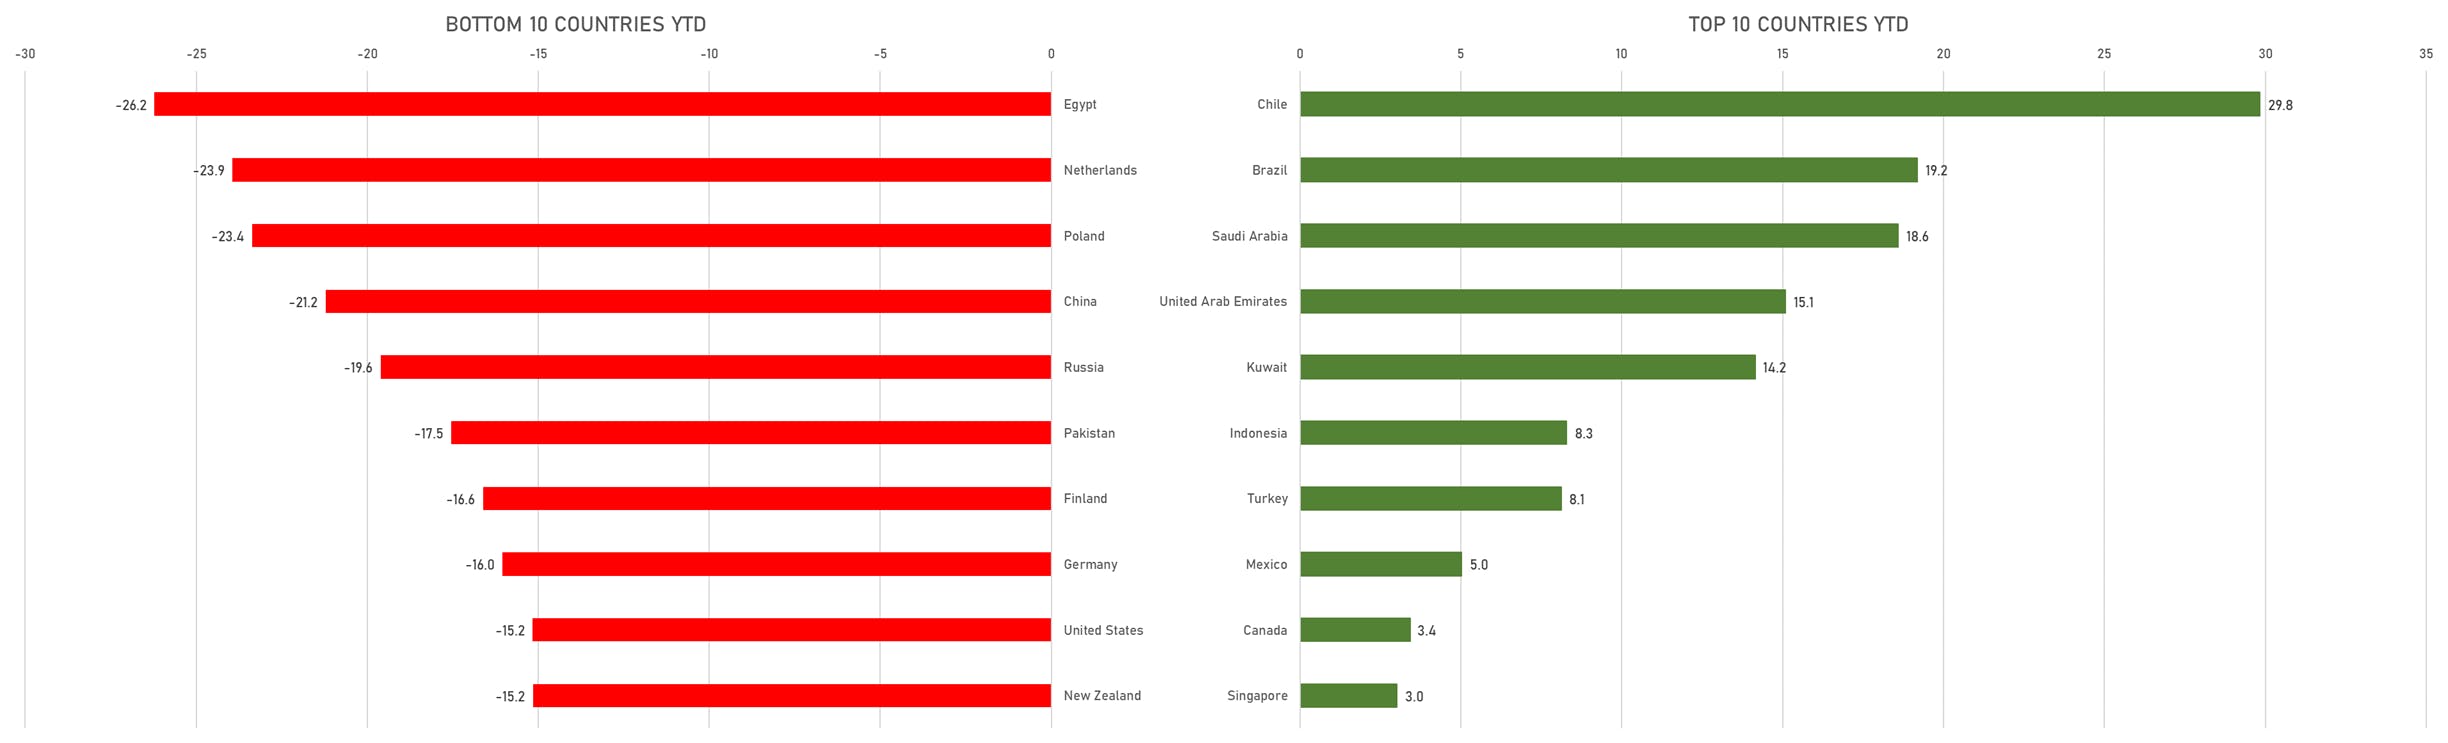
TOP / BOTTOM PERFORMING WORLD MARKETS YTD
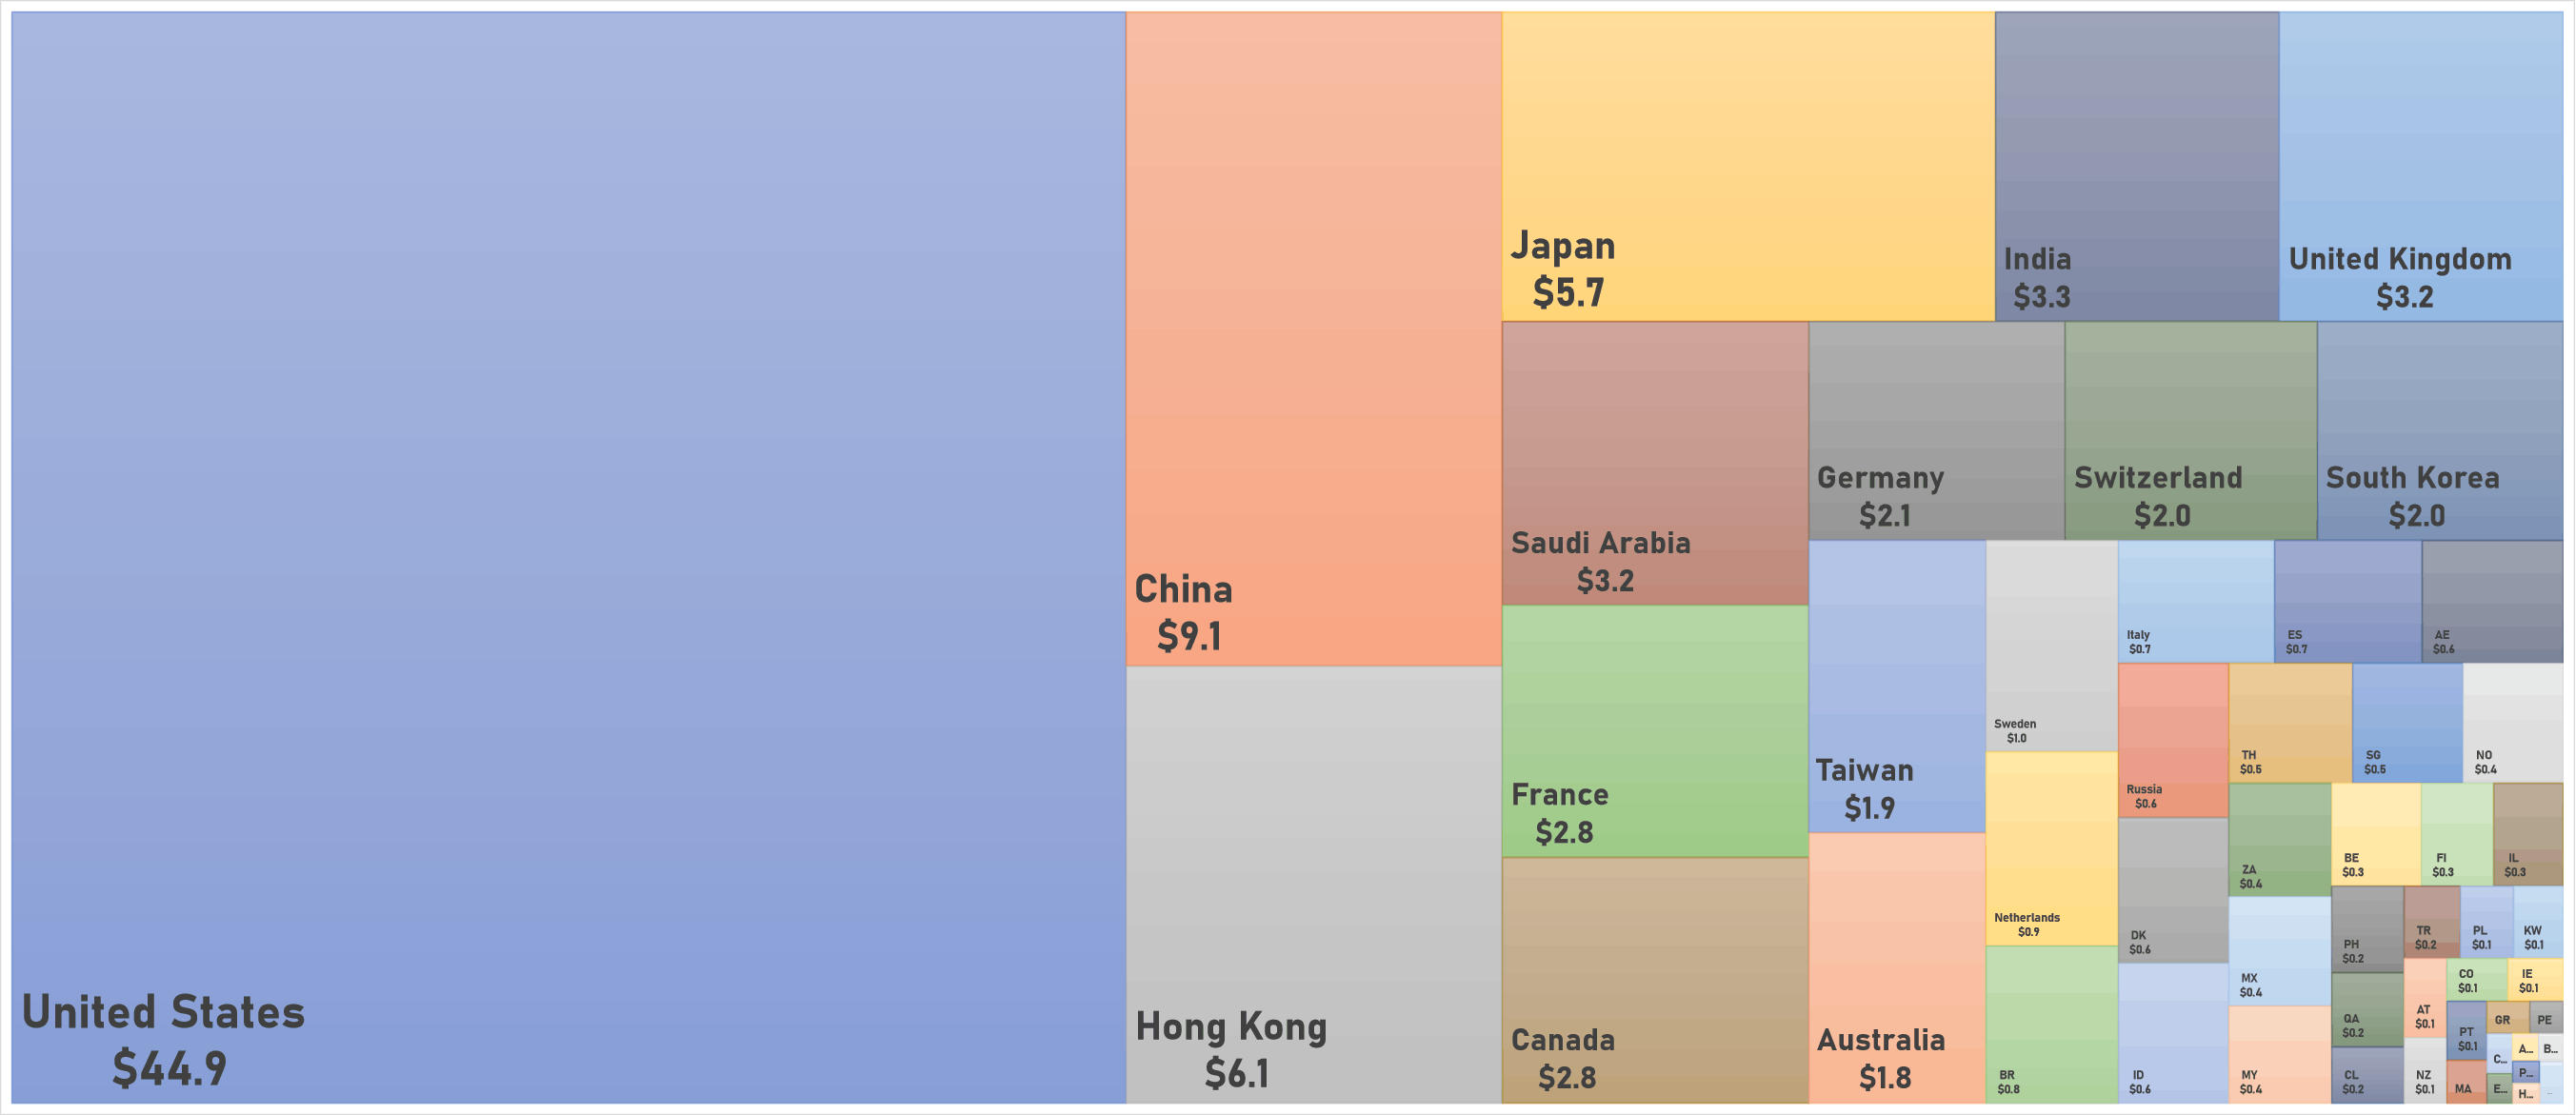
WORLD MARKET CAPITALIZATION (US$ Trillion)