Equities
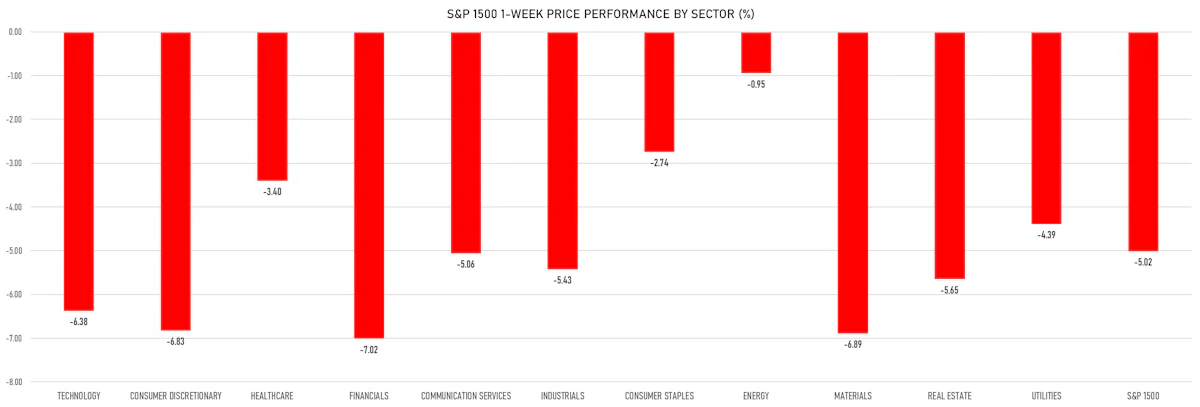
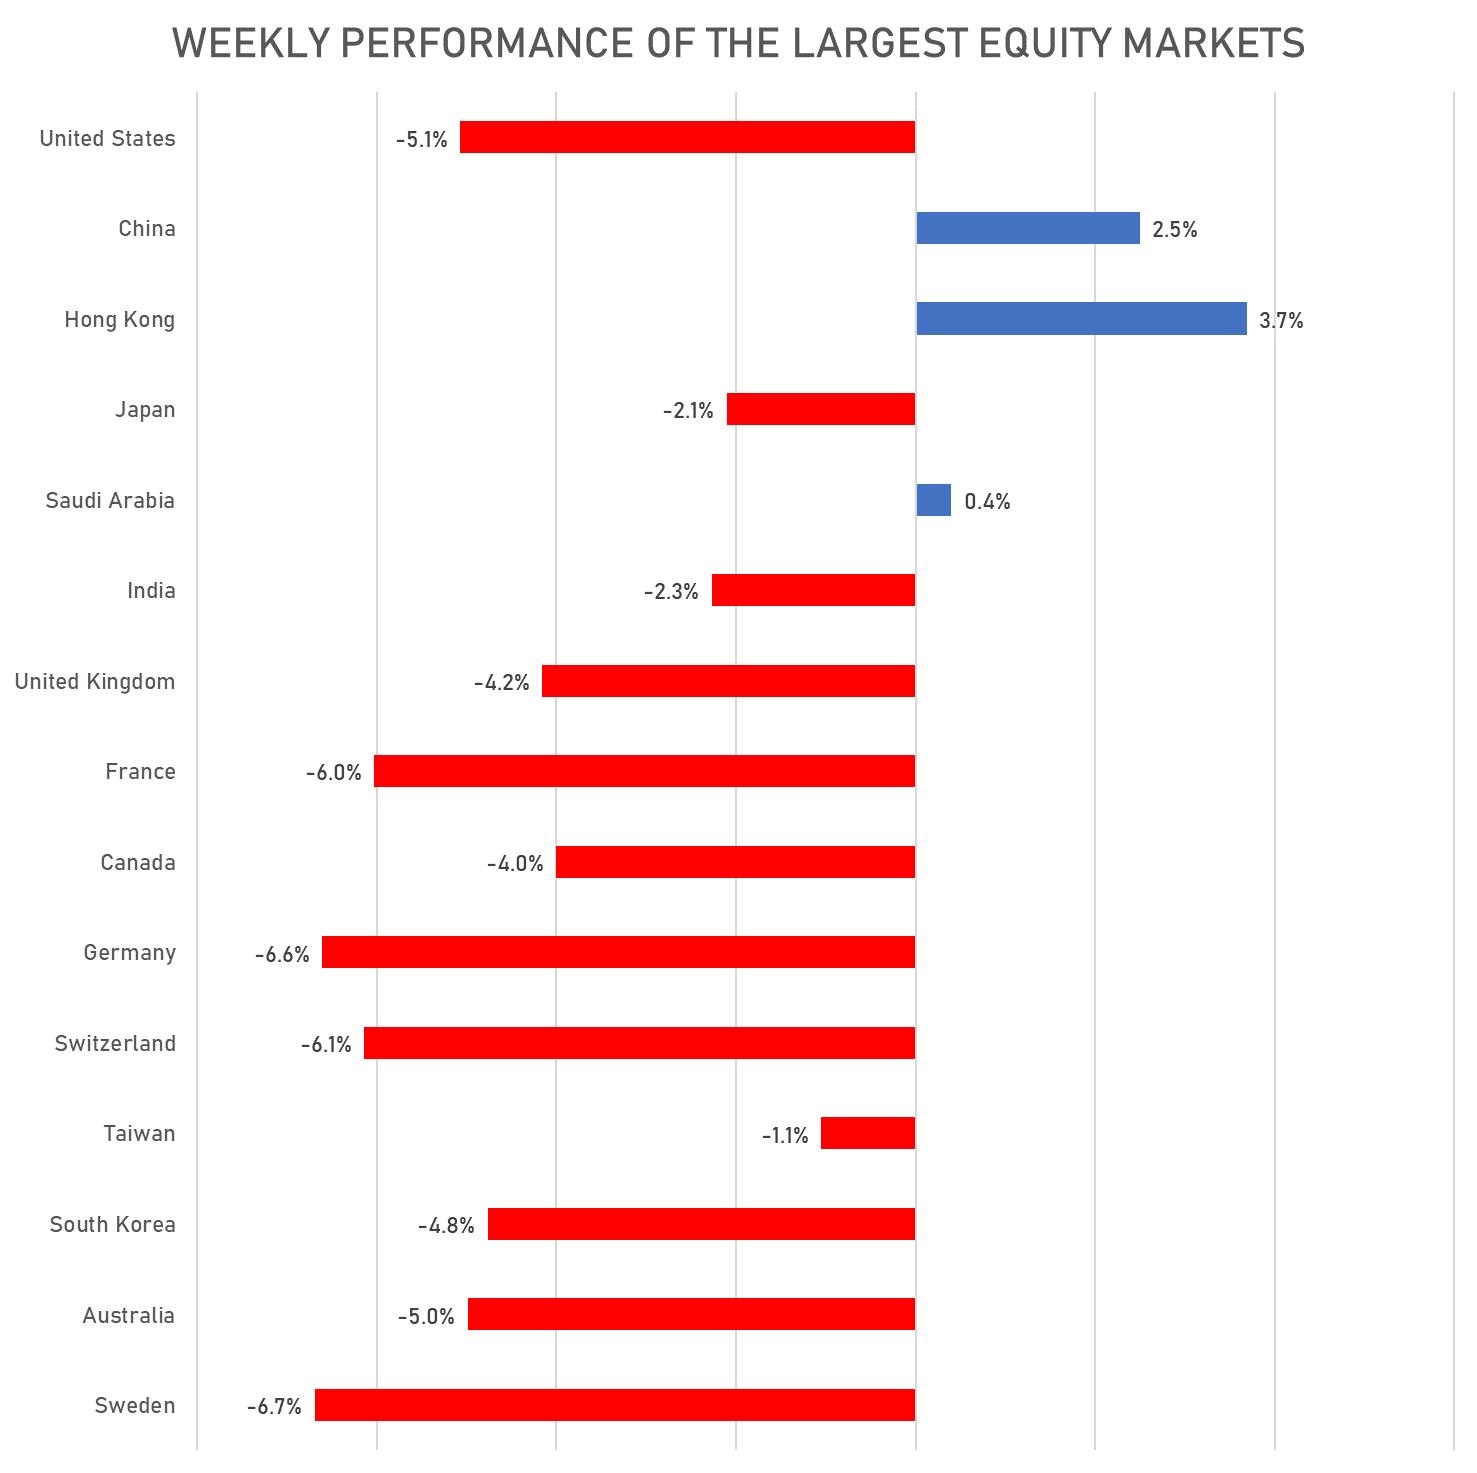
Chinese Stocks Continue To Rebound While US Equities Slide Again: S&P 500 Down 5.1%, NASDAQ Composite Down 5.6% For The Week
The dollar continues to strengthen, with the DX up 2% this week (and close to 9% YTD), and we're starting to see a number of global US corporates revise their earnings guidance lower because of it (most notably MSFT last week)
Published ET
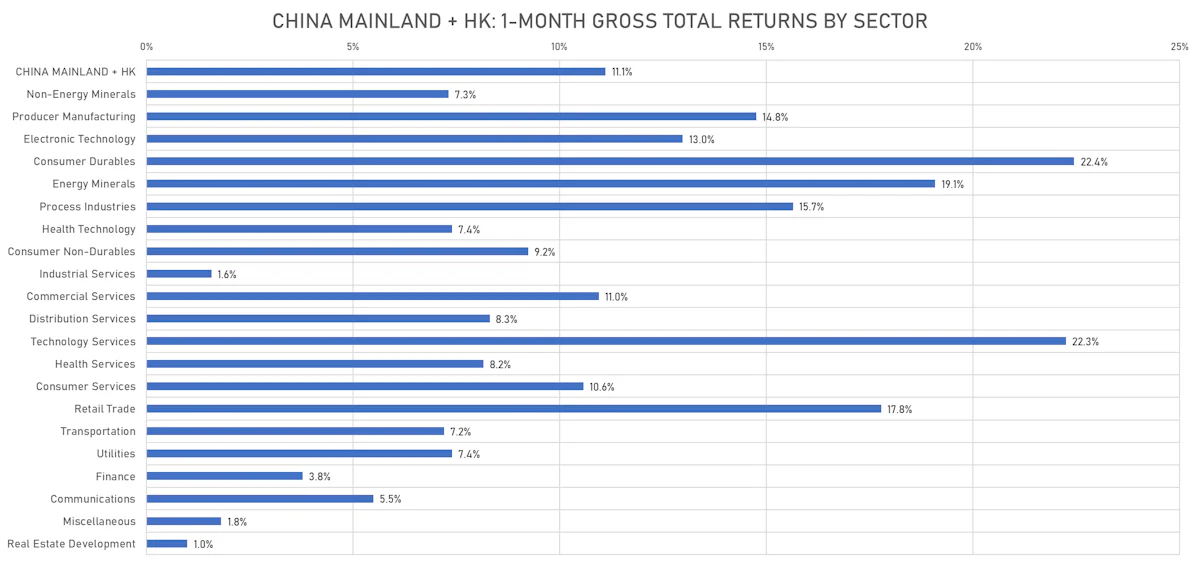
1-Month USD Total Returns For China Mainland + HK | Sources: ϕpost, Refinitiv data
DAILY SUMMARY
- Daily performance of US indices: S&P 500 down -2.91%; Nasdaq Composite down -3.52%; Wilshire 5000 down -2.97%
- 7.1% of S&P 500 stocks were up today, with 24.0% of stocks above their 200-day moving average (DMA) and 11.5% above their 50-DMA
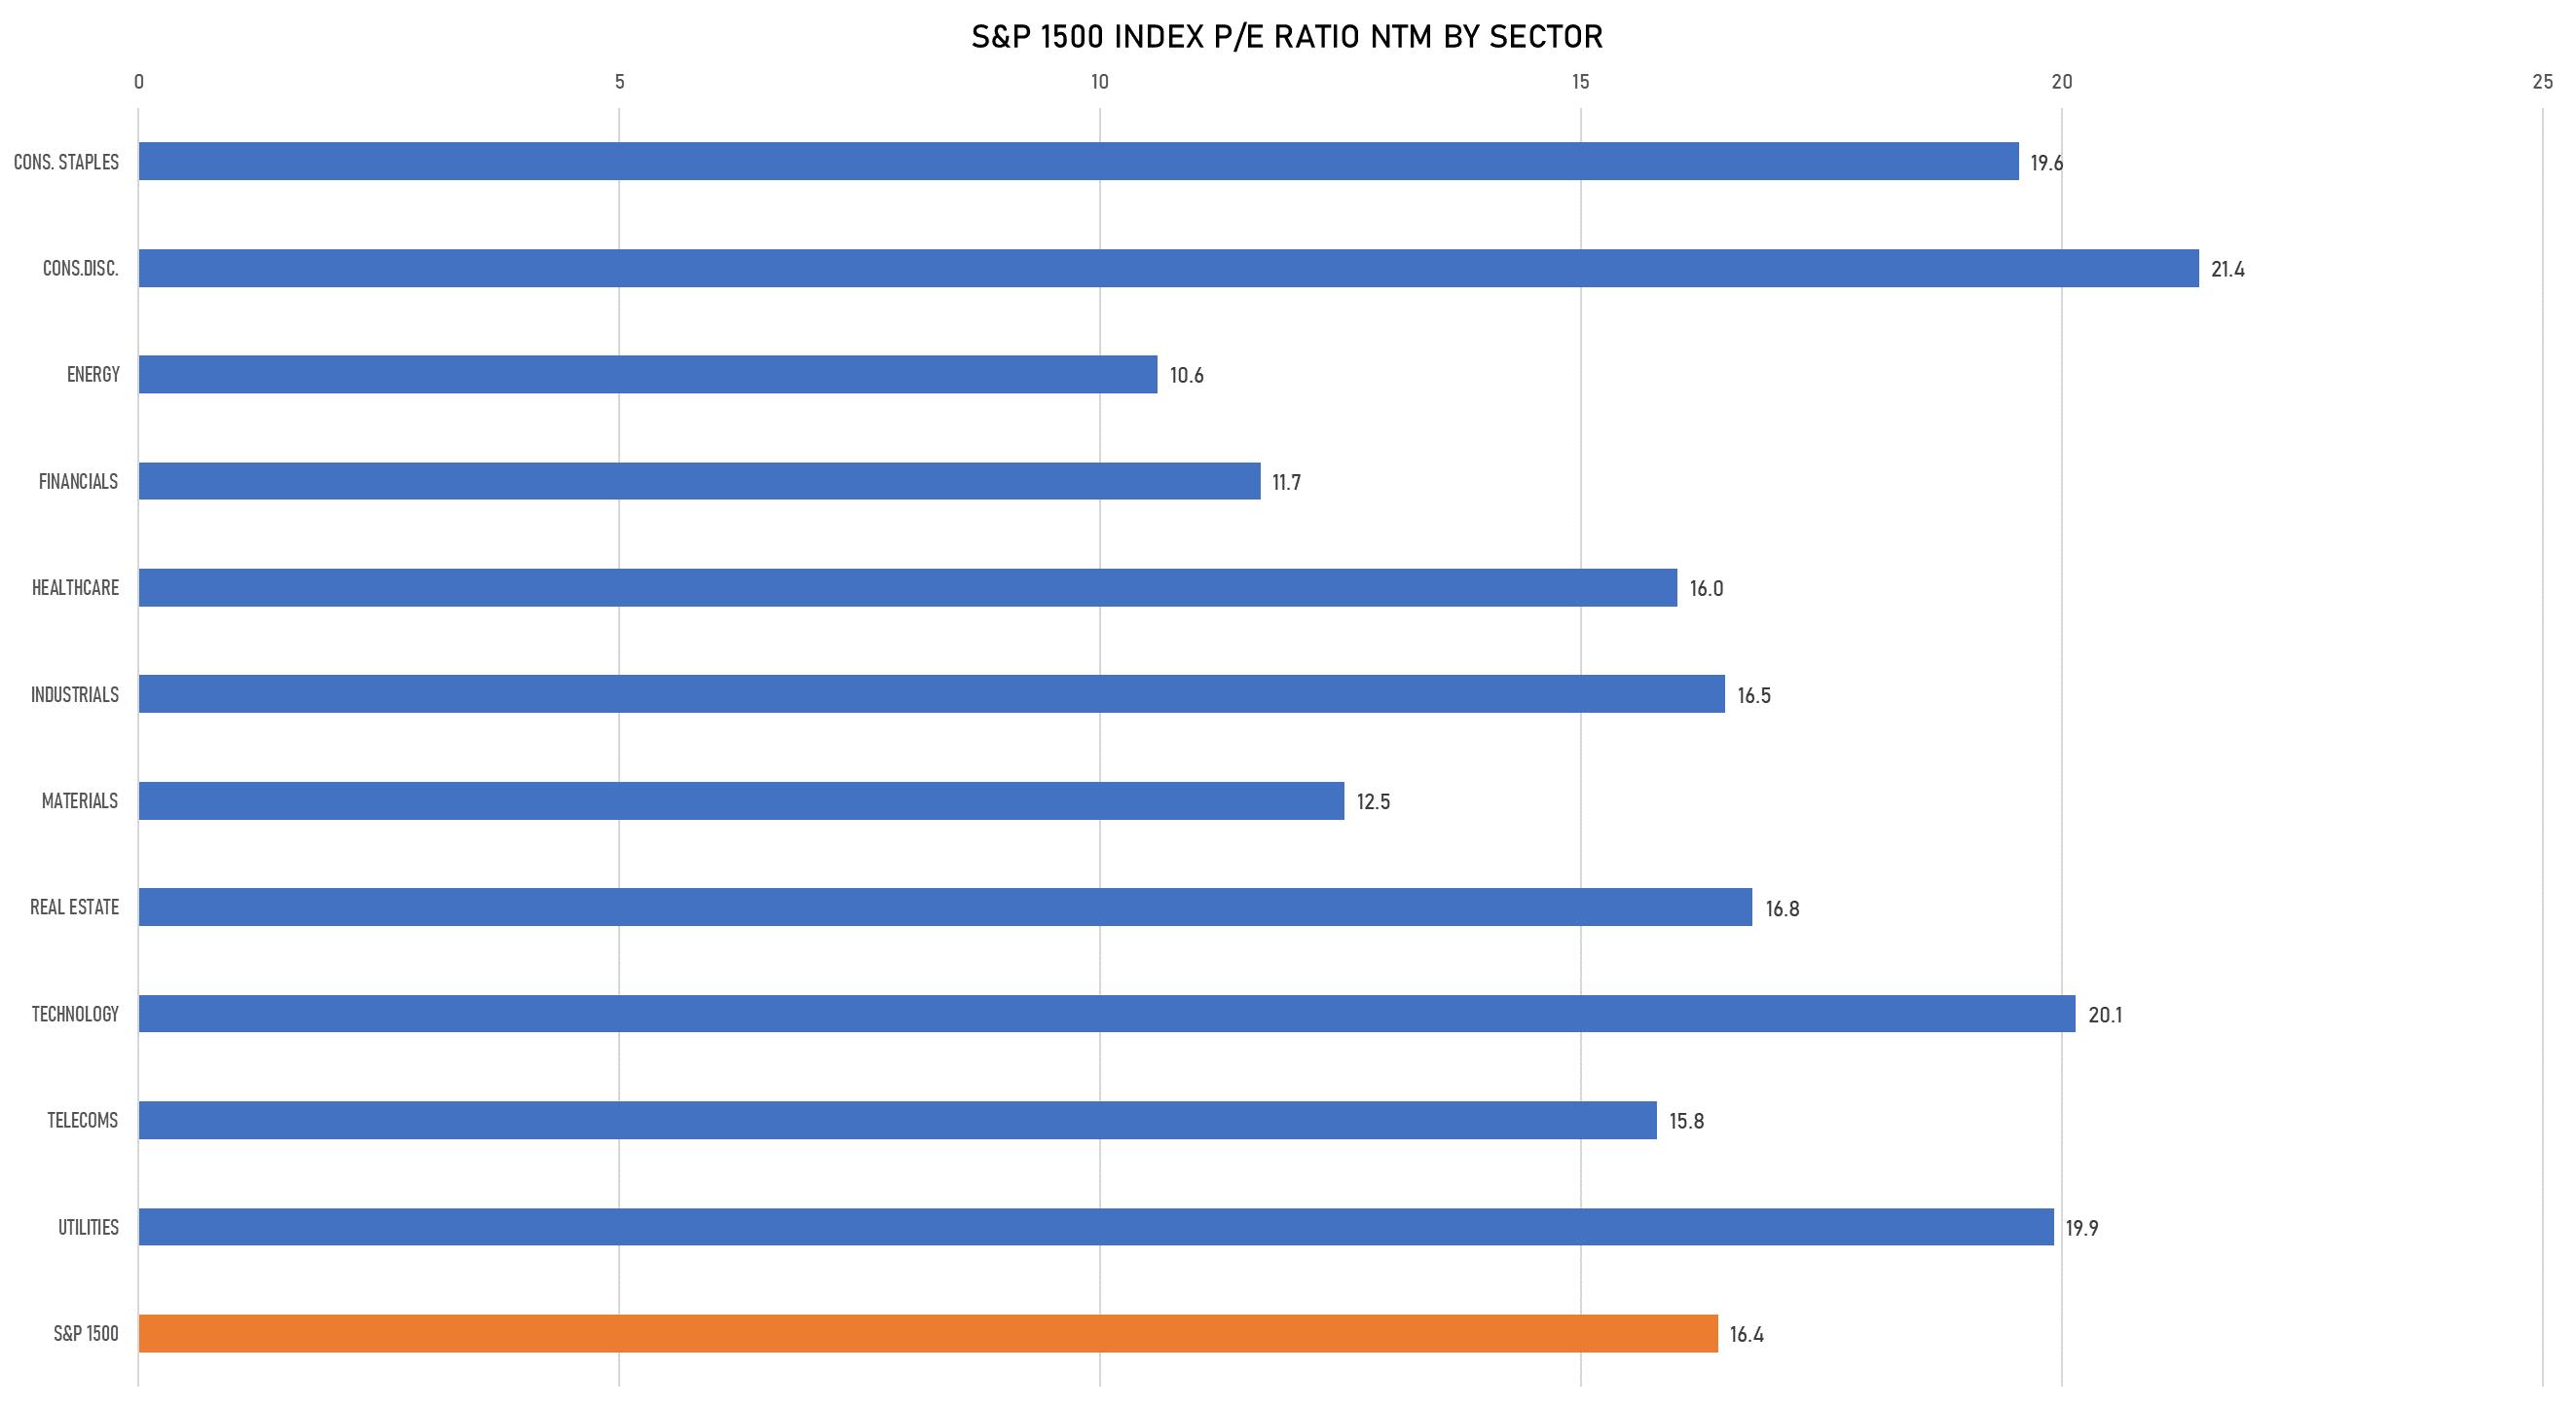
- Top performing sectors in the S&P 500: consumer staples down -0.37% and utilities down -0.77%
- Bottom performing sectors in the S&P 500: consumer discretionary down -4.16% and technology down -3.89%
- The number of shares in the S&P 500 traded today was 703m for a total turnover of US$ 73 bn
- The S&P 500 Value Index was down -2.2%, while the S&P 500 Growth Index was down -3.7%; the S&P small caps index was down -2.5% and mid-caps were down -2.7%
- The volume on CME's INX (S&P 500 Index) was 2.5m (3-month z-score: 0.0); the 3-month average volume is 2.5m and the 12-month range is 1.3 - 4.6m
- Daily performance of international indices: Europe Stoxx 600 down -2.69%; UK FTSE 100 down -2.12%; Hang Seng SH-SZ-HK 300 Index up 0.93%; Japan's TOPIX 500 down -1.31%
VOLATILITY TODAY
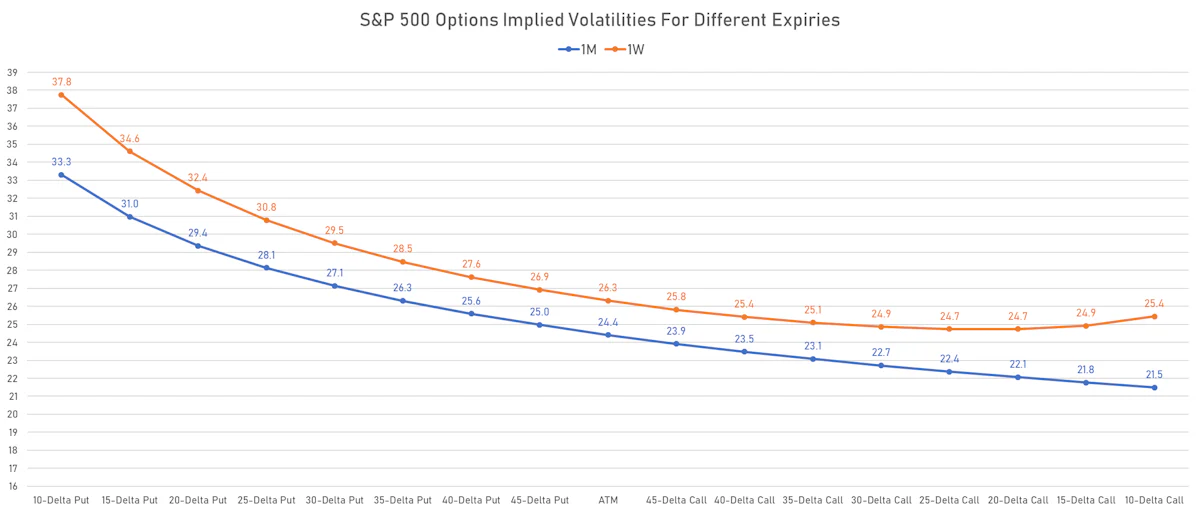
- 1-month at-the-money implied volatility on the S&P 500 at 24.4%, up from 22.9%
- 1-month at-the-money implied volatility on the Europe Stoxx 600 at 18.1%, down from 18.1%
TOP WINNERS TODAY
- TAL Education Group (TAL), up 13.0% to $4.70 / YTD price return: +19.6% / 12-Month Price Range: $ 1.60-33.08 / Short interest (% of float): 5.2%; days to cover: 2.9 (the stock is currently on the short sale restriction list)
- ProShares UltraPro Short QQQ (SQQQ), up 10.8% to $56.52 / YTD price return: +90.3% / 12-Month Price Range: $ 28.15-63.86 / Short interest (% of float): 14.9%; days to cover: 0.1
- New Oriental Education & Technology Group Inc (EDU), up 10.1% to $16.21 / YTD price return: -22.8% / 12-Month Price Range: $ 8.40-102.90 / Short interest (% of float): 8.3%; days to cover: 2.6 (the stock is currently on the short sale restriction list)
- Harmony Gold Mining Company Ltd (HMY), up 10.0% to $3.52 / YTD price return: -14.4% / 12-Month Price Range: $ 3.00-5.50 / Short interest (% of float): 1.8%; days to cover: 1.6
- Gold Fields Ltd (GFI), up 9.3% to $10.19 / YTD price return: -7.3% / 12-Month Price Range: $ 7.75-17.20 / Short interest (% of float): 1.3%; days to cover: 1.5
- ProShares Ultra VIX Short-Term Futures ETF (UVXY), up 9.2% to $14.79 / YTD price return: +19.1% / 12-Month Price Range: $ 11.16-38.74 / Short interest (% of float): 17.8%; days to cover: 0.1
- IAMGOLD Corp (IAG), up 7.4% to $2.32 / YTD price return: -25.9% / 12-Month Price Range: $ 1.96-3.79 / Short interest (% of float): 4.3%; days to cover: 1.7
BIGGEST LOSERS TODAY
- DocuSign Inc (DOCU), down 24.5% to $65.93 / YTD price return: -56.7% / 12-Month Price Range: $ 64.84-314.76 (the stock is currently on the short sale restriction list)
- Blueprint Medicines Corp (BPMC), down 18.2% to $48.07 / YTD price return: -55.1% / 12-Month Price Range: $ 50.96-117.86 (the stock is currently on the short sale restriction list)
- WeWork Inc (WE), down 17.2% to $5.96 / YTD price return: -30.7% / 12-Month Price Range: $ 4.50-14.97 / Short interest (% of float): 10.3%; days to cover: 9.5 (the stock is currently on the short sale restriction list)
- Fate Therapeutics Inc (FATE), down 15.6% to $19.81 / YTD price return: -66.1% / 12-Month Price Range: $ 20.49-97.43 (the stock is currently on the short sale restriction list)
- Intellia Therapeutics Inc (NTLA), down 15.3% to $42.45 / YTD price return: -64.1% / 12-Month Price Range: $ 38.85-202.73 (the stock is currently on the short sale restriction list)
- Valneva SE (VALN), down 14.9% to $20.00 / YTD price return: -64.0% / 12-Month Price Range: $ 19.45-67.84 / Short interest (% of float): 0.1%; days to cover: 2.6 (the stock is currently on the short sale restriction list)
- Opendoor Technologies Inc (OPEN), down 14.8% to $5.70 / YTD price return: -61.0% / 12-Month Price Range: $ 5.15-25.33 (the stock is currently on the short sale restriction list)
- Nutex Health Inc (NUTX), down 14.4% to $7.06 / YTD price return: +71.4% / 12-Month Price Range: $ 1.86-52.80 / Short interest (% of float): 0.1%; days to cover: 0.1 (the stock is currently on the short sale restriction list)
- Freshworks Inc (FRSH), down 13.8% to $12.35 / YTD price return: -53.0% / 12-Month Price Range: $ 12.91-53.36 / Short interest (% of float): 12.9% (the stock is currently on the short sale restriction list)
- Cvent Holding Corp (CVT), down 13.5% to $4.09 / YTD price return: -49.9% / 12-Month Price Range: $ 4.20-10.96 / Short interest (% of float): 1.1%; days to cover: 2.9 (the stock is currently on the short sale restriction list)
FORWARD P/E BY SECTOR
WEEKLY TOTAL RETURNS OF MAJOR GLOBAL EQUITY MARKETS
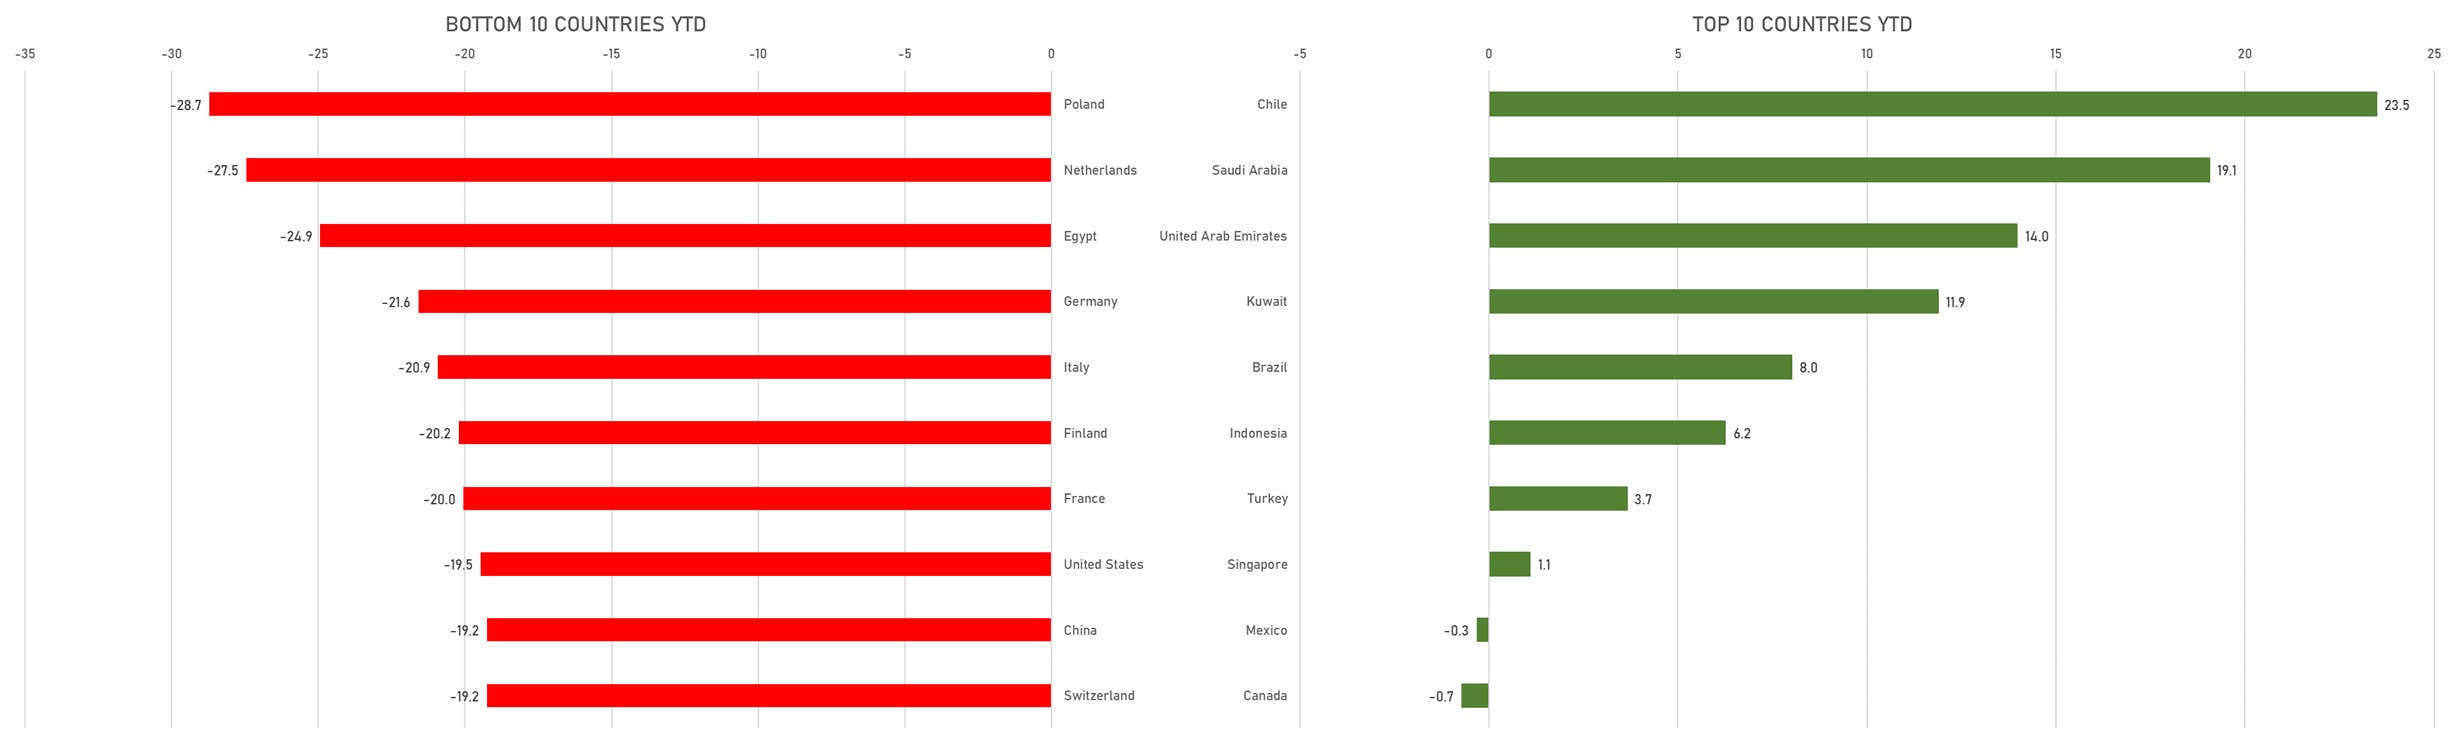
TOP / BOTTOM PERFORMING WORLD MARKETS YTD
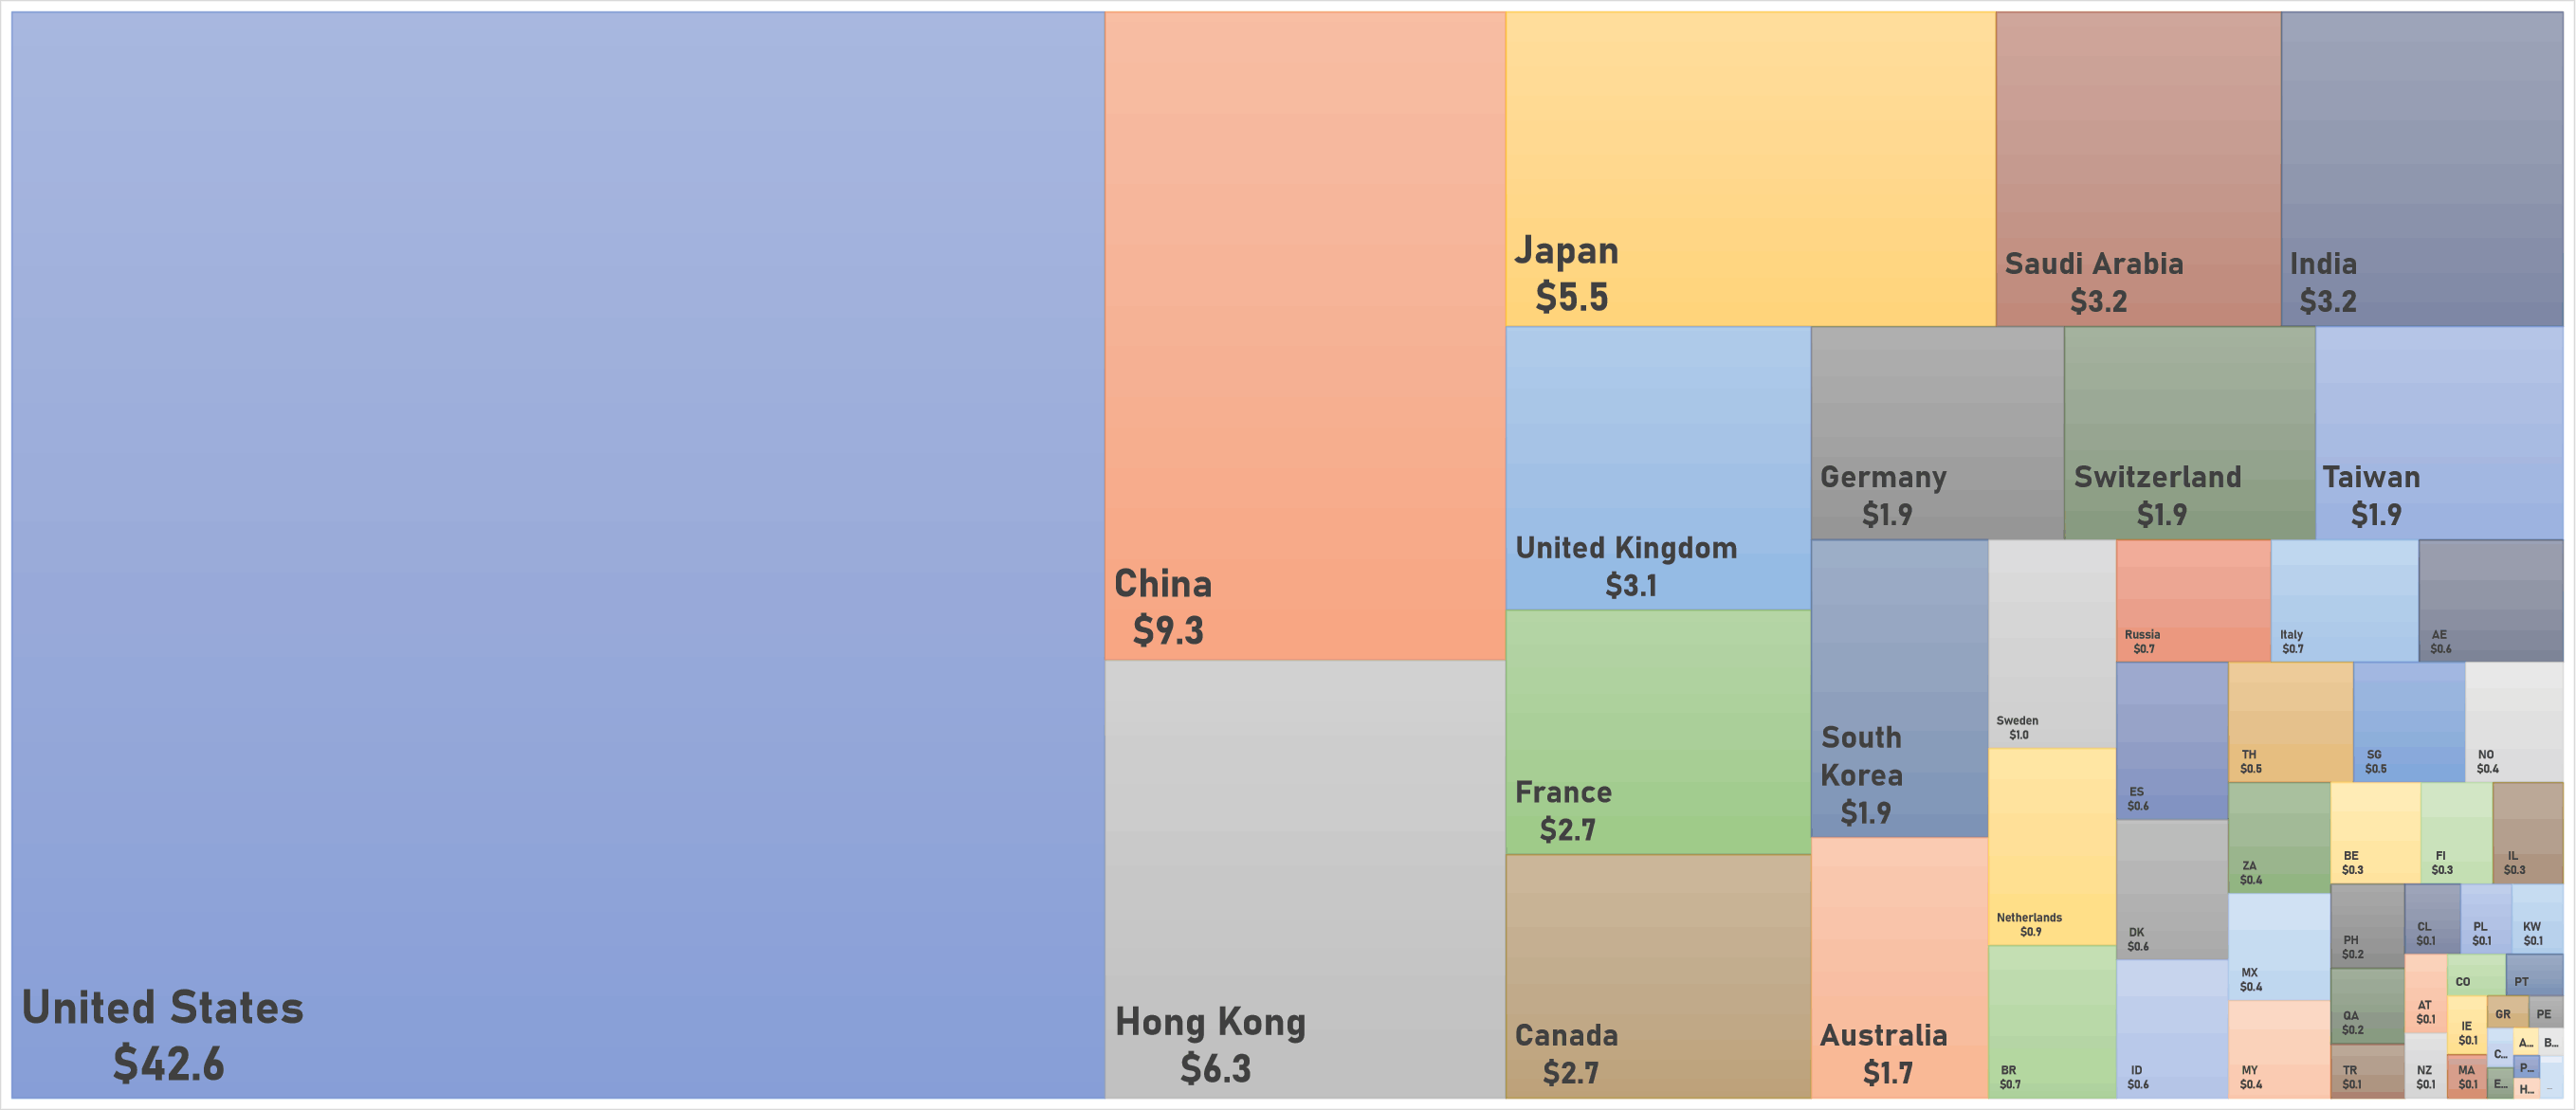
WORLD MARKET CAPITALIZATION (US$ Trillion)