Equities
Global Equities Have Already Lost Over $24 Trillion In Market Capitalization Since A High Of $120 Trillion Late Last Year, But The Bottom Of The Current Cycle Is Likely Lower
Considering the potential for continued volatility in rates, with both economic and geopolitical risks, it doesn't seem unreasonable to expect a deeper drawdown for US equities before things stabilize
Published ET
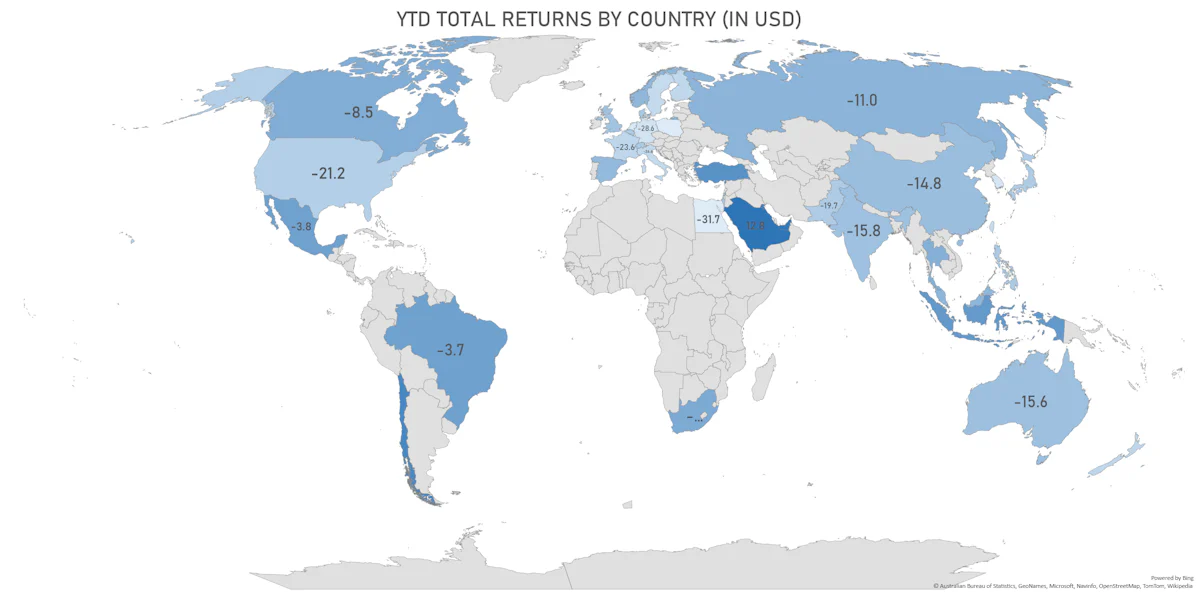
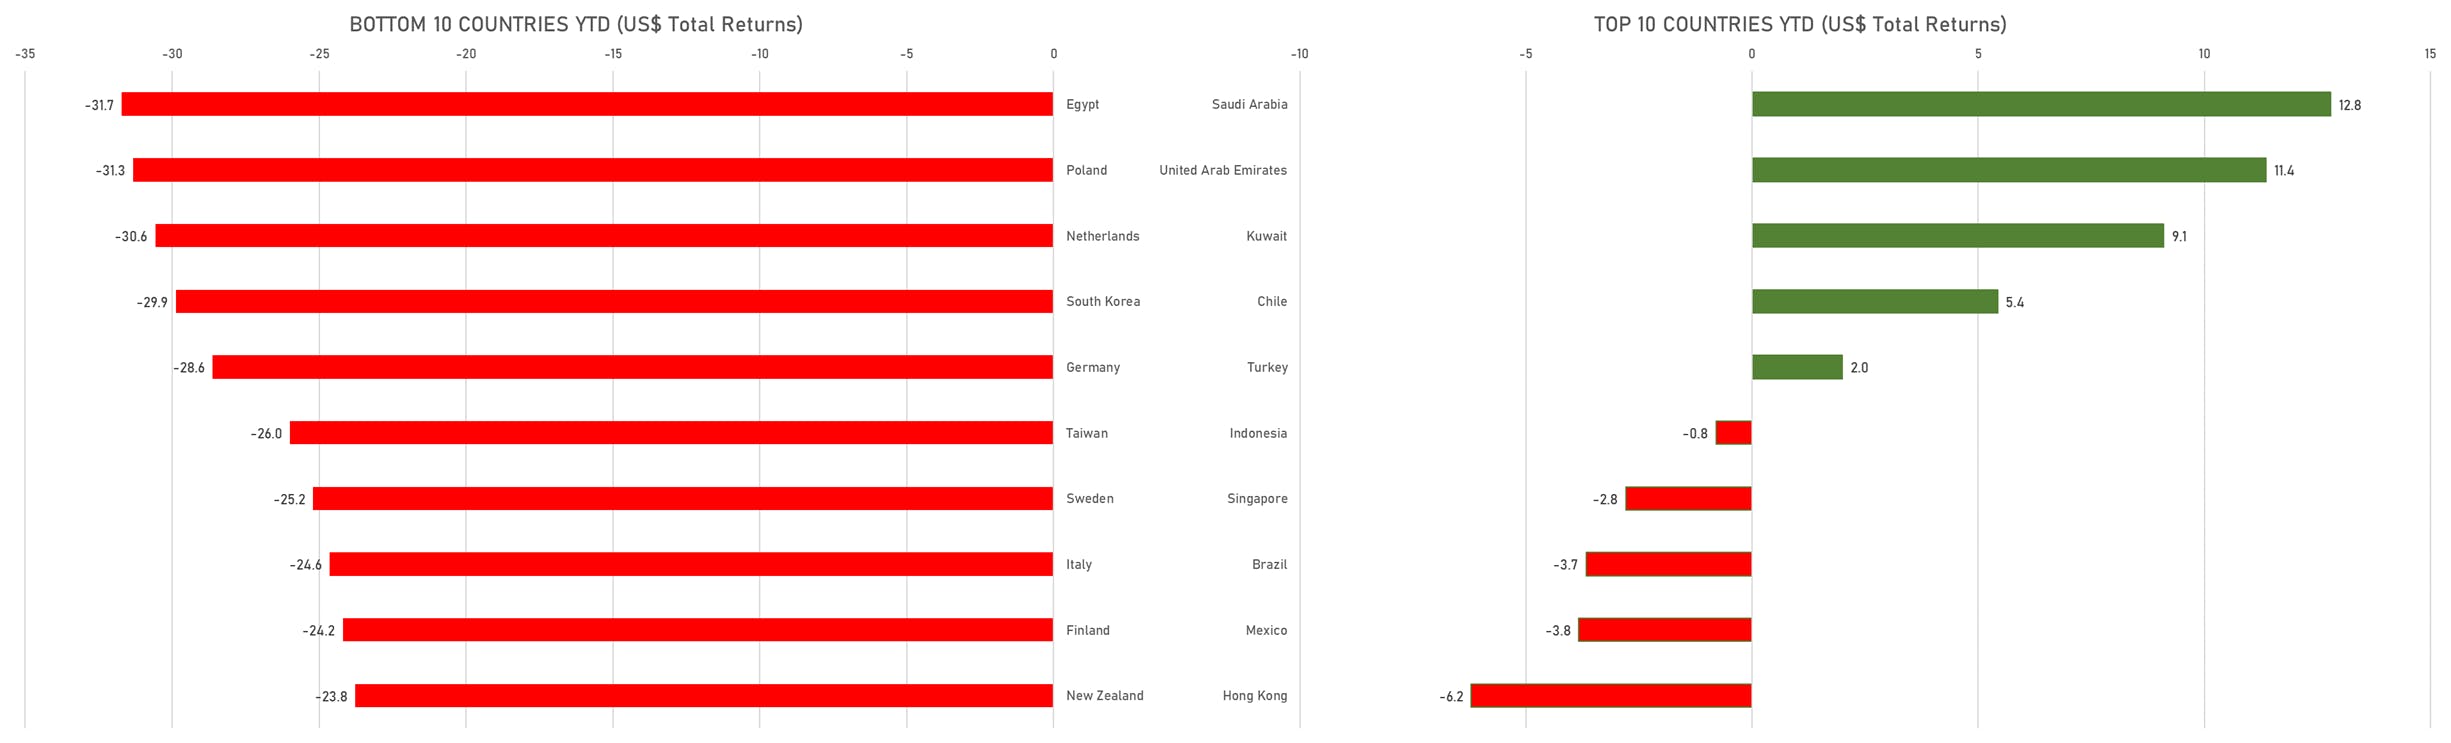
YTD Total Returns Around The World | Sources: ϕpost, FactSet data
US EQUITIES OUTLOOK
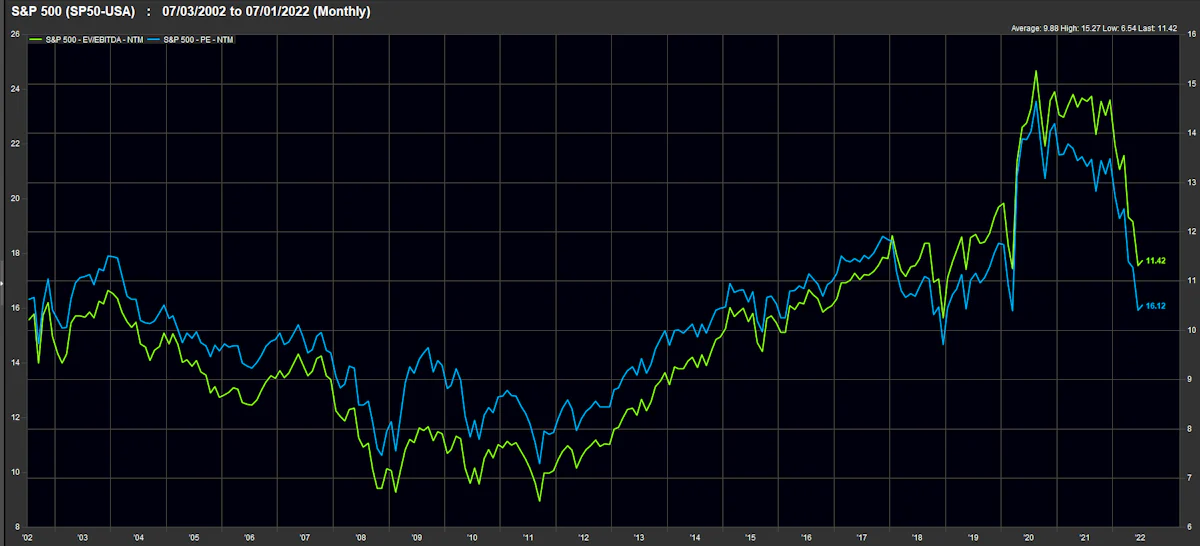
- S&P 500 forward P/E multiples have compressed by a third, driven by the rise in real yields, from a high of about 24 down to 16
- Goldman's David Kostin points out that heading into recessions, EPS estimates have on average been roughly 25% too high
- The market currently expects the S&P 500 EPS to rise to $250 in 2023
- That leads us to a simple calculation: assuming that P/E multiples don't compress further (note that in 2008 they dropped to 9x) and EPS estimates fall by 25%, we'd get a target bottom for the S&P 500 of around 3,000
- That means US equities could still drop by 20% from current levels if a recession materializes
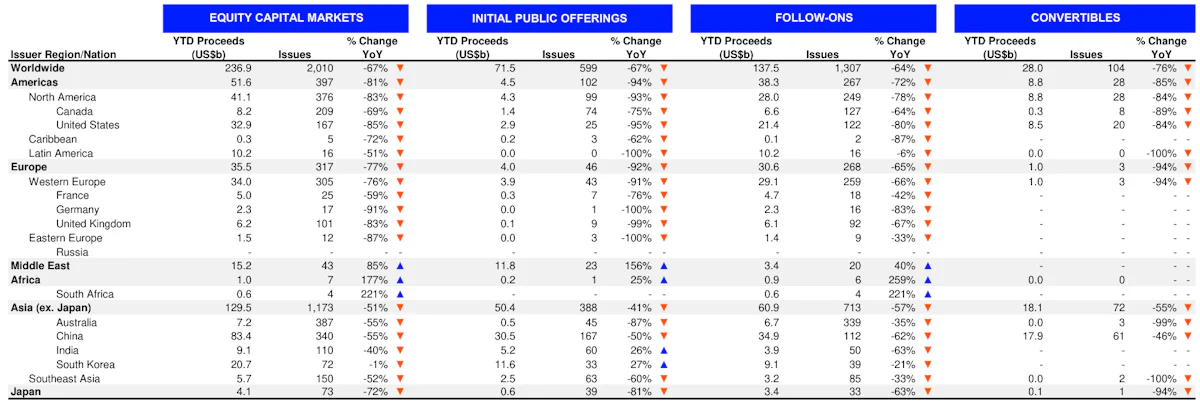
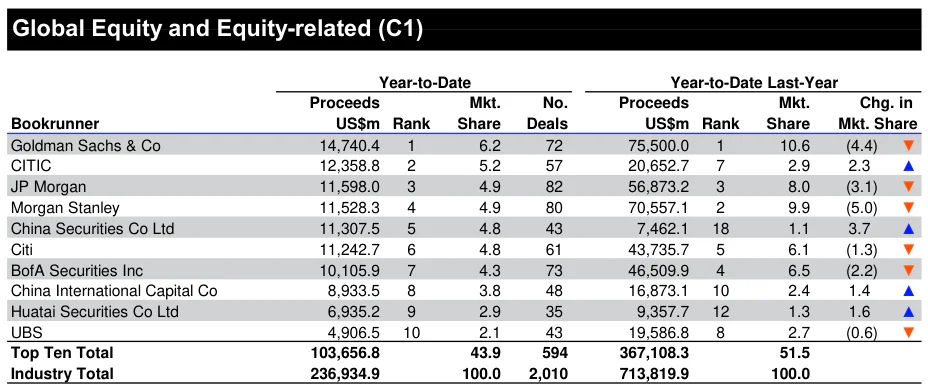
DISMAL FIRST HALF FOR GLOBAL EQUITY ISSUANCE
- Equity underwriting volume was down 69% year on year in the second quarter, and down 22% quarter on quarter
- Disclosed fees were down 73% year on year and down 30% quarter on quarter
- By region, year to date the Asia Pacific region has become the dominant region, whereas in 2021 the Americas were the leading region at 42% (with Asia Pacific at 37%)
- With the anemic YTD US supply, major Chinese firms like CITIC and China Securities are up a lot in the global league tables
DAILY ACTION
- Performance of US indices on Friday 1 July 2022: S&P 500 up 1.06%; Nasdaq Composite up 0.90%; Wilshire 5000 up 1.15%
- 85.5% of S&P 500 stocks were up today, with 24.0% of stocks above their 200-day moving average (DMA) and 22.4% above their 50-DMA
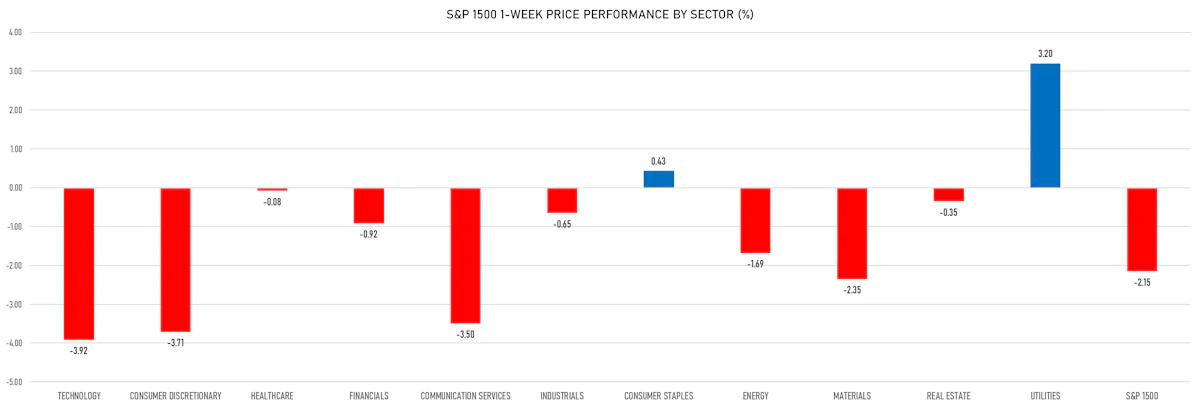
- Top performing sectors in the S&P 500: utilities up 2.48% and consumer discretionary up 1.97%
- Bottom performing sectors in the S&P 500: technology up 0.25% and materials up 0.67%
- The number of shares in the S&P 500 traded today was 608m for a total turnover of US$ 58 bn
- The S&P 500 Value Index was up 1.3%, while the S&P 500 Growth Index was up 0.8%; the S&P small caps index was up 0.9% and mid-caps were up 1.2%
- The volume on CME's INX (S&P 500 Index) was 2195.4m (3-month z-score: -0.8); the 3-month average volume is 2565.7m and the 12-month range is 1340.2 - 4692.3m
- Daily performance of international indices: Europe Stoxx 600 down -0.02%; UK FTSE 100 down -0.01%; Hang Seng SH-SZ-HK 300 Index down -0.17%; Japan's TOPIX 500 down -1.38%
VOLATILITY TODAY
- 1-month at-the-money implied volatility on the S&P 500 unchanged at 24.7%
- 1-month at-the-money implied volatility on the Euro Stoxx 50 at 25.4%, down from 26.0%
TOP WINNERS TODAY
- Omeros Corp (OMER), up 68.7% to $4.64 / YTD price return: -27.8% / 12-Month Price Range: $ 1.86-16.57 / Short interest (% of float): 22.1%; days to cover: 11.6
- Clovis Oncology Inc (CLVS), up 58.3% to $2.85 / YTD price return: +5.2% / 12-Month Price Range: $ .58-5.92 / Short interest (% of float): 29.1%; days to cover: 4.6
- Faraday Future Intelligent Electric Inc (FFIE), up 36.5% to $3.55 / YTD price return: -33.3% / 12-Month Price Range: $ 1.65-17.00
- Inter & Co Inc (INTR), up 31.9% to $2.77 / 12-Month Price Range: $ 2.10-4.00
- Accolade Inc (ACCD), up 28.8% to $9.53 / YTD price return: -63.8% / 12-Month Price Range: $ 4.61-55.47 / Short interest (% of float): 5.9%; days to cover: 2.7
- Belite Bio Inc (BLTE), up 21.0% to $37.69 / 12-Month Price Range: $ 8.80-35.20 / Short interest (% of float): 0.4%; days to cover: 0.1
- Zhong Yang Financial Group Ltd (TOP), up 20.7% to $29.80 / 12-Month Price Range: $ 12.60-50.97
- Betterware de Mexico SAB de CV (BWMX), up 19.3% to $10.31 / YTD price return: -50.8% / 12-Month Price Range: $ 8.60-50.11 / Short interest (% of float): 1.3%; days to cover: 4.0
- Yatsen Holding Ltd (YSG), up 18.1% to $1.83 / YTD price return: -14.9% / 12-Month Price Range: $ .39-9.32 / Short interest (% of float): 2.3%; days to cover: 2.6
- Coupang Inc (CPNG), up 18.0% to $15.04 / YTD price return: -48.8% / 12-Month Price Range: $ 8.98-46.00 / Short interest (% of float): 2.9%; days to cover: 3.4
BIGGEST LOSERS TODAY
- ioneer Ltd (IONR), down 28.6% to $12.58 / 12-Month Price Range: $ 15.40-17.63 (the stock is currently on the short sale restriction list)
- Kohls Corp (KSS), down 19.6% to $28.68 / YTD price return: -41.9% / 12-Month Price Range: $ 34.33-64.38 / Short interest (% of float): 9.5%; days to cover: 2.2 (the stock is currently on the short sale restriction list)
- Redbox Entertainment Inc (RDBX), down 17.4% to $6.11 / YTD price return: -17.5% / 12-Month Price Range: $ 1.61-27.22 (the stock is currently on the short sale restriction list)
- Energy Vault Holdings Inc (NRGV), down 17.3% to $8.29 / YTD price return: -16.3% / 12-Month Price Range: $ 8.34-22.10 / Short interest (% of float): 3.1%; days to cover: 4.4 (the stock is currently on the short sale restriction list)
- Alpha Tau Medical Ltd (DRTS), down 16.0% to $7.57 / YTD price return: -22.9% / 12-Month Price Range: $ 4.68-20.65 (the stock is currently on the short sale restriction list)
- Celldex Therapeutics Inc (CLDX), down 15.8% to $22.70 / YTD price return: -41.3% / 12-Month Price Range: $ 19.85-57.20 / Short interest (% of float): 10.1%; days to cover: 6.8 (the stock is currently on the short sale restriction list)
- Doma Holdings Inc (DOMA), down 15.4% to $.87 / YTD price return: -82.8% / 12-Month Price Range: $ .87-10.00 / Short interest (% of float): 2.8%; days to cover: 3.0 (the stock is currently on the short sale restriction list)
- Ichor Holdings Ltd (ICHR), down 14.4% to $22.25 / YTD price return: -51.7% / 12-Month Price Range: $ 23.10-54.65 / Short interest (% of float): 4.0%; days to cover: 4.7 (the stock is currently on the short sale restriction list)
- Axcelis Technologies Inc (ACLS), down 12.6% to $47.95 / YTD price return: -35.7% / 12-Month Price Range: $ 33.36-83.74 / Short interest (% of float): 4.1%; days to cover: 3.5 (the stock is currently on the short sale restriction list)
- SiTime Corp (SITM), down 11.7% to $144.00 / YTD price return: -50.8% / 12-Month Price Range: $ 110.93-341.77 (the stock is currently on the short sale restriction list)
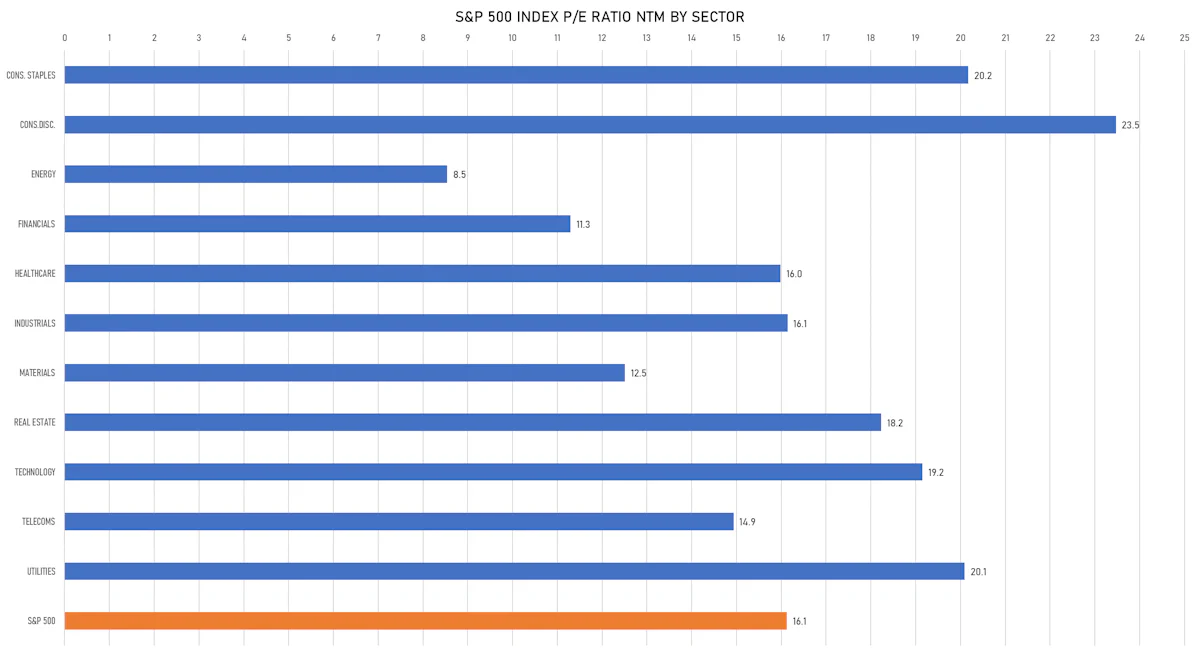
VALUATION MULTIPLES BY SECTORS
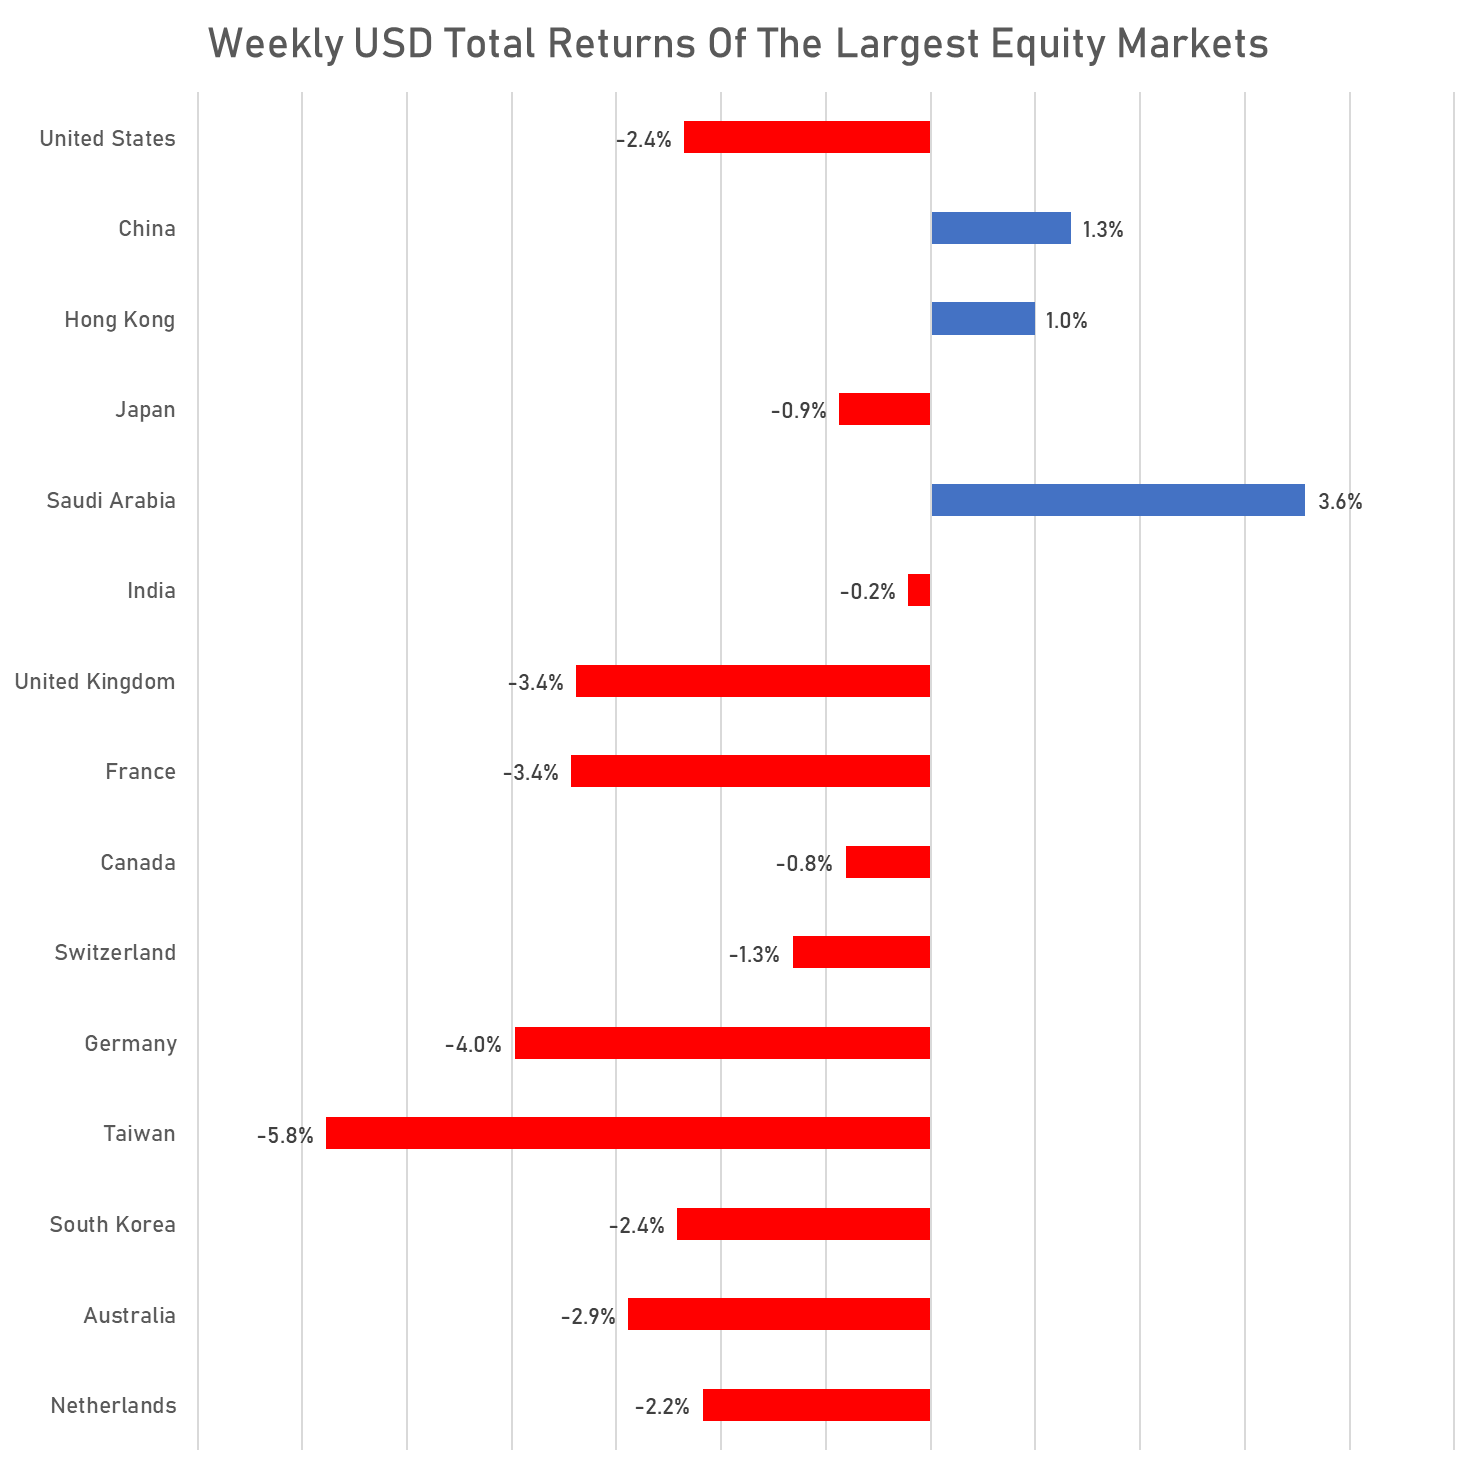
WEEKLY TOTAL RETURNS OF MAJOR GLOBAL EQUITY MARKETS
TOP / BOTTOM PERFORMING WORLD MARKETS YTD
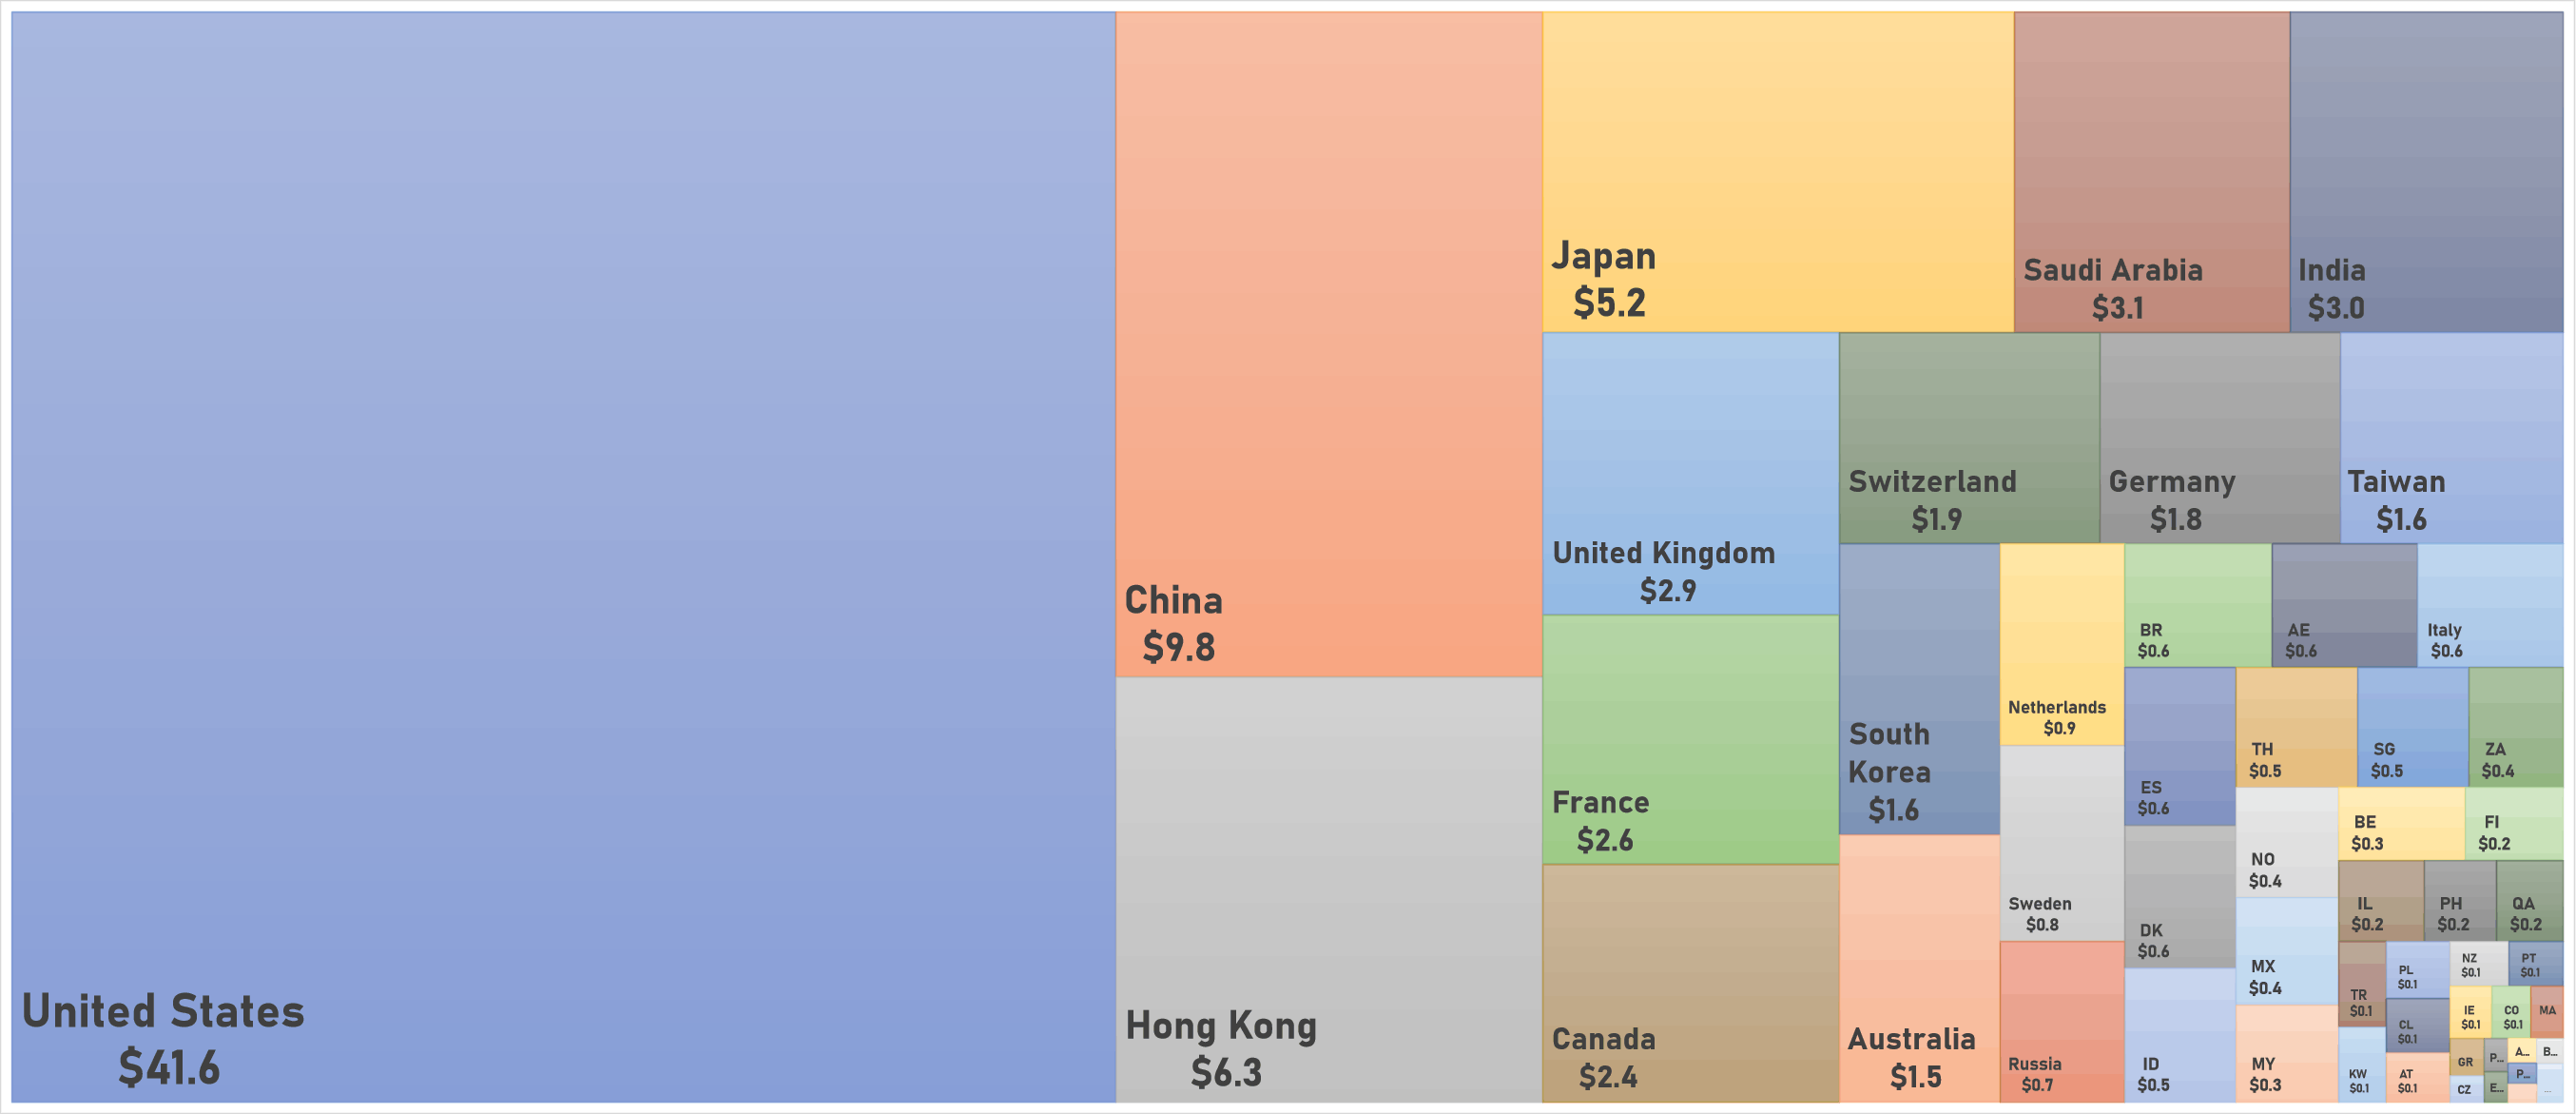
WORLD MARKET CAPITALIZATION (US$ Trillion)