Equities
Losses On Friday Ahead Of Big Earnings Week, Which Will See About A Third Of S&P 500 Companies Reporting
While US equities have performed well recently, Chinese stocks have seen a slight turn of fortune: main CN+HK indices showed strong performance after the reopening of major cities, but have been weaker again in the past weeks, down about 1.4% over the past month
Published ET
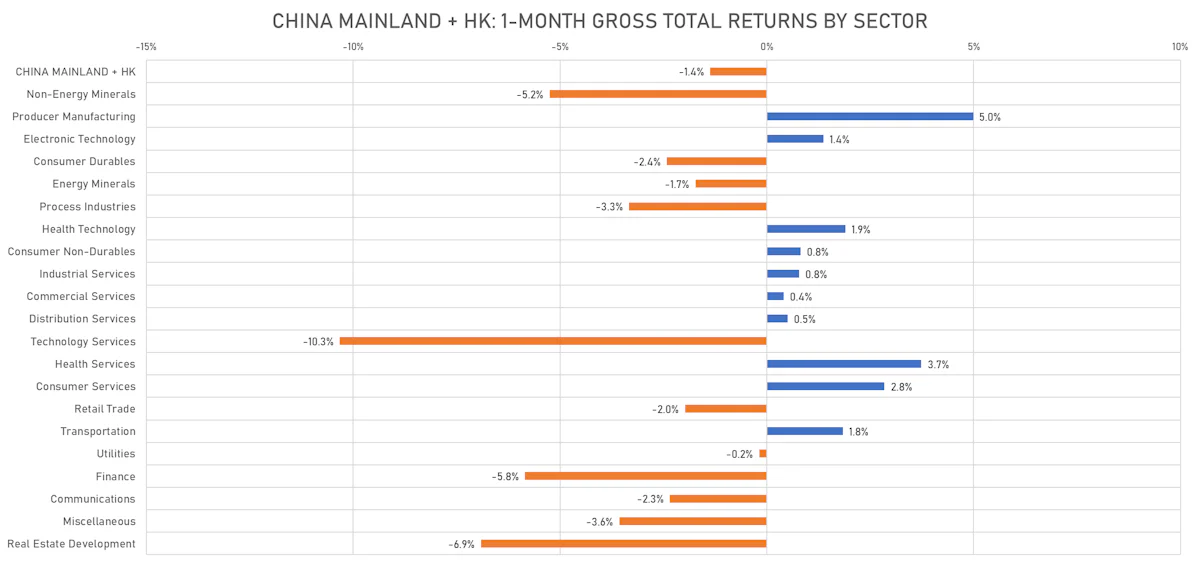
China + HK 1-Month Gross Total Returns | Sources: ϕpost, FactSet data
DAILY SUMMARY
- Daily performance of US indices: S&P 500 down -0.93%; Nasdaq Composite down -1.87%; Wilshire 5000 down -1.14%
- 37.4% of S&P 500 stocks were up today, with 20.3% of stocks above their 200-day moving average (DMA) and 54.7% above their 50-DMA
- Top performing sectors in the S&P 500: utilities up 1.37% and real estate up 0.79%
- Bottom performing sectors in the S&P 500: communication services down -4.34% and technology down -1.38%
- The number of shares in the S&P 500 traded today was 594m for a total turnover of US$ 58 bn
- The S&P 500 Value Index was down -0.3%, while the S&P 500 Growth Index was down -1.6%; the S&P small caps index was down -0.9% and mid-caps were down -0.9%
- The volume on CME's INX (S&P 500 Index) was 2224.9m (3-month z-score: -0.6); the 3-month average volume is 2527.2m and the 12-month range is 1340.2 - 4692.3m
- Daily performance of international indices: Europe Stoxx 600 up 0.31%; UK FTSE 100 up 0.08%; Hang Seng SH-SZ-HK 300 Index up 0.08%; Japan's TOPIX 500 up 0.27%
VOLATILITY TODAY
- 1-month at-the-money implied volatility on the S&P 500 at 20.0%, down from 20.4%
- 1-month at-the-money implied volatility on the Euro Stoxx 50 at 20.9%, down from 22.5%
NOTABLE US EARNINGS RELEASES TODAY
- Verizon Communications Inc (VZ | Technology): missed EPS median estimate (1.31 act. vs. 1.32 est.) and beat revenue median estimate (33,789m act. vs. 33,713m est.), down -6.74% today, closed at $ 44.45 / share and traded at $ 44.43 (-0.04%) after hours
- Nextera Energy Inc (NEE | Utilities): beat EPS median estimate (0.81 act. vs. 0.76 est.) and missed revenue median estimate (5,183m act. vs. 5,319m est.), up 1.75% today, closed at $ 80.25 / share and traded at $ 80.62 (+0.46%) after hours
- American Express Co (AXP | Financials): beat EPS median estimate (2.57 act. vs. 2.42 est.) and beat revenue median estimate (13,395m act. vs. 12,496m est.), up 1.88% today, closed at $ 153.01 / share and traded at $ 153.00 (-0.01%) after hours
- HCA Healthcare Inc (HCA | Healthcare): beat EPS median estimate (4.21 act. vs. 3.69 est.) and beat revenue median estimate (14,820m act. vs. 14,747m est.), up 11.43% today, closed at $ 202.03 / share and traded at $ 202.03 (unchanged) after hours
- Schlumberger NV (SLB | Energy): beat EPS median estimate (0.50 act. vs. 0.40 est.) and beat revenue median estimate (6,773m act. vs. 6,277m est.), up 4.28% today, closed at $ 35.07 / share and traded at $ 34.97 (-0.29%) after hours
- Roper Technologies Inc (ROP | Technology): beat EPS median estimate (3.95 act. vs. 3.79 est.) and missed revenue median estimate (1,311m act. vs. 1,539m est.), down -0.44% today, closed at $ 410.92 / share and traded at $ 410.92 (unchanged) after hours
- Twitter Inc (TWTR | Technology): missed EPS median estimate (-0.08 act. vs. 0.14 est.) and missed revenue median estimate (1,177m act. vs. 1,305m est.), up 0.81% today, closed at $ 39.84 / share and traded at $ 39.80 (-0.10%) after hours
- Regions Financial Corp (RF | Financials): beat EPS median estimate (0.59 act. vs. 0.54 est.) and beat revenue median estimate (1,759m act. vs. 1,688m est.), up 1.37% today, closed at $ 20.65 / share and traded at $ 20.58 (-0.34%) after hours
- Cleveland-Cliffs Inc (CLF | Basic Materials): missed EPS median estimate (1.14 act. vs. 1.31 est.) and beat revenue median estimate (6,337m act. vs. 6,112m est.), down -8.87% today, closed at $ 15.62 / share and traded at $ 15.62 (unchanged) after hours
- Gentex Corp (GNTX | Consumer Cyclicals): missed EPS median estimate (0.31 act. vs. 0.38 est.) and missed revenue median estimate (463m act. vs. 473m est.), down -8.02% today, closed at $ 27.28 / share and traded at $ 27.02 (-0.95%) after hours
US EARNINGS IN THE WEEK AHEAD
S&P 500 EARNINGS DASHBOARD
![]()
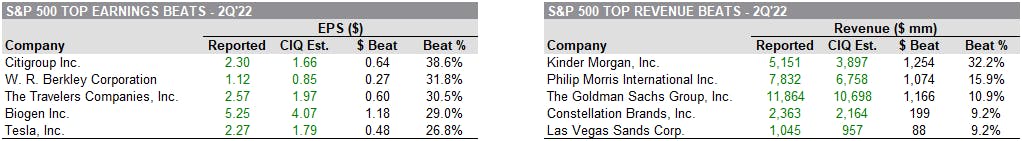
NOTABLE BEATS
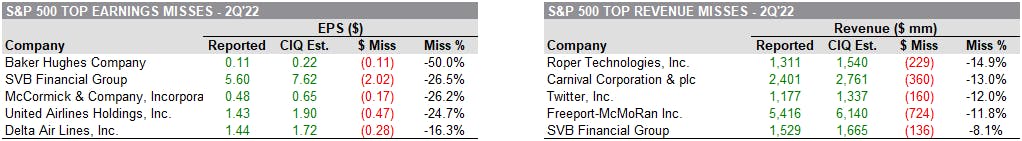
NOTABLE MISSES
TOP S&P 500 PERFORMERS THIS WEEK
- Bath & Body Works Inc (BBWI), up 21.7% to $33.47 / YTD price return: -52.0% / 12-Month Price Range: $ 25.80-82.00 / Short interest (% of float): 8.0%; days to cover: 2.7
- HCA Healthcare Inc (HCA), up 17.7% to $202.03 / YTD price return: -21.4% / 12-Month Price Range: $ 164.55-279.01 / Short interest (% of float): 2.0%; days to cover: 2.0
- ETSY Inc (ETSY), up 17.7% to $97.11 / YTD price return: -55.6% / 12-Month Price Range: $ 67.06-307.34 / Short interest (% of float): 13.8%; days to cover: 4.0
- Netflix Inc (NFLX), up 16.6% to $220.44 / YTD price return: -63.4% / 12-Month Price Range: $ 162.81-700.50 / Short interest (% of float): 2.9%; days to cover: 1.4
- Tesla Inc (TSLA), up 13.4% to $816.73 / YTD price return: -22.7% / 12-Month Price Range: $ 620.60-1,243.25
- Caesars Entertainment Inc (CZR), up 13.3% to $42.65 / YTD price return: -54.4% / 12-Month Price Range: $ 35.10-119.79 / Short interest (% of float): 6.3%; days to cover: 3.0
- Las Vegas Sands Corp (LVS), up 12.9% to $38.99 / YTD price return: +3.6% / 12-Month Price Range: $ 28.88-48.26 / Short interest (% of float): 5.5%; days to cover: 2.6
- Generac Holdings Inc (GNRC), up 11.6% to $239.93 / YTD price return: -31.8% / 12-Month Price Range: $ 197.94-522.66 / Short interest (% of float): 8.8%; days to cover: 4.6
- Wynn Resorts Ltd (WYNN), up 11.3% to $61.73 / YTD price return: -27.4% / 12-Month Price Range: $ 50.22-109.10
- Autodesk Inc (ADSK), up 11.2% to $195.95 / YTD price return: -30.3% / 12-Month Price Range: $ 163.20-344.39 / Short interest (% of float): 1.4%; days to cover: 1.6
BOTTOM S&P 500 PERFORMERS THIS WEEK
- Verizon Communications Inc (VZ), down 12.9% to $44.45 / YTD price return: -14.5% / 12-Month Price Range: $ 44.45-56.34
- SVB Financial Group (SIVB), down 11.6% to $361.36 / YTD price return: -46.7% / 12-Month Price Range: $ 361.36-763.22 / Short interest (% of float): 3.2%; days to cover: 3.0 (the stock is currently on the short sale restriction list)
- AT&T Inc (T), down 10.6% to $18.40 / YTD price return: -1.0% / 12-Month Price Range: $ 16.62-21.55 / Short interest (% of float): 1.2%; days to cover: 2.0 (the stock is currently on the short sale restriction list)
- Baker Hughes Co (BKR), down 9.7% to $24.08 / YTD price return: +.1% / 12-Month Price Range: $ 19.60-39.78 / Short interest (% of float): 2.3%; days to cover: 2.2
- International Business Machines Corp (IBM), down 8.3% to $128.25 / YTD price return: -4.0% / 12-Month Price Range: $ 114.59-144.70
- Signature Bank (SBNY), down 8.2% to $175.89 / YTD price return: -45.6% / 12-Month Price Range: $ 165.36-374.76 / Short interest (% of float): 3.7%; days to cover: 2.1
- United Airlines Holdings Inc (UAL), down 6.3% to $36.33 / YTD price return: -17.0% / 12-Month Price Range: $ 30.54-54.52
- Newmont Corporation (NEM), down 6.1% to $51.39 / YTD price return: -17.1% / 12-Month Price Range: $ 51.39-86.37 / Short interest (% of float): 1.4%; days to cover: 1.8
- Elevance Health Inc (ELV), down 6.0% to $459.60 / YTD price return: -.8% / 12-Month Price Range: $ 355.85-533.68
- American Airlines Group Inc (AAL), down 5.5% to $13.68 / YTD price return: -23.8% / 12-Month Price Range: $ 11.93-22.35
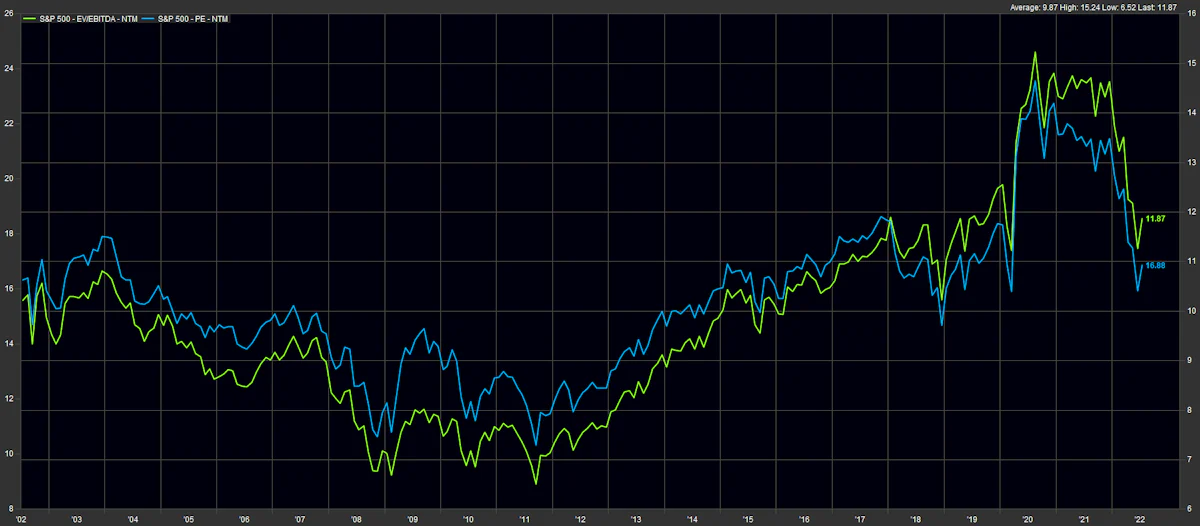
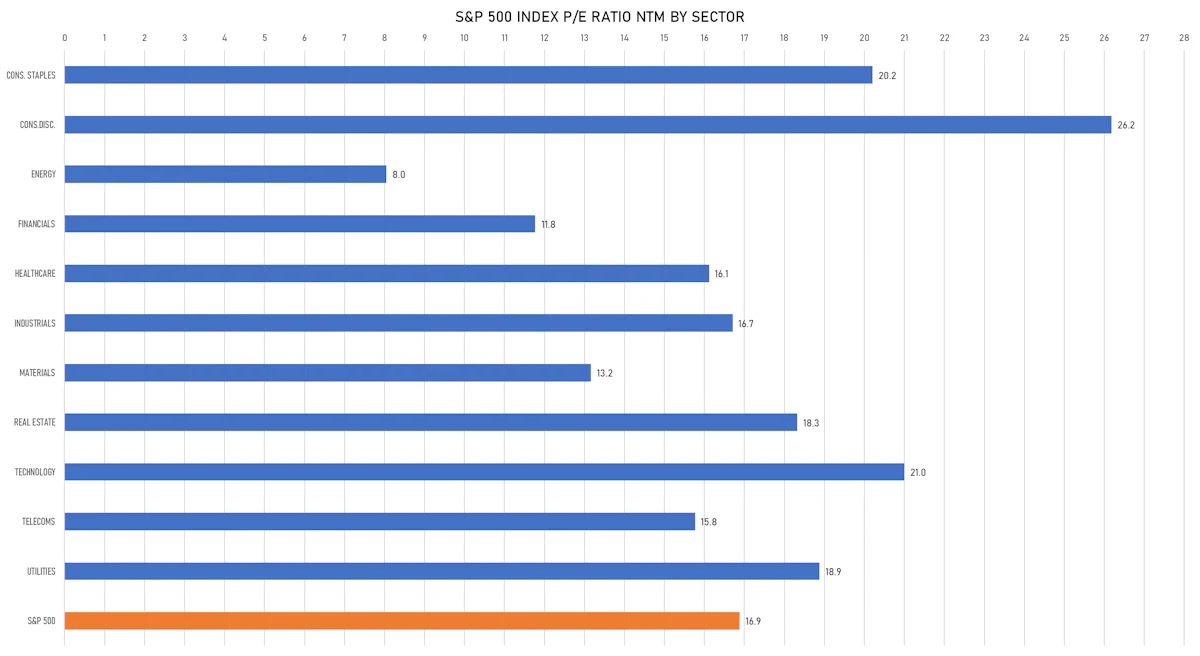
VALUATION MULTIPLES BY SECTORS
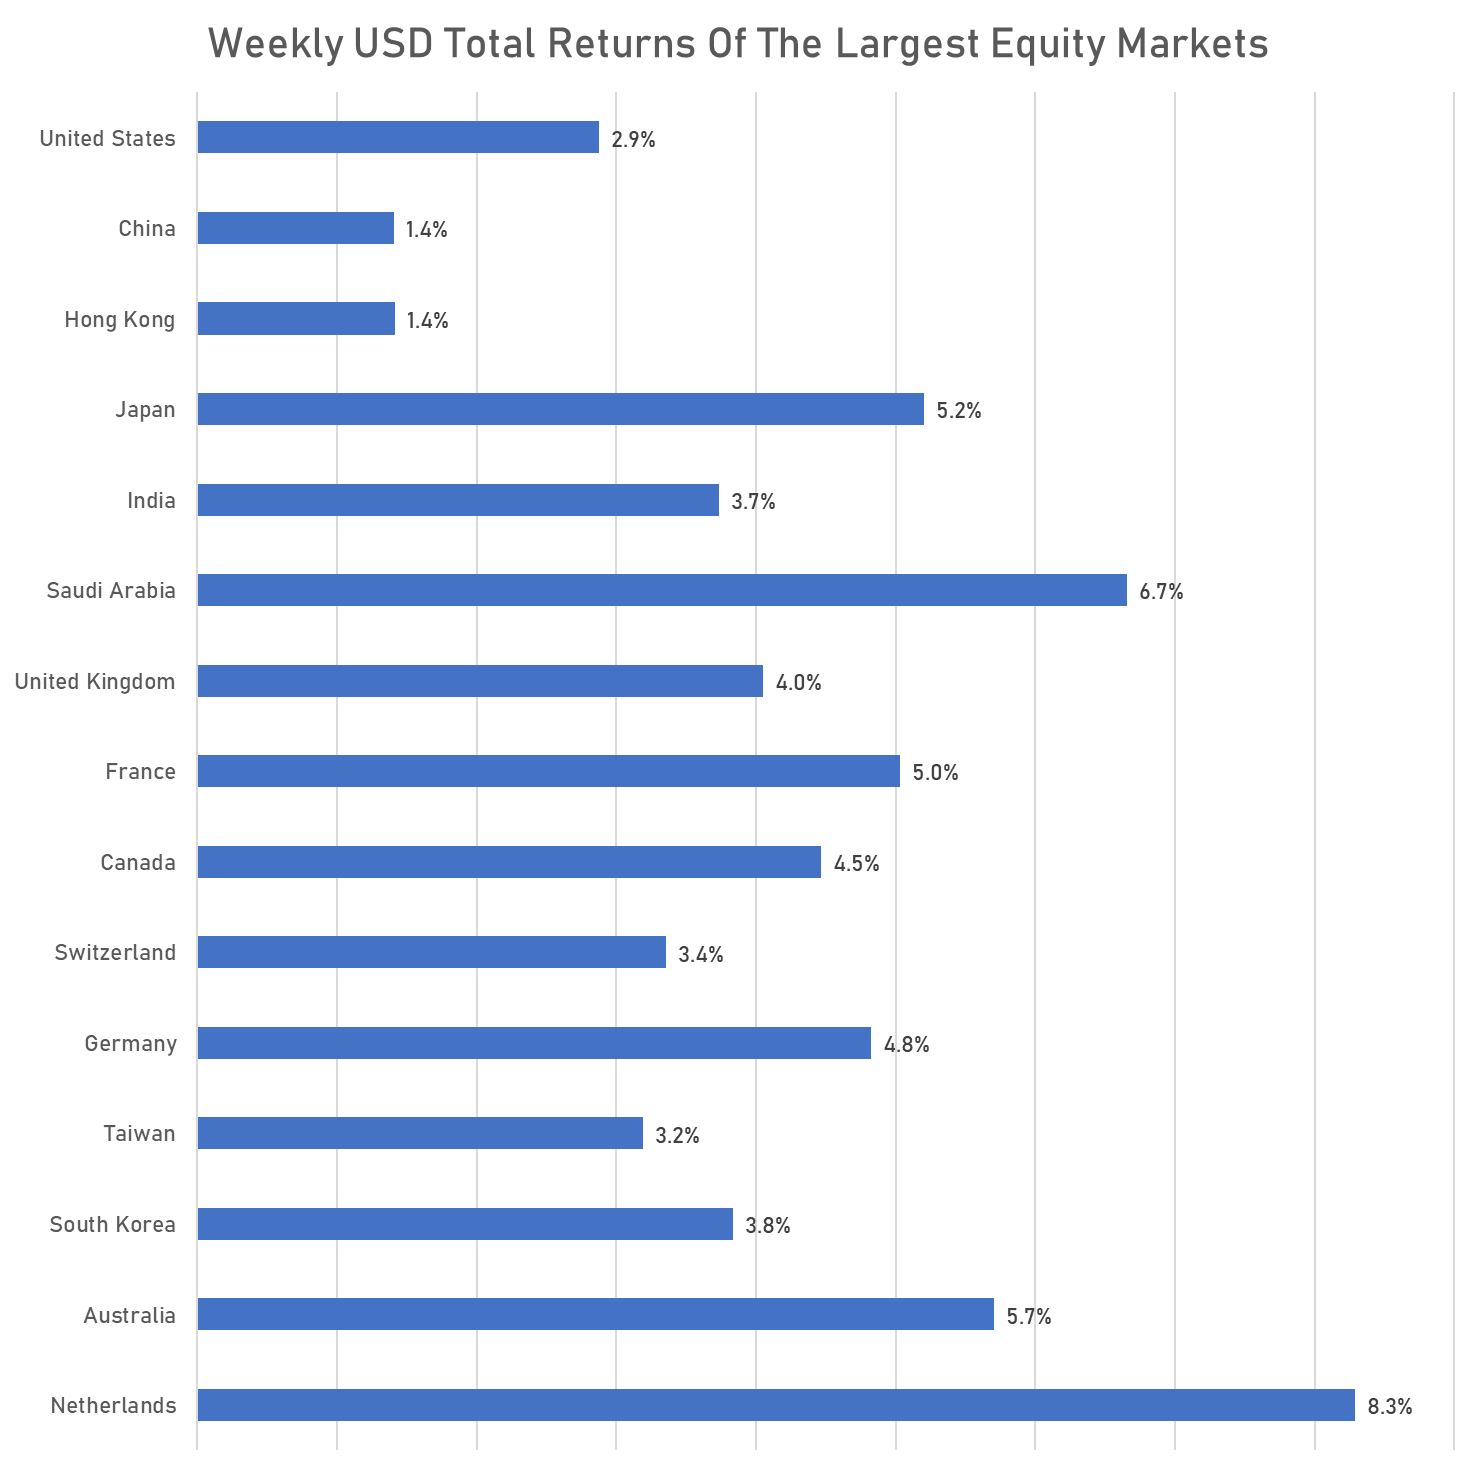
WEEKLY TOTAL RETURNS OF MAJOR GLOBAL EQUITY MARKETS
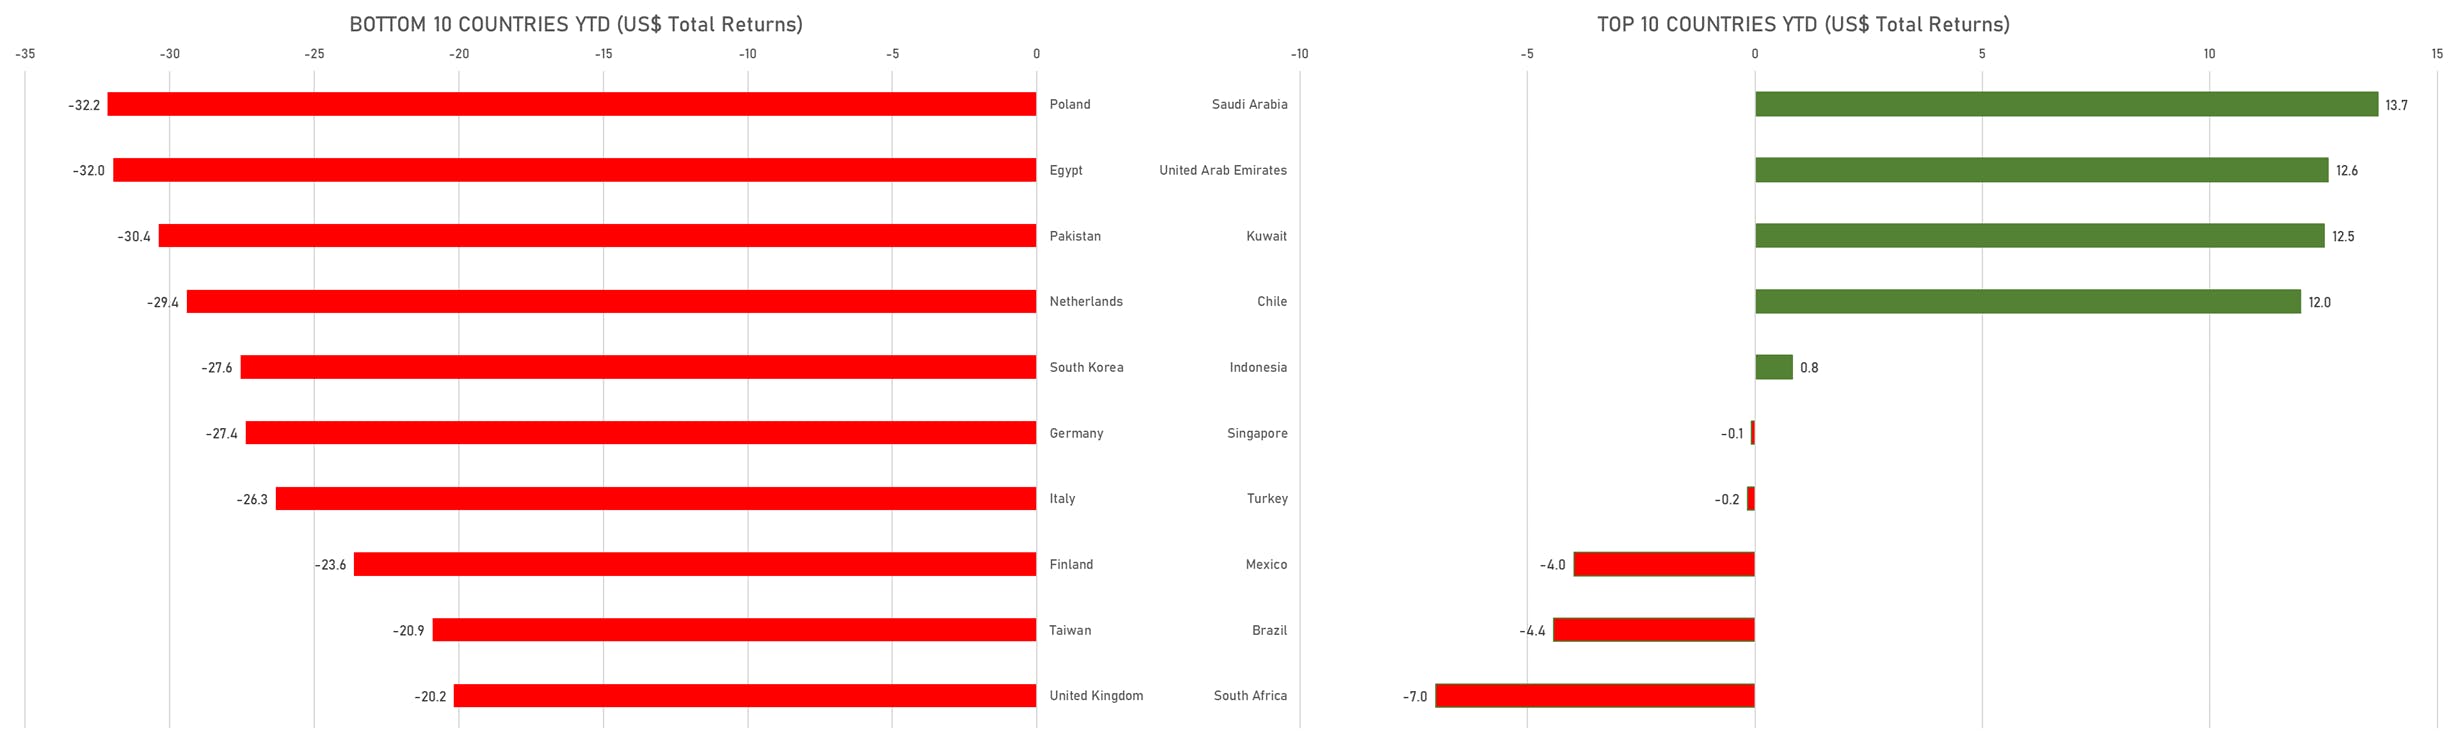
TOP / BOTTOM PERFORMING WORLD MARKETS YTD
WORLD MARKET CAPITALIZATION (US$ Trillion)