Equities
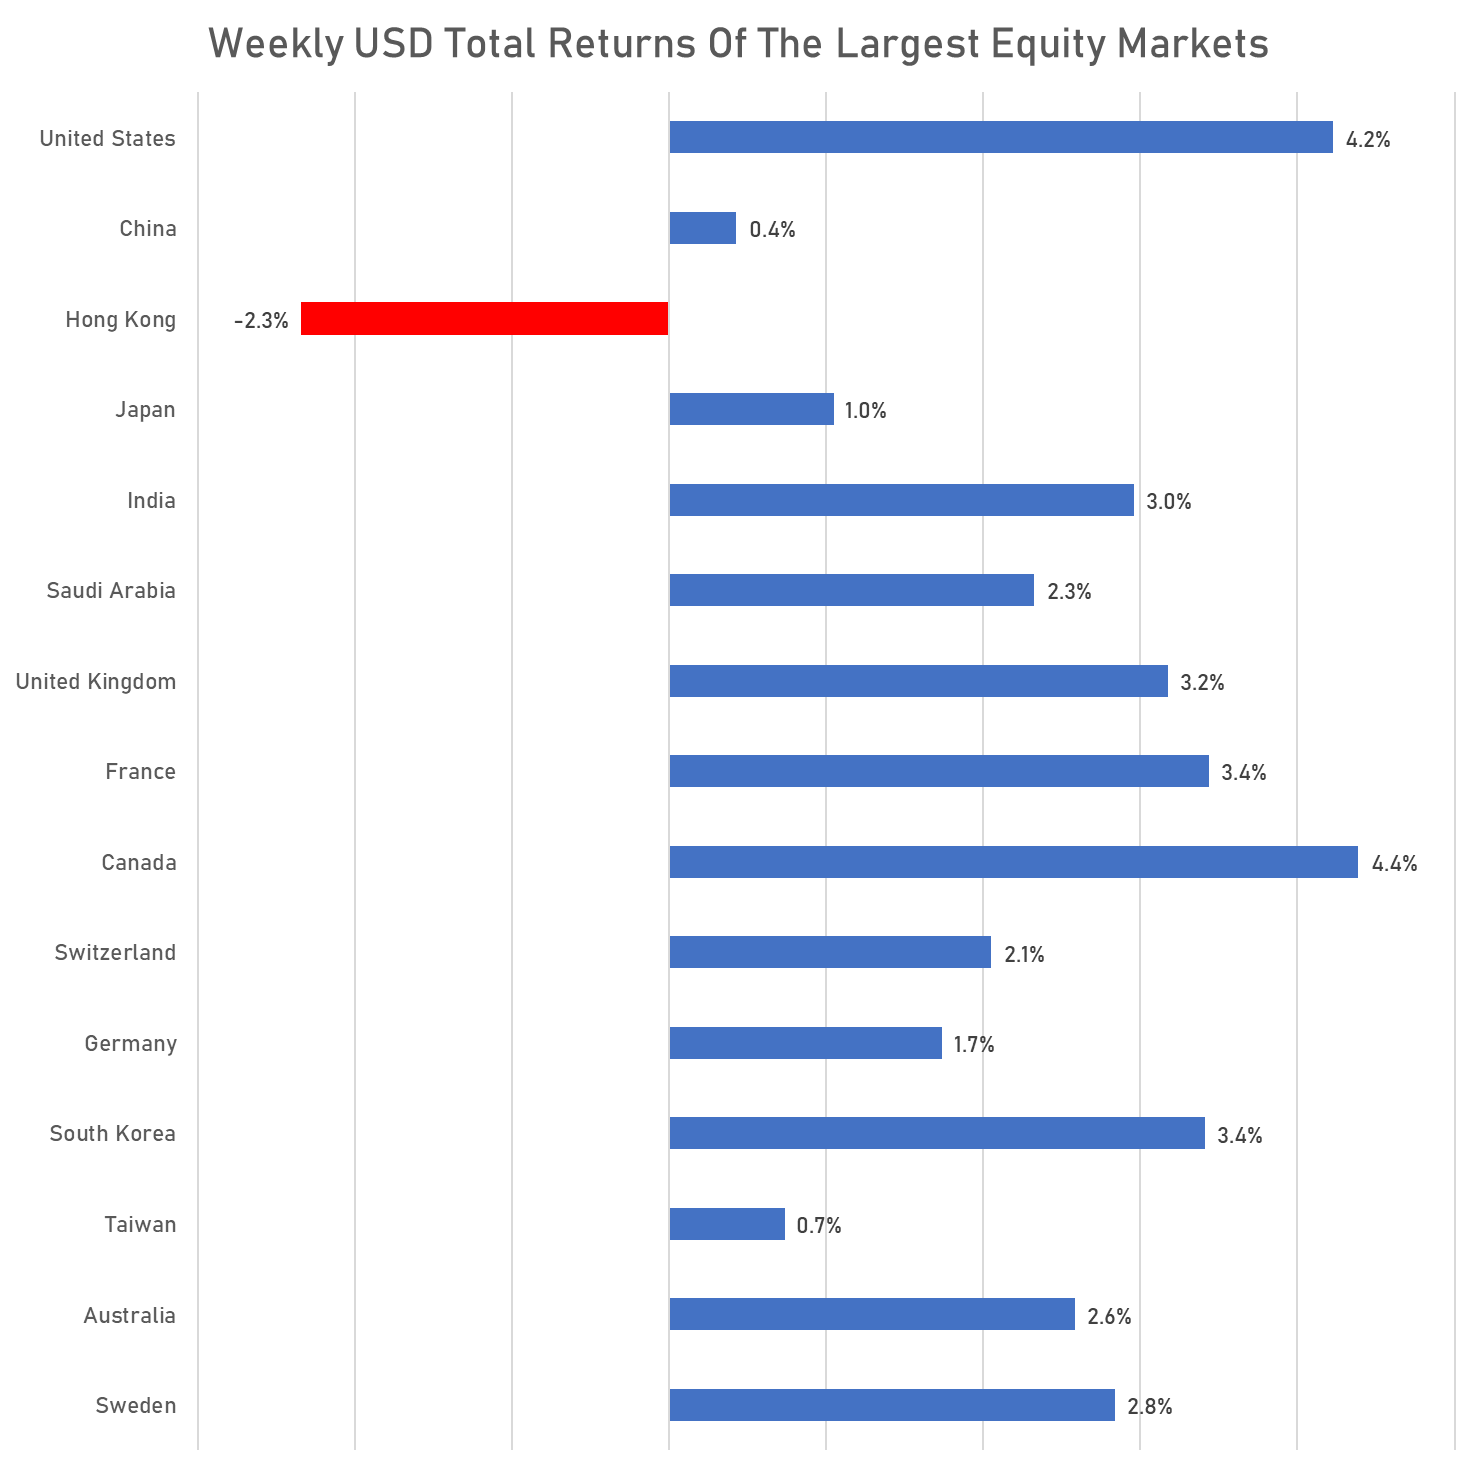
US Equities Up 4.2% This Week, Energy Stocks Up Another 10%, With The Brent Crude Spot Price Closing Around $110/bbl
The current bear market rally is likely one of the most unloved: beat-up stocks rising double digits with very low participation, as hedge funds and real money managers had to reduce gross exposures markedly to provide cash for client withdrawals that have yet to materialize
Published ET
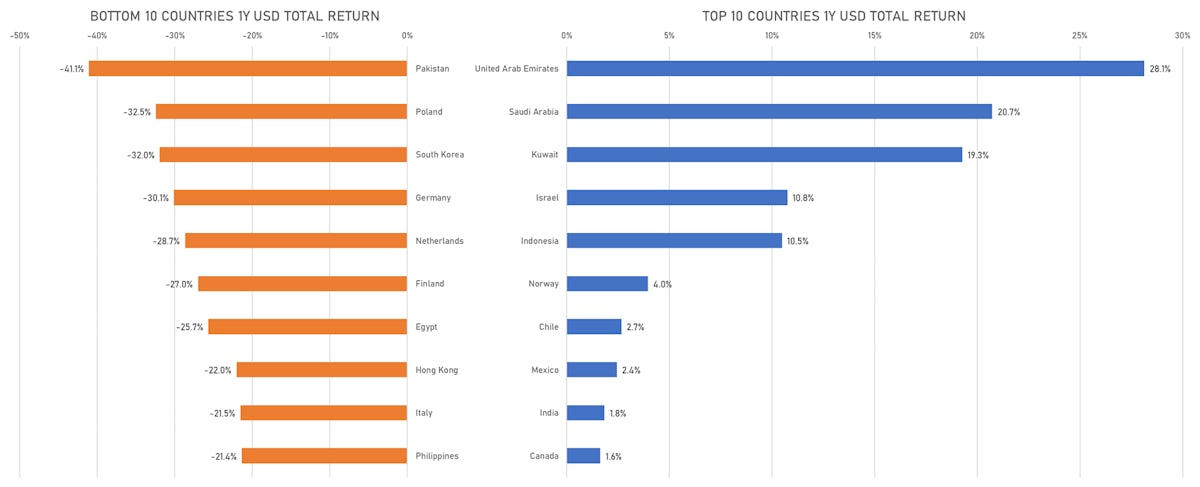
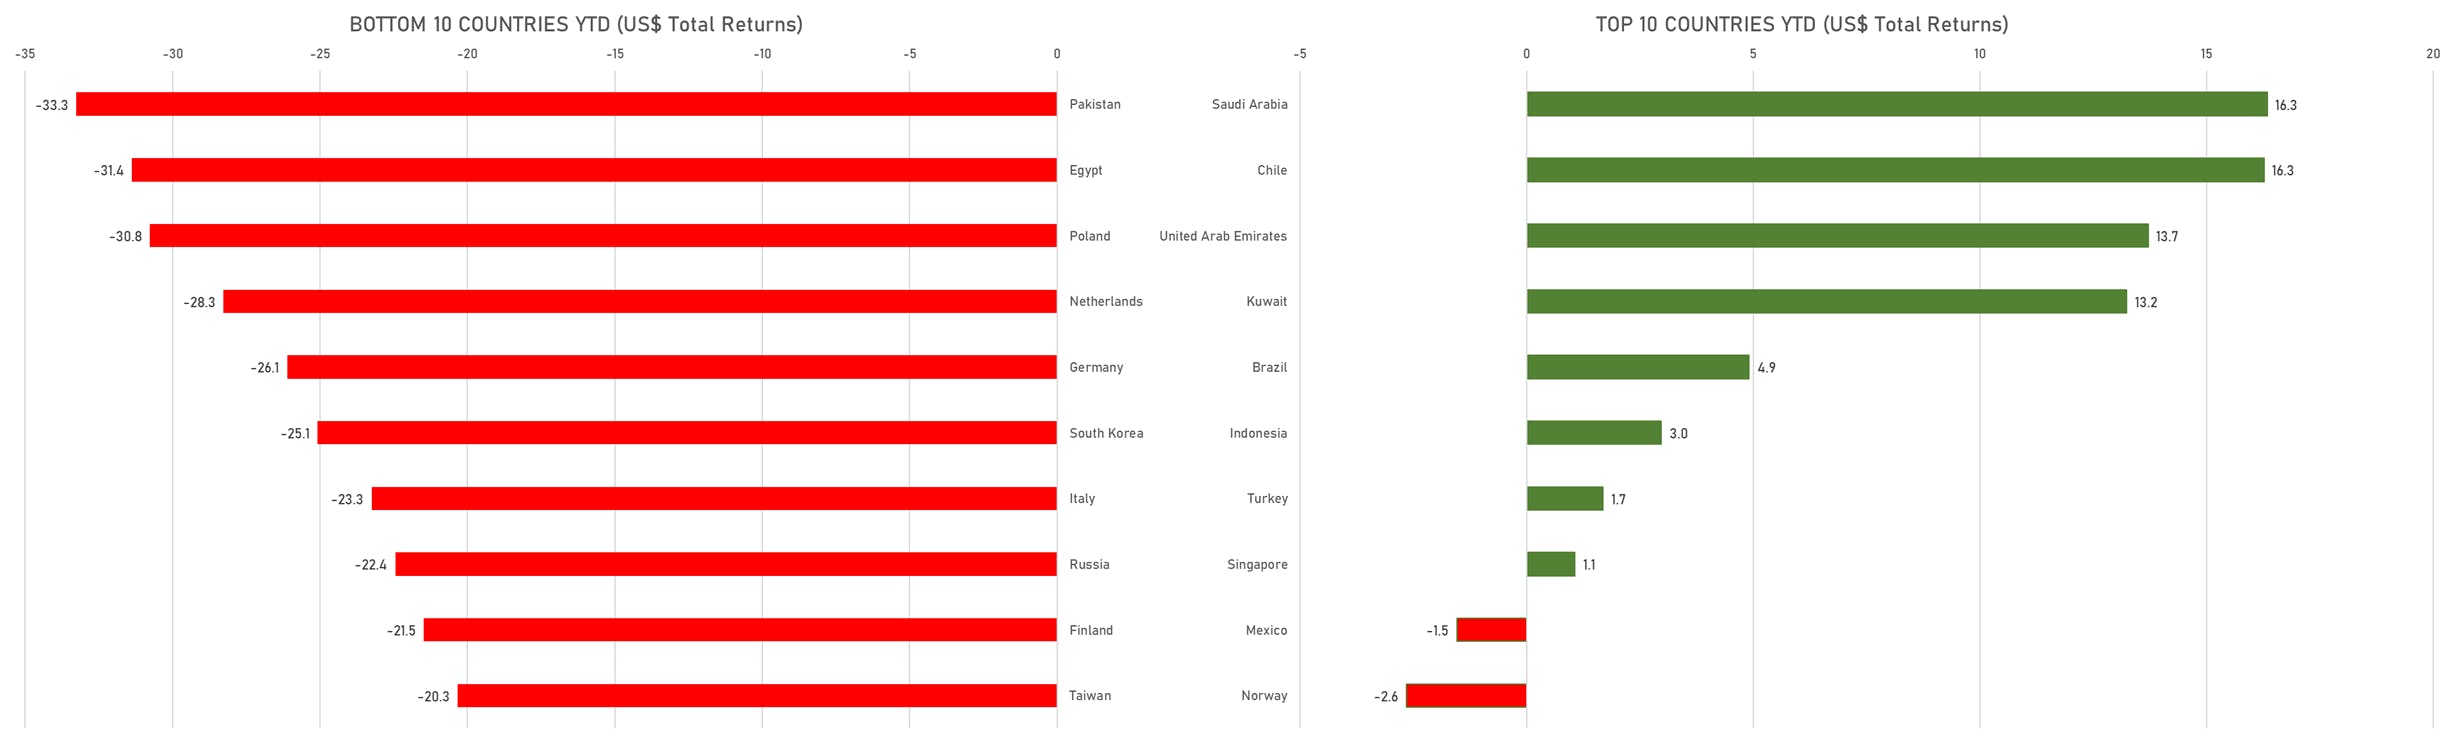
Top- & Bottom-Performing Countries Over The Past Year | Sources: ϕpost, FactSet data
DAILY SUMMARY
- Daily performance of US indices: S&P 500 up 1.42%; Nasdaq Composite up 1.88%; Wilshire 5000 up 1.39%
- 77.1% of S&P 500 stocks were up today, with 34.4% of stocks above their 200-day moving average (DMA) and 76.5% above their 50-DMA
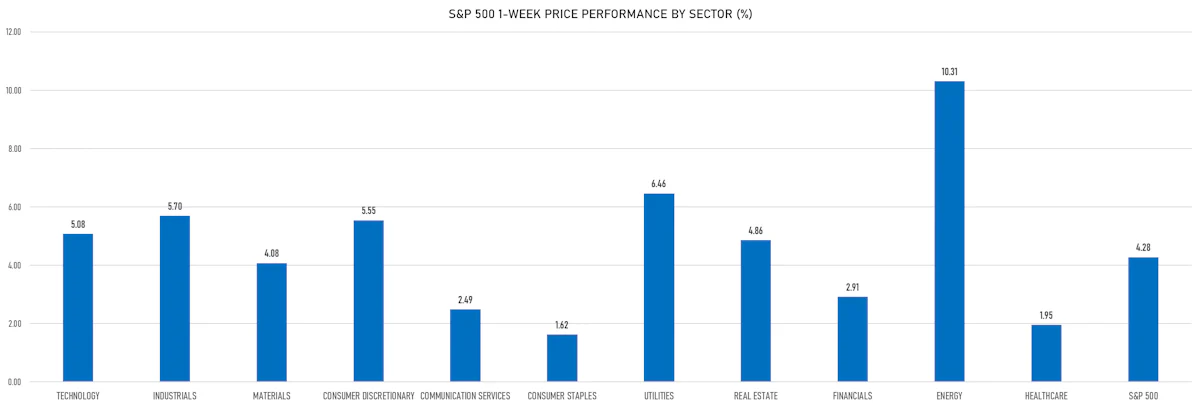
- Top performing sectors in the S&P 500: energy up 4.51% and consumer discretionary up 4.27%
- Bottom performing sectors in the S&P 500: consumer staples down -0.72% and healthcare down -0.35%
- The number of shares in the S&P 500 traded today was 990m for a total turnover of $ 94 bn
- The S&P 500 Value Index was up 0.7%, while the S&P 500 Growth Index was up 2.1%; the S&P small caps index was up 0.8% and mid-caps were up 1.3%
- The volume on CME's INX (S&P 500 Index) was 2894.2m (3-month z-score: 0.8); the 3-month average volume is 2507.5m and the 12-month range is 1340.2 - 4692.3m
- Daily performance of international indices: Europe Stoxx 600 up 1.28%; UK FTSE 100 up 1.06%; Hang Seng SH-SZ-HK 300 Index down -2.13%; Japan's TOPIX 500 down -0.41%
VOLATILITY TODAY
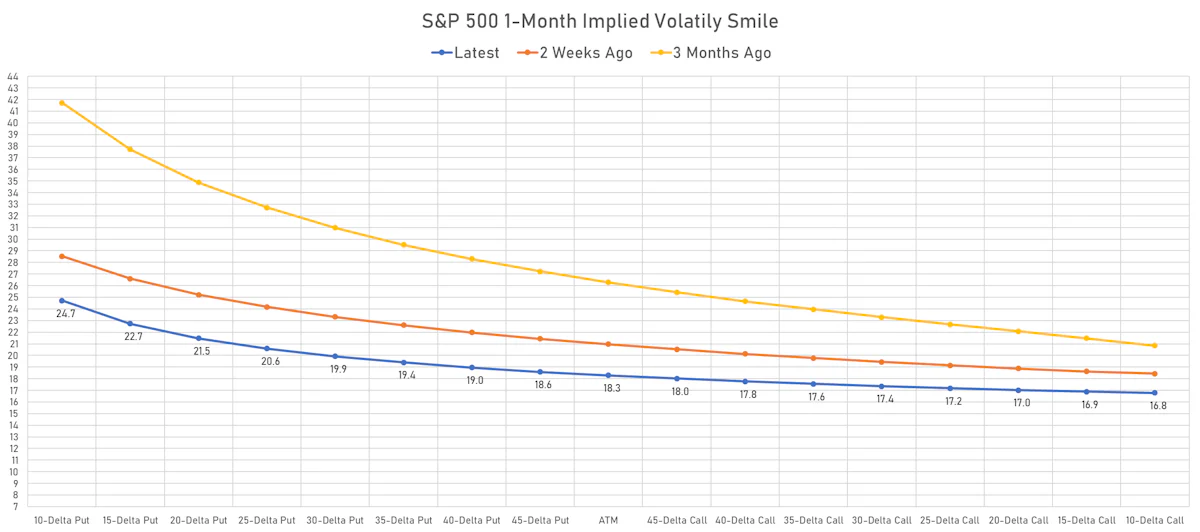
- 1-month at-the-money implied volatility on the S&P 500 at 18.3%, down from 18.7%
- 1-month at-the-money implied volatility on the Euro Stoxx 50 at 18.9%, down from 19.5%
S&P 500 2Q 2022 EARNINGS DASHBOARD
![]()
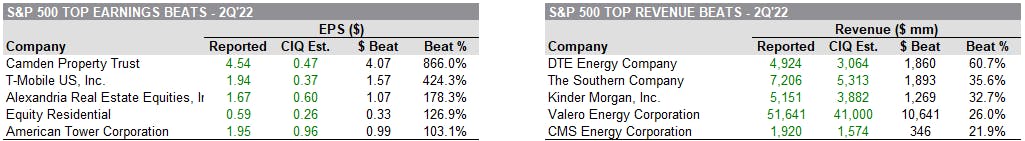
TOP BEATS
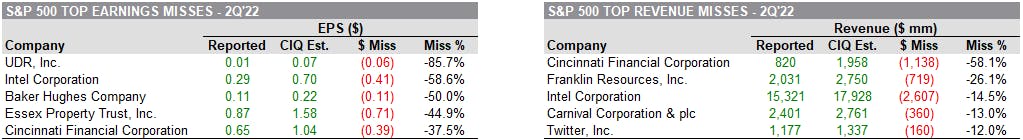
TOP MISSES
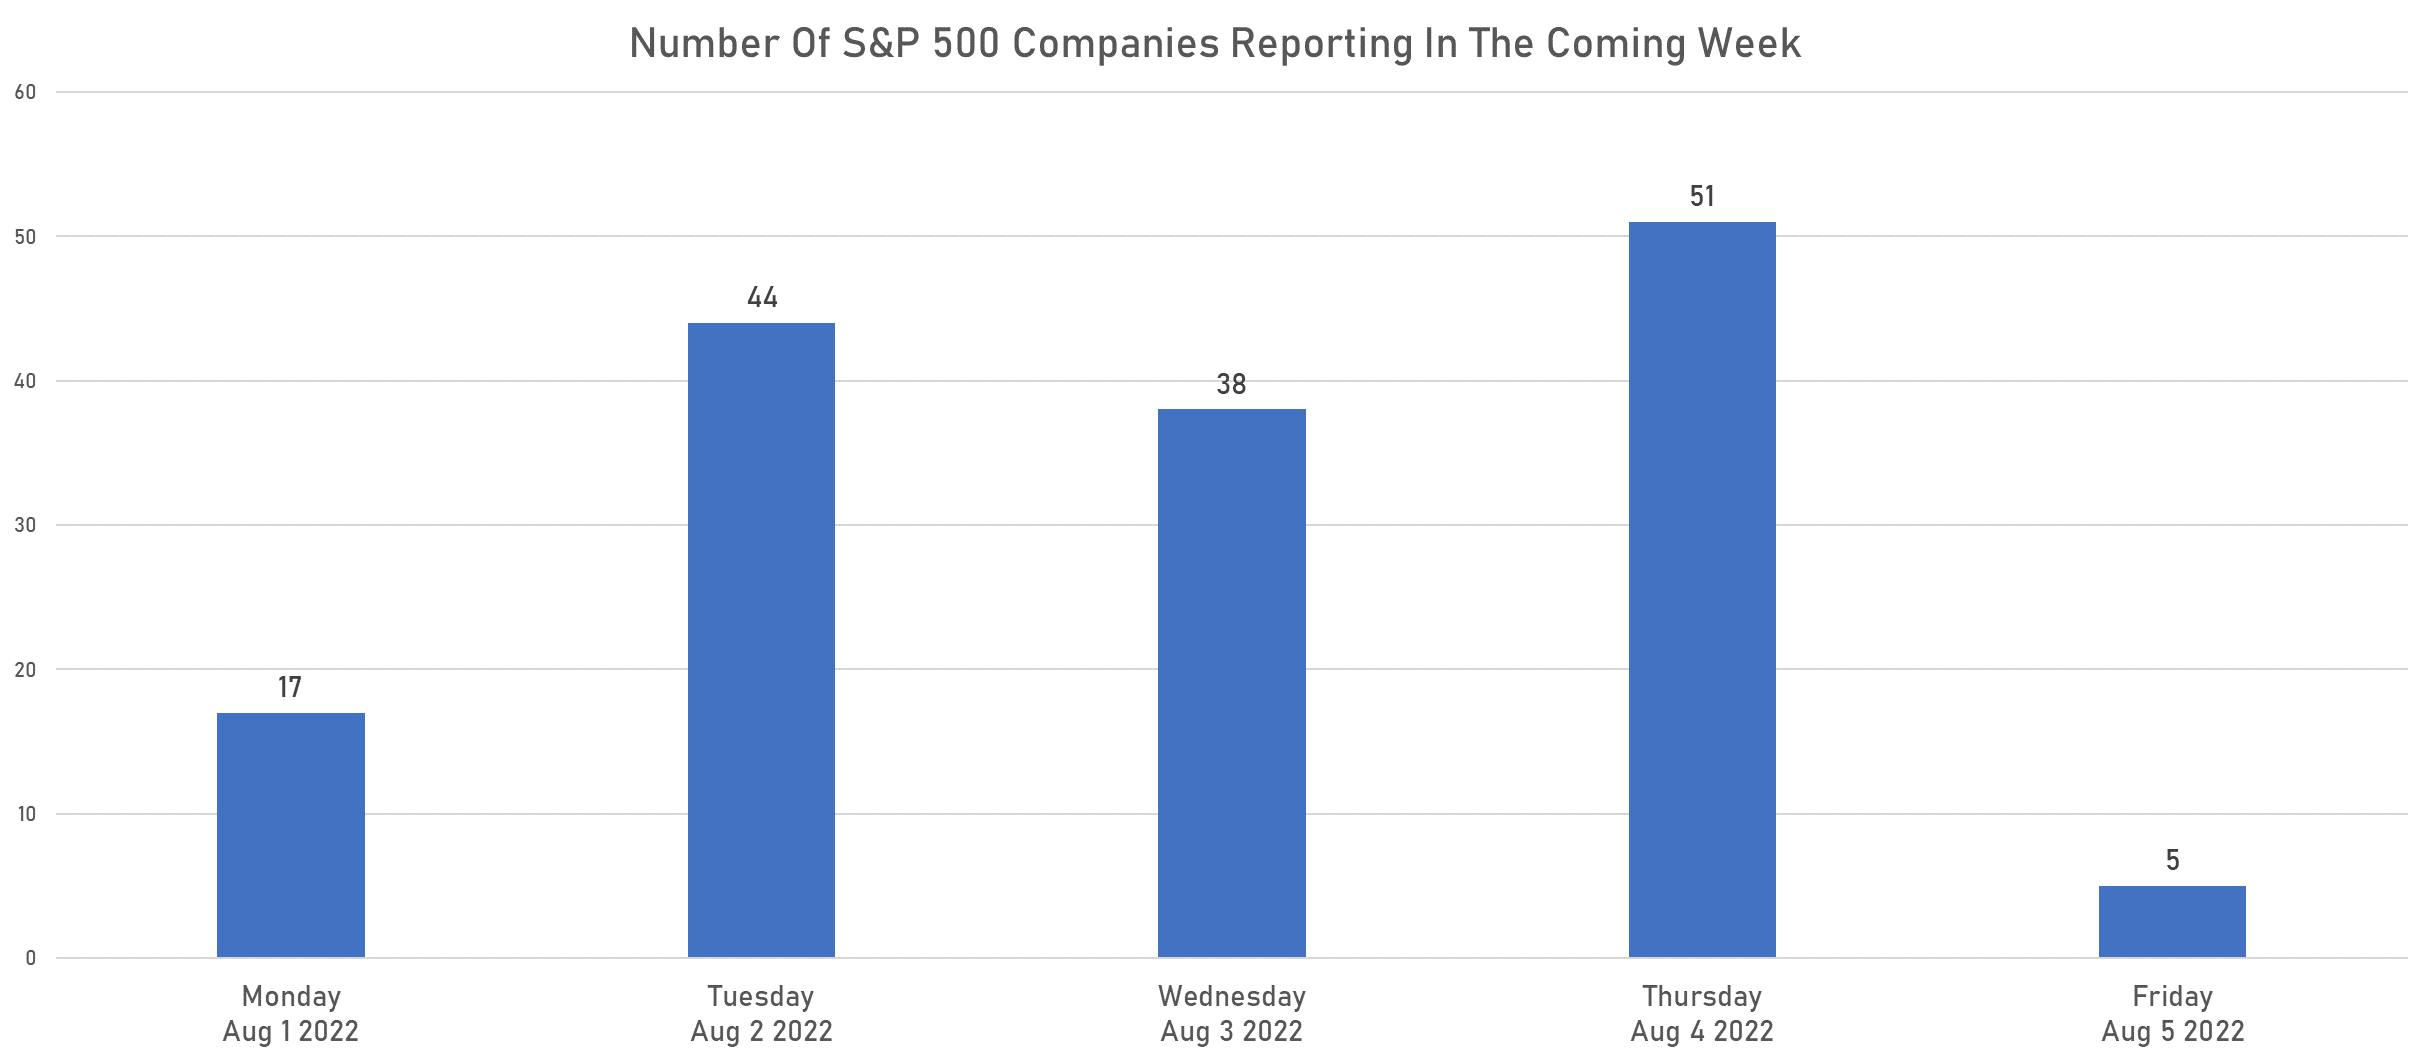
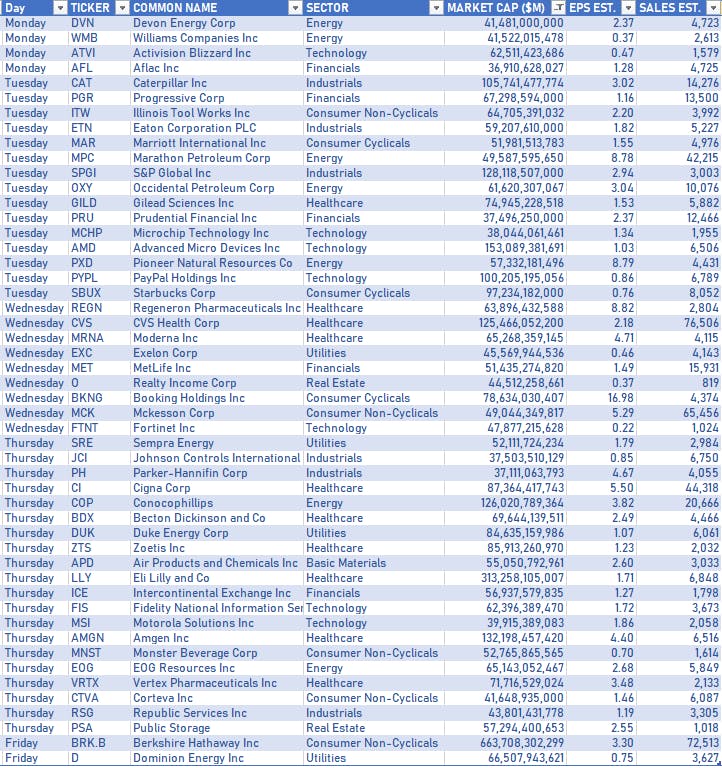
US EARNINGS NEXT WEEK
- Another 30% of the S&P 500 is reporting next week, with the Tuesday and Thursday as the busiest days
TOP S&P 500 PERFORMERS THIS WEEK
- Bath & Body Works Inc (BBWI), up 21.7% to $33.47 / YTD price return: -52.0% / 12-Month Price Range: $ 25.80-82.00 / Short interest (% of float): 8.4%; days to cover: 3.6
- HCA Healthcare Inc (HCA), up 17.7% to $202.03 / YTD price return: -21.4% / 12-Month Price Range: $ 164.55-279.01 / Short interest (% of float): 2.0%; days to cover: 2.1
- ETSY Inc (ETSY), up 17.7% to $97.11 / YTD price return: -55.6% / 12-Month Price Range: $ 67.06-307.34 / Short interest (% of float): 12.8%; days to cover: 4.0
- Netflix Inc (NFLX), up 16.6% to $220.44 / YTD price return: -63.4% / 12-Month Price Range: $ 162.81-700.50 / Short interest (% of float): 3.0%; days to cover: 1.5
- Tesla Inc (TSLA), up 13.4% to $816.73 / YTD price return: -22.7% / 12-Month Price Range: $ 620.60-1,243.25 / Short interest (% of float): 2.7%; days to cover: 0.8
- Caesars Entertainment Inc (CZR), up 13.3% to $42.65 / YTD price return: -54.4% / 12-Month Price Range: $ 35.10-119.79 / Short interest (% of float): 5.7%; days to cover: 2.8
- Las Vegas Sands Corp (LVS), up 12.9% to $38.99 / YTD price return: +3.6% / 12-Month Price Range: $ 28.88-48.26 / Short interest (% of float): 6.7%; days to cover: 2.9
- Generac Holdings Inc (GNRC), up 11.6% to $239.93 / YTD price return: -31.8% / 12-Month Price Range: $ 197.94-522.66 / Short interest (% of float): 8.8%; days to cover: 5.3
- Wynn Resorts Ltd (WYNN), up 11.3% to $61.73 / YTD price return: -27.4% / 12-Month Price Range: $ 50.22-109.10 / Short interest (% of float): 10.0%; days to cover: 3.0
- Autodesk Inc (ADSK), up 11.2% to $195.95 / YTD price return: -30.3% / 12-Month Price Range: $ 163.20-344.39 / Short interest (% of float): 1.2%; days to cover: 1.7
BOTTOM S&P 500 PERFORMERS THIS WEEK
- Stanley Black & Decker Inc (SWK), down 15.9% to $97.33 / YTD price return: -48.4% / 12-Month Price Range: $ 97.33-203.60 / Short interest (% of float): 3.6%; days to cover: 2.9 (the stock is currently on the short sale restriction list)
- Cincinnati Financial Corp (CINF), down 12.2% to $97.34 / YTD price return: -14.6% / 12-Month Price Range: $ 97.18-143.22 / Short interest (% of float): 2.1%; days to cover: 4.2
- Comcast Corp (CMCSA), down 11.9% to $37.52 / YTD price return: -25.5% / 12-Month Price Range: $ 37.52-61.80 / Short interest (% of float): 1.6%; days to cover: 3.0
- Newmont Corporation (NEM), down 11.9% to $45.28 / YTD price return: -27.0% / 12-Month Price Range: $ 44.00-86.37 / Short interest (% of float): 1.4%; days to cover: 1.8
- Baxter International Inc (BAX), down 11.3% to $58.66 / YTD price return: -31.7% / 12-Month Price Range: $ 58.66-89.69 / Short interest (% of float): 1.3%; days to cover: 2.3 (the stock is currently on the short sale restriction list)
- Charter Communications Inc (CHTR), down 11.0% to $432.10 / YTD price return: -33.7% / 12-Month Price Range: $ 407.75-825.62 / Short interest (% of float): 5.4%; days to cover: 5.9
- Teleflex Inc (TFX), down 9.3% to $240.46 / YTD price return: -26.8% / 12-Month Price Range: $ 235.15-405.97 / Short interest (% of float): 3.1%; days to cover: 4.3 (the stock is currently on the short sale restriction list)
- Intel Corp (INTC), down 7.4% to $36.31 / YTD price return: -29.5% / 12-Month Price Range: $ 35.55-56.28 / Short interest (% of float): 1.7%; days to cover: 2.0 (the stock is currently on the short sale restriction list)
- DISH Network Corp (DISH), down 7.1% to $17.37 / YTD price return: -46.5% / 12-Month Price Range: $ 16.21-46.30 / Short interest (% of float): 12.6%; days to cover: 6.8
- Garmin Ltd (GRMN), down 7.0% to $97.62 / YTD price return: -28.3% / 12-Month Price Range: $ 92.38-178.79 / Short interest (% of float): 1.7%; days to cover: 2.5
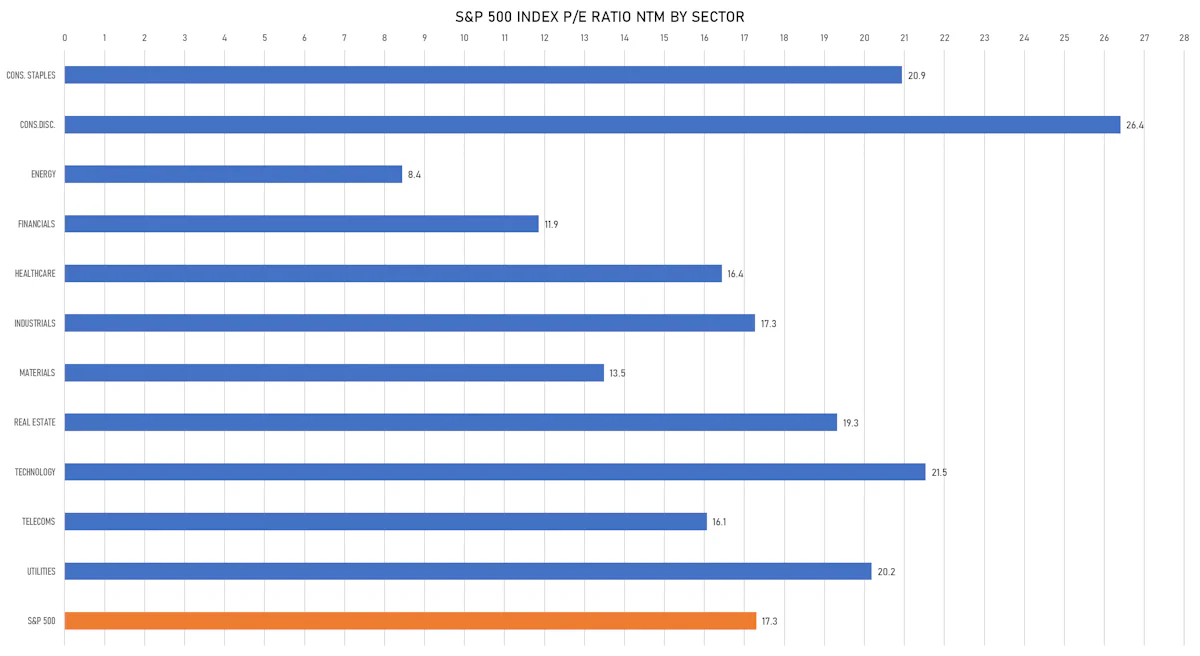
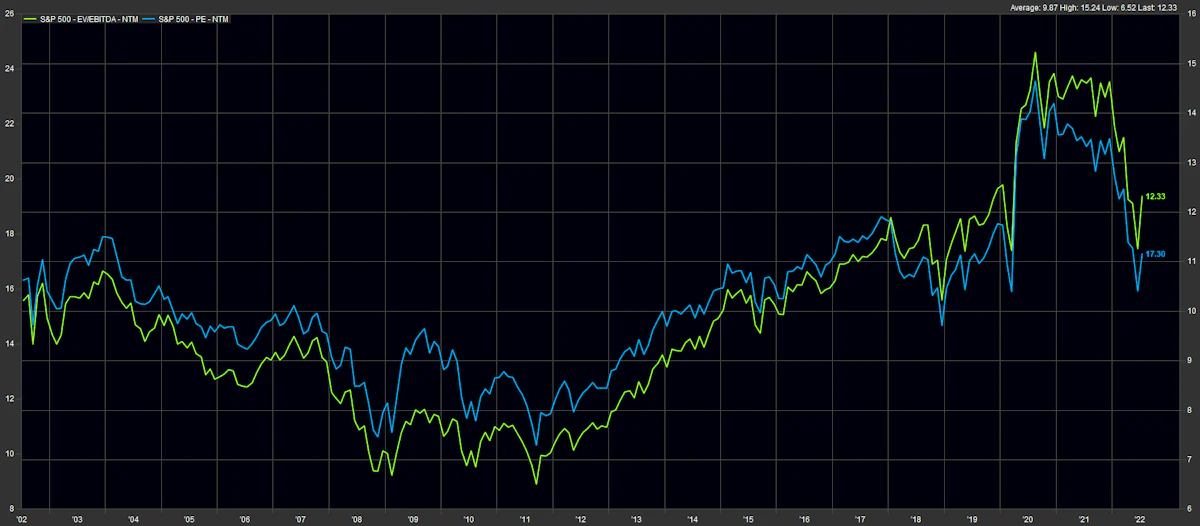
VALUATION MULTIPLES BY SECTORS
WEEKLY TOTAL RETURNS OF MAJOR GLOBAL EQUITY MARKETS
TOP / BOTTOM PERFORMING WORLD MARKETS YTD
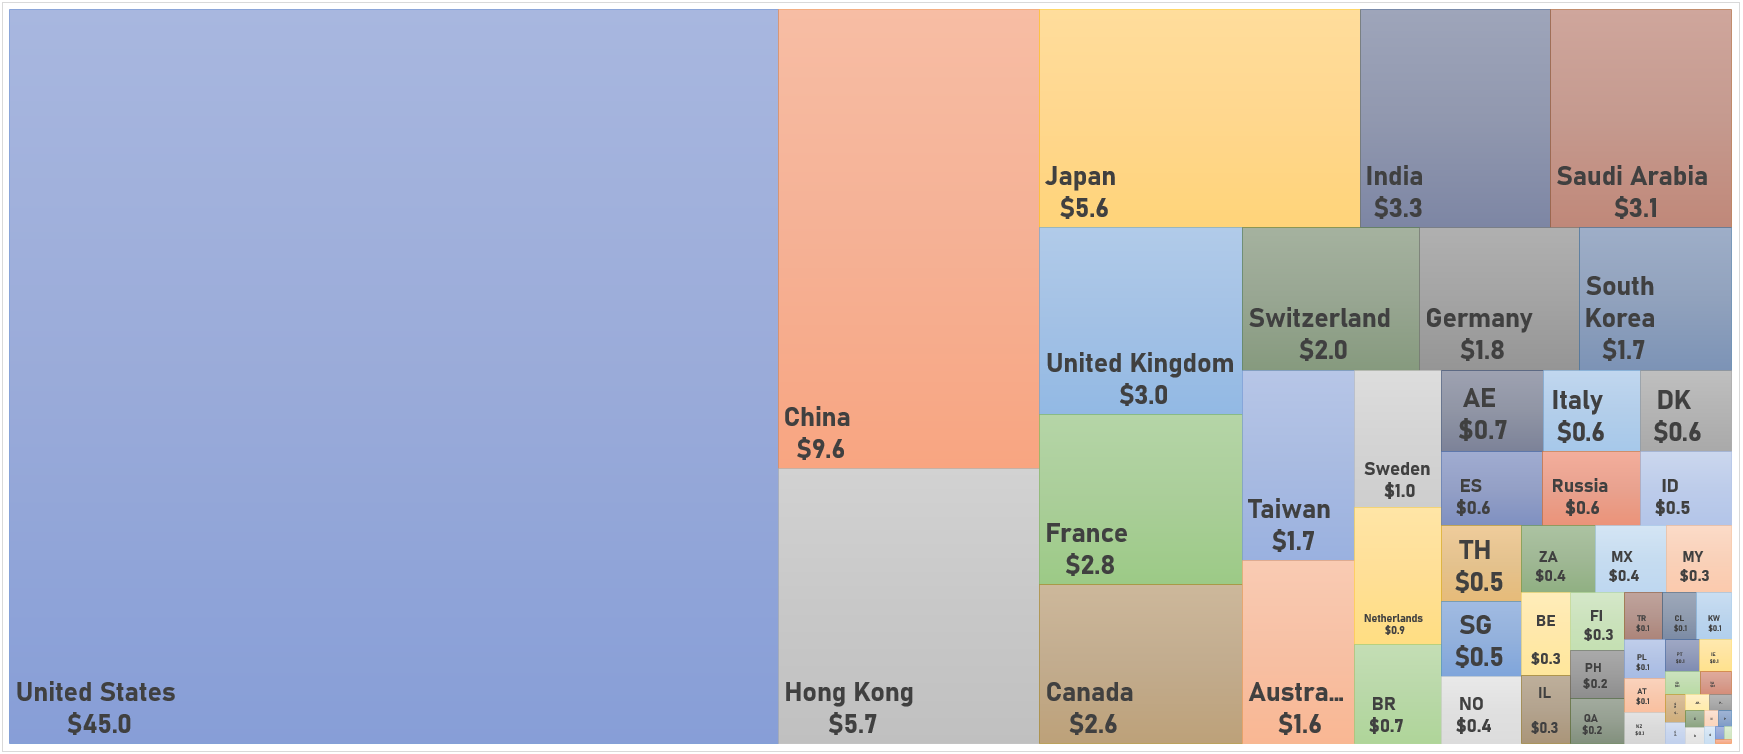
WORLD MARKET CAPITALIZATION ($ Trillion)