Equities
Mixed Day For Equities On Friday, A Fairly Positive Development Considering The Rates Backdrop
The second quarter earnings season is coming to an end, with 86% of S&P 500 companies having already reported, and the numbers are better than expected (though not spectacular from a historical perspective): about 60% of S&P 500 stocks beat on both revenue and earnings
Published ET
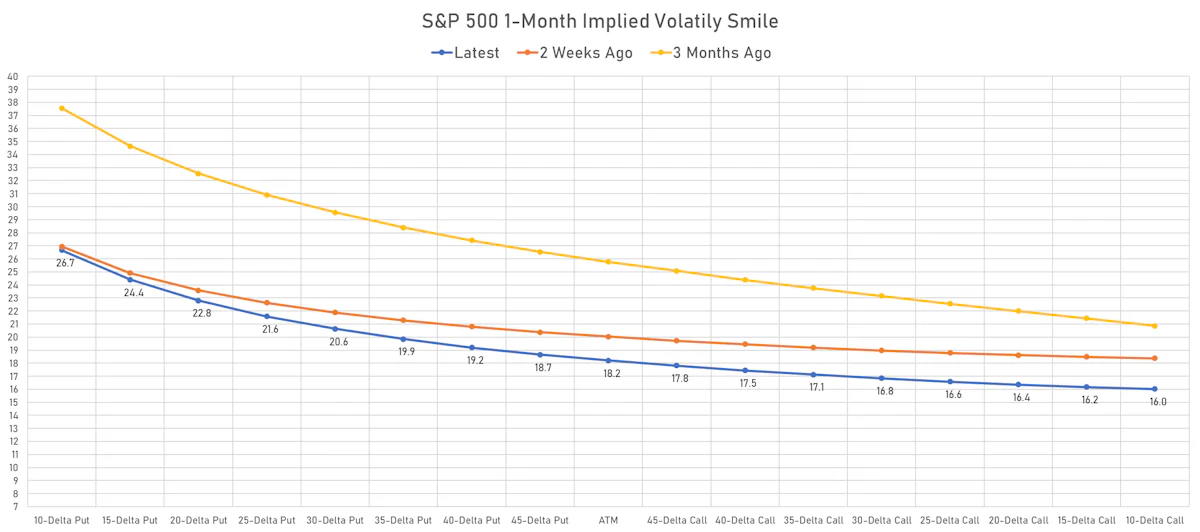
S&P 500 1-Month Implied Volatility Smile | Sources: ϕpost, Refinitiv data
DAILY SUMMARY
- Daily performance of US indices: S&P 500 down -0.16%; Nasdaq Composite down -0.50%; Wilshire 5000 down -0.03%
- 56.3% of S&P 500 stocks were up today, with 35.2% of stocks above their 200-day moving average (DMA) and 72.0% above their 50-DMA
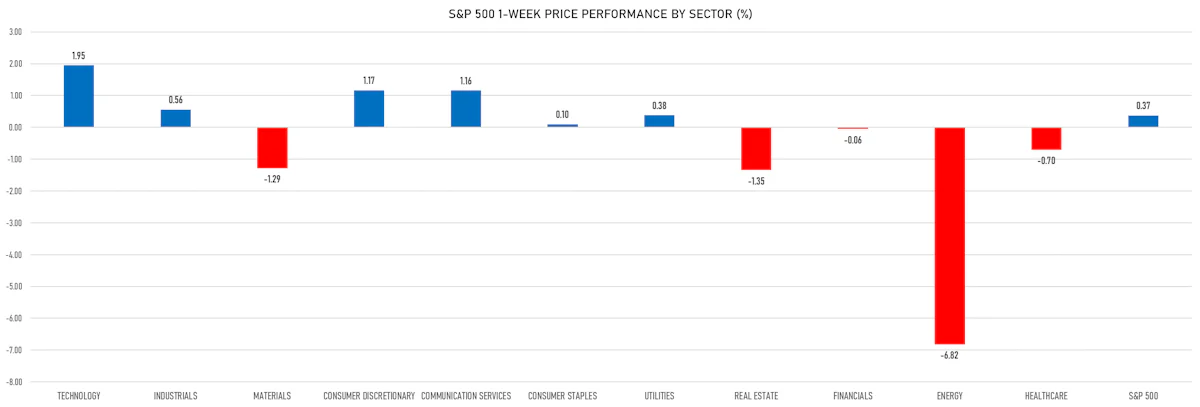
- Top performing sectors in the S&P 500: energy up 2.04% and financials up 0.79%
- Bottom performing sectors in the S&P 500: consumer discretionary down -1.66% and communication services down -0.88%
- The number of shares in the S&P 500 traded today was 542m for a total turnover of US$ 57 bn
- The S&P 500 Value Index was up 0.2%, while the S&P 500 Growth Index was down -0.5%; the S&P small caps index was up 0.5% and mid-caps were up 0.6%
- The volume on CME's INX (S&P 500 Index) was 2,027.5m (3-month z-score: -0.9); the 3-month average volume is 2,469.5m and the 12-month range is 1,340.2 - 4,692.3m
- Daily performance of international indices: Europe Stoxx 600 down -0.76%; UK FTSE 100 down -0.11%; Hang Seng SH-SZ-HK 300 Index up 0.77%; Japan's TOPIX 500 up 0.85%
VOLATILITY TODAY
- 1-month at-the-money implied volatility on the S&P 500 at 18.2%, down from 18.7%
- 1-month at-the-money implied volatility on the Euro Stoxx 50 at 19.1%, up from 19.0%
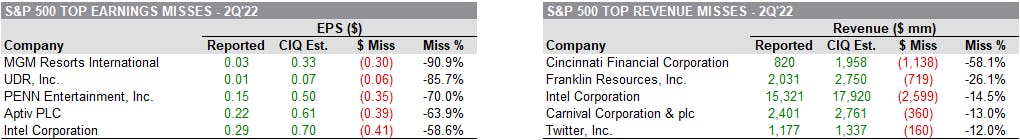
S&P 500 EARNINGS DASHBOARD
![]()
MOST NOTABLE EARNINGS BEATS
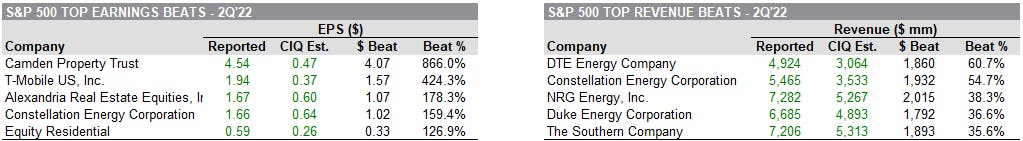
MOST NOTABLE EARNINGS MISSES
TOP S&P 500 PERFORMERS THIS WEEK
- Epam Systems Inc (EPAM), up 22.4% to $427.39 / YTD price return: -36.1% / 12-Month Price Range: $ 168.81-725.40 / Short interest (% of float): 1.9%; days to cover: 2.1
- Ceridian HCM Holding Inc (CDAY), up 18.8% to $65.04 / YTD price return: -37.7% / 12-Month Price Range: $ 43.23-130.35 / Short interest (% of float): 6.3%; days to cover: 5.7
- Monolithic Power Systems Inc (MPWR), up 14.5% to $532.33 / YTD price return: +7.9% / 12-Month Price Range: $ 348.73-579.19 / Short interest (% of float): 1.9%; days to cover: 2.0
- Moderna Inc (MRNA), up 13.9% to $186.84 / YTD price return: -26.4% / 12-Month Price Range: $ 115.64-497.00 / Short interest (% of float): 4.5%; days to cover: 2.9
- Constellation Energy Corp (CEG), up 12.4% to $74.30 / YTD price return: .0% / 12-Month Price Range: $ 38.00-74.30 / Short interest (% of float): 1.6%; days to cover: 1.9
- Paycom Software Inc (PAYC), up 12.0% to $370.01 / YTD price return: -10.9% / 12-Month Price Range: $ 256.04-558.57 / Short interest (% of float): 1.7%; days to cover: 2.3
- Gartner Inc (IT), up 11.2% to $295.44 / YTD price return: -11.7% / 12-Month Price Range: $ 221.39-368.85 / Short interest (% of float): 1.8%; days to cover: 3.2
- ServiceNow Inc (NOW), up 10.8% to $494.85 / YTD price return: -23.8% / 12-Month Price Range: $ 406.67-707.31 / Short interest (% of float): 2.0%; days to cover: 2.3
- DISH Network Corp (DISH), up 10.5% to $19.20 / YTD price return: -40.8% / 12-Month Price Range: $ 16.21-46.30 / Short interest (% of float): 11.3%
- PayPal Holdings Inc (PYPL), up 10.2% to $95.32 / YTD price return: -49.5% / 12-Month Price Range: $ 67.59-296.70 / Short interest (% of float): 2.0%; days to cover: 1.6
BOTTOM S&P 500 PERFORMERS THIS WEEK
- Ball Corp (BALL), down 23.2% to $56.36 / YTD price return: -41.5% / 12-Month Price Range: $ 56.36-98.00 / Short interest (% of float): 2.8%; days to cover: 4.1 (the stock is currently on the short sale restriction list)
- DXC Technology Co (DXC), down 19.2% to $25.54 / YTD price return: -20.7% / 12-Month Price Range: $ 25.07-41.87 / Short interest (% of float): 3.7%; days to cover: 5.4 (the stock is currently on the short sale restriction list)
- APA Corp (US) (APA), down 14.6% to $31.75 / YTD price return: +18.1% / 12-Month Price Range: $ 15.55-51.95 / Short interest (% of float): 3.0%; days to cover: 1.2
- Solaredge Technologies Inc (SEDG), down 12.4% to $315.50 / YTD price return: +12.4% / 12-Month Price Range: $ 200.95-389.00 / Short interest (% of float): 3.3%; days to cover: 2.2
- Marathon Oil Corp (MRO), down 12.2% to $21.77 / YTD price return: +32.6% / 12-Month Price Range: $ 10.42-33.23 / Short interest (% of float): 3.3%; days to cover: 1.1
- Assurant Inc (AIZ), down 11.7% to $155.29 / YTD price return: -.4% / 12-Month Price Range: $ 144.18-194.11 / Short interest (% of float): 1.4%; days to cover: 1.5
- Charles River Laboratories International Inc (CRL), down 10.8% to $223.38 / YTD price return: -40.7% / 12-Month Price Range: $ 203.54-460.21 / Short interest (% of float): 2.1%; days to cover: 2.2
- Lincoln National Corp (LNC), down 10.5% to $45.94 / YTD price return: -32.7% / 12-Month Price Range: $ 44.89-77.55 / Short interest (% of float): 3.3%; days to cover: 3.3
- Fortinet Inc (FTNT), down 10.5% to $53.39 / YTD price return: -25.7% / 12-Month Price Range: $ 48.76-74.11 / Short interest (% of float): 1.8%; days to cover: 2.3
- Occidental Petroleum Corp (OXY), down 10.3% to $59.01 / YTD price return: +103.6% / 12-Month Price Range: $ 21.62-74.04 / Short interest (% of float): 6.1%; days to cover: 1.9
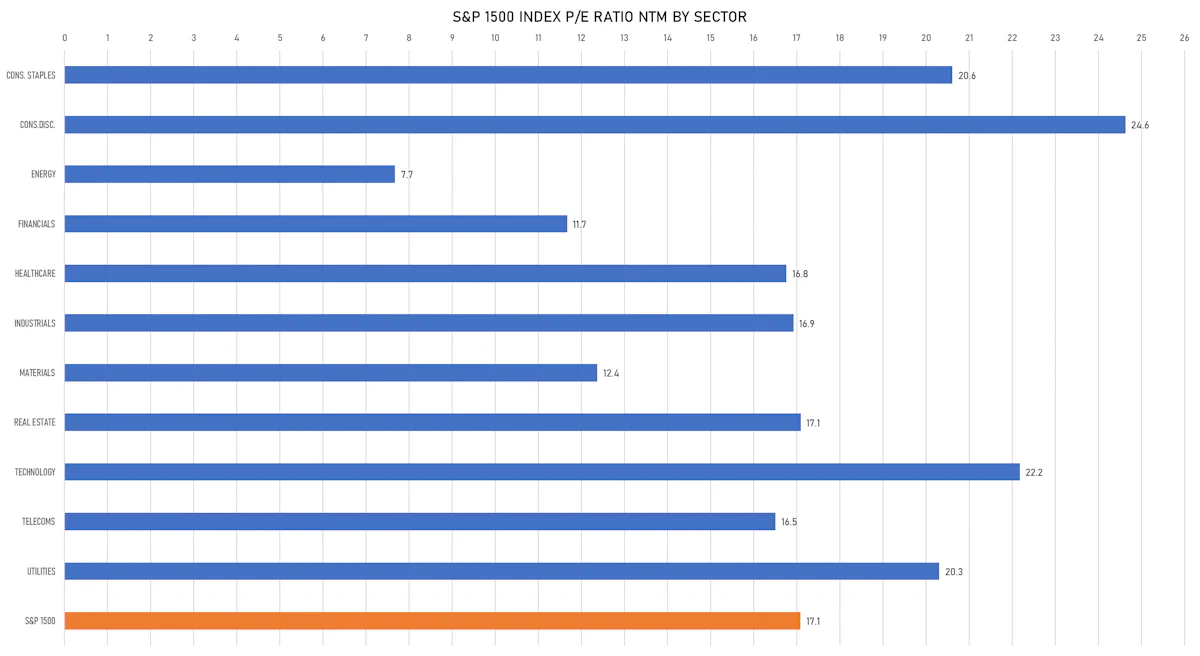
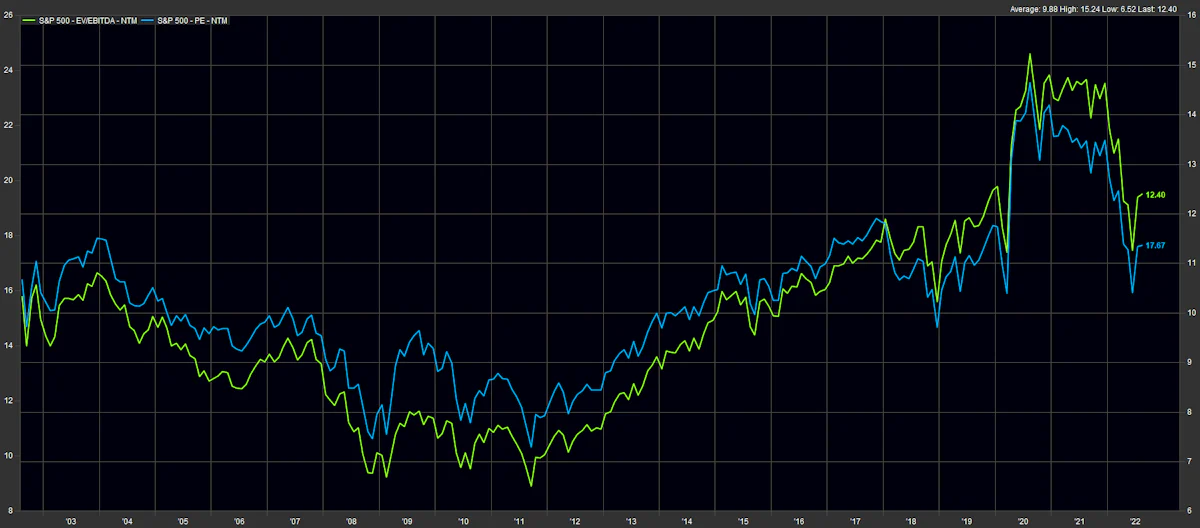
VALUATION MULTIPLES BY SECTORS
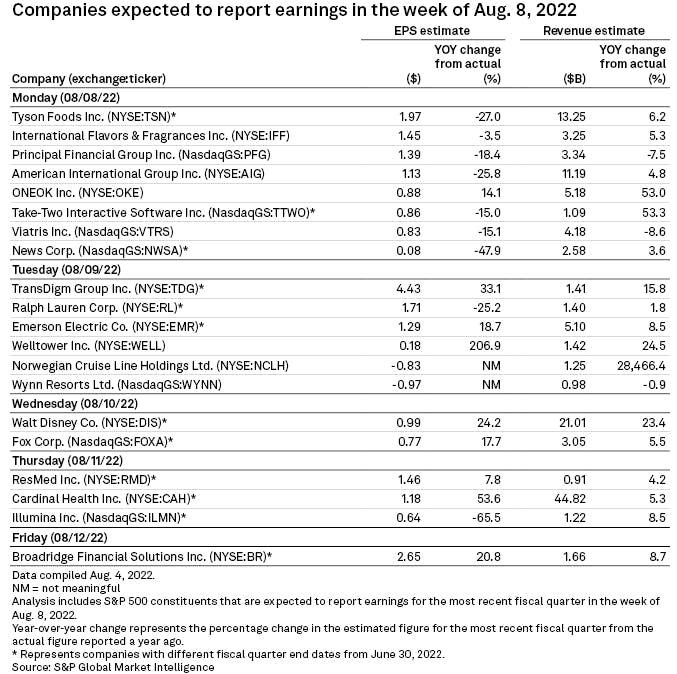
MAIN COMPANIES REPORTING NEXT WEEK
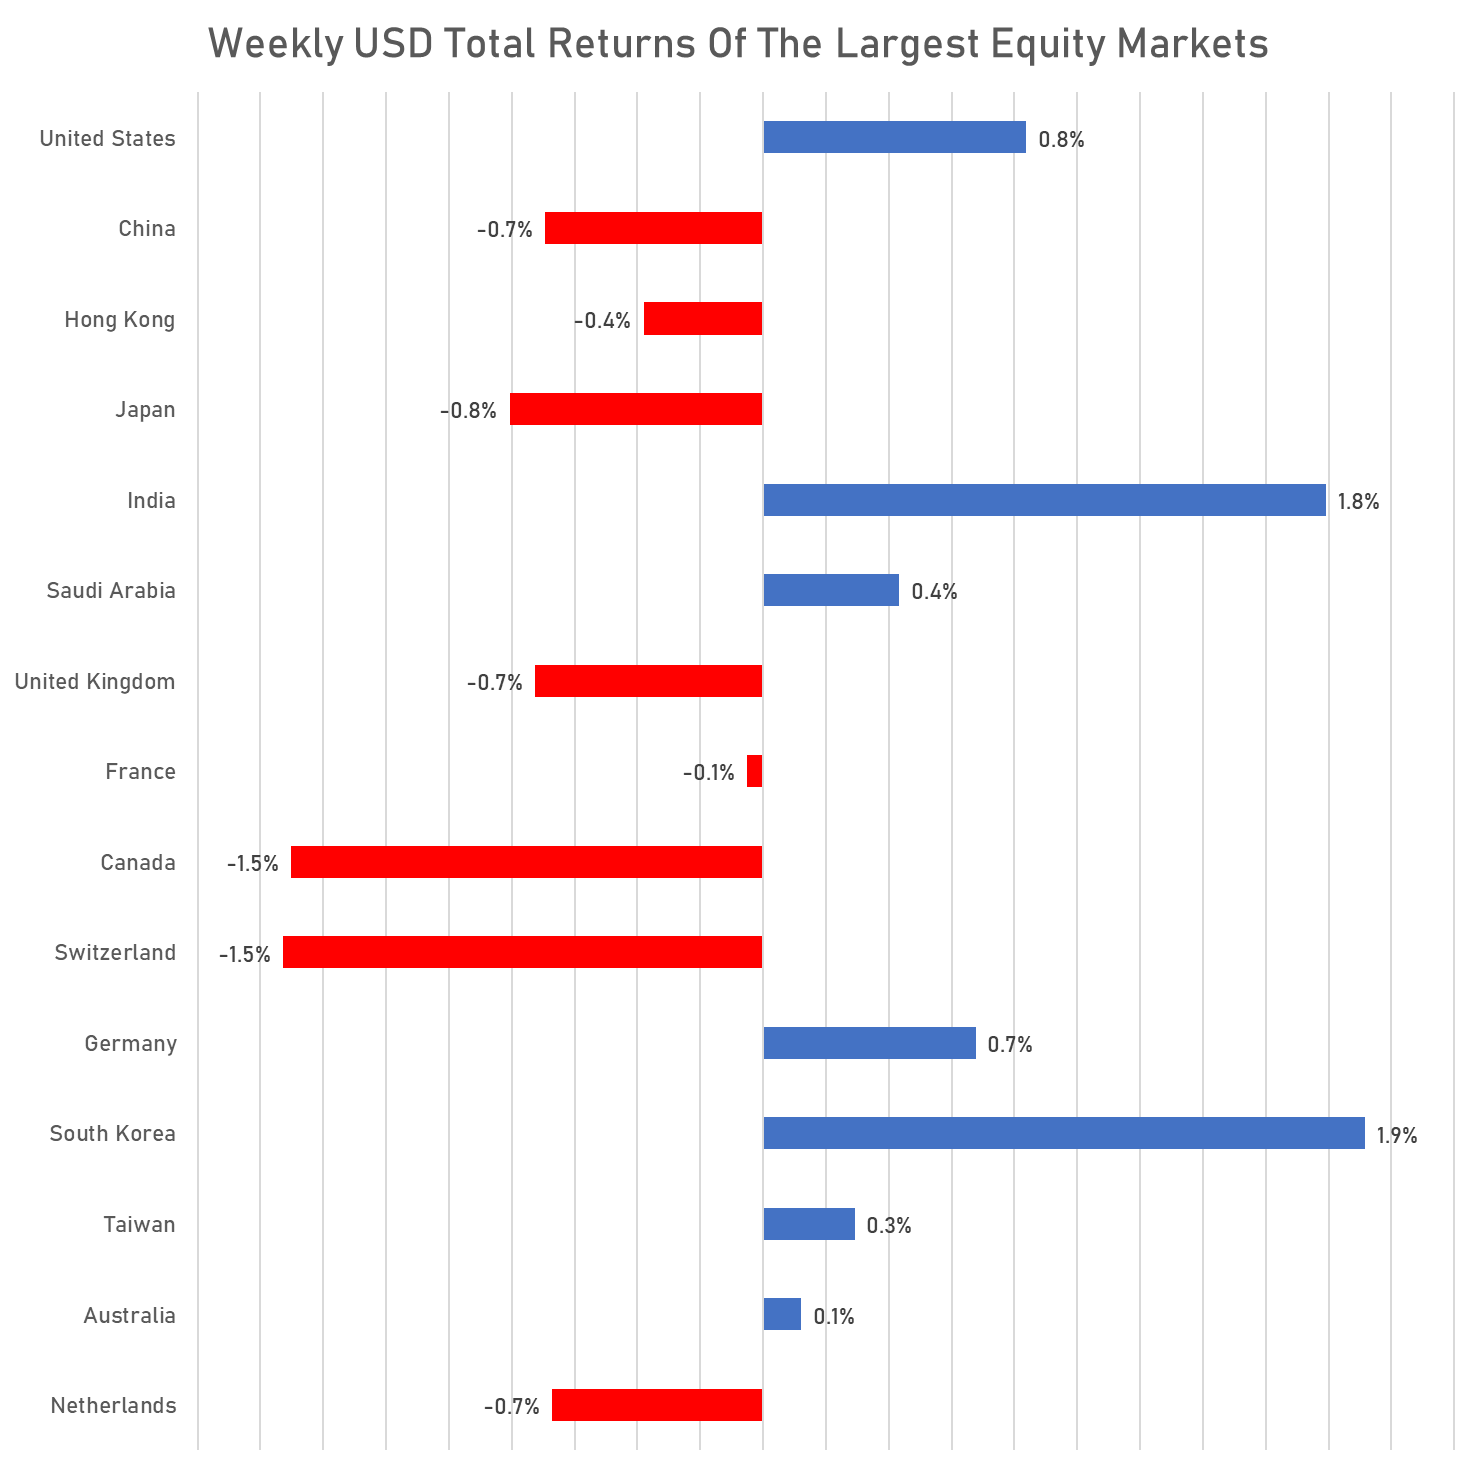
WEEKLY TOTAL RETURNS OF MAJOR GLOBAL EQUITY MARKETS
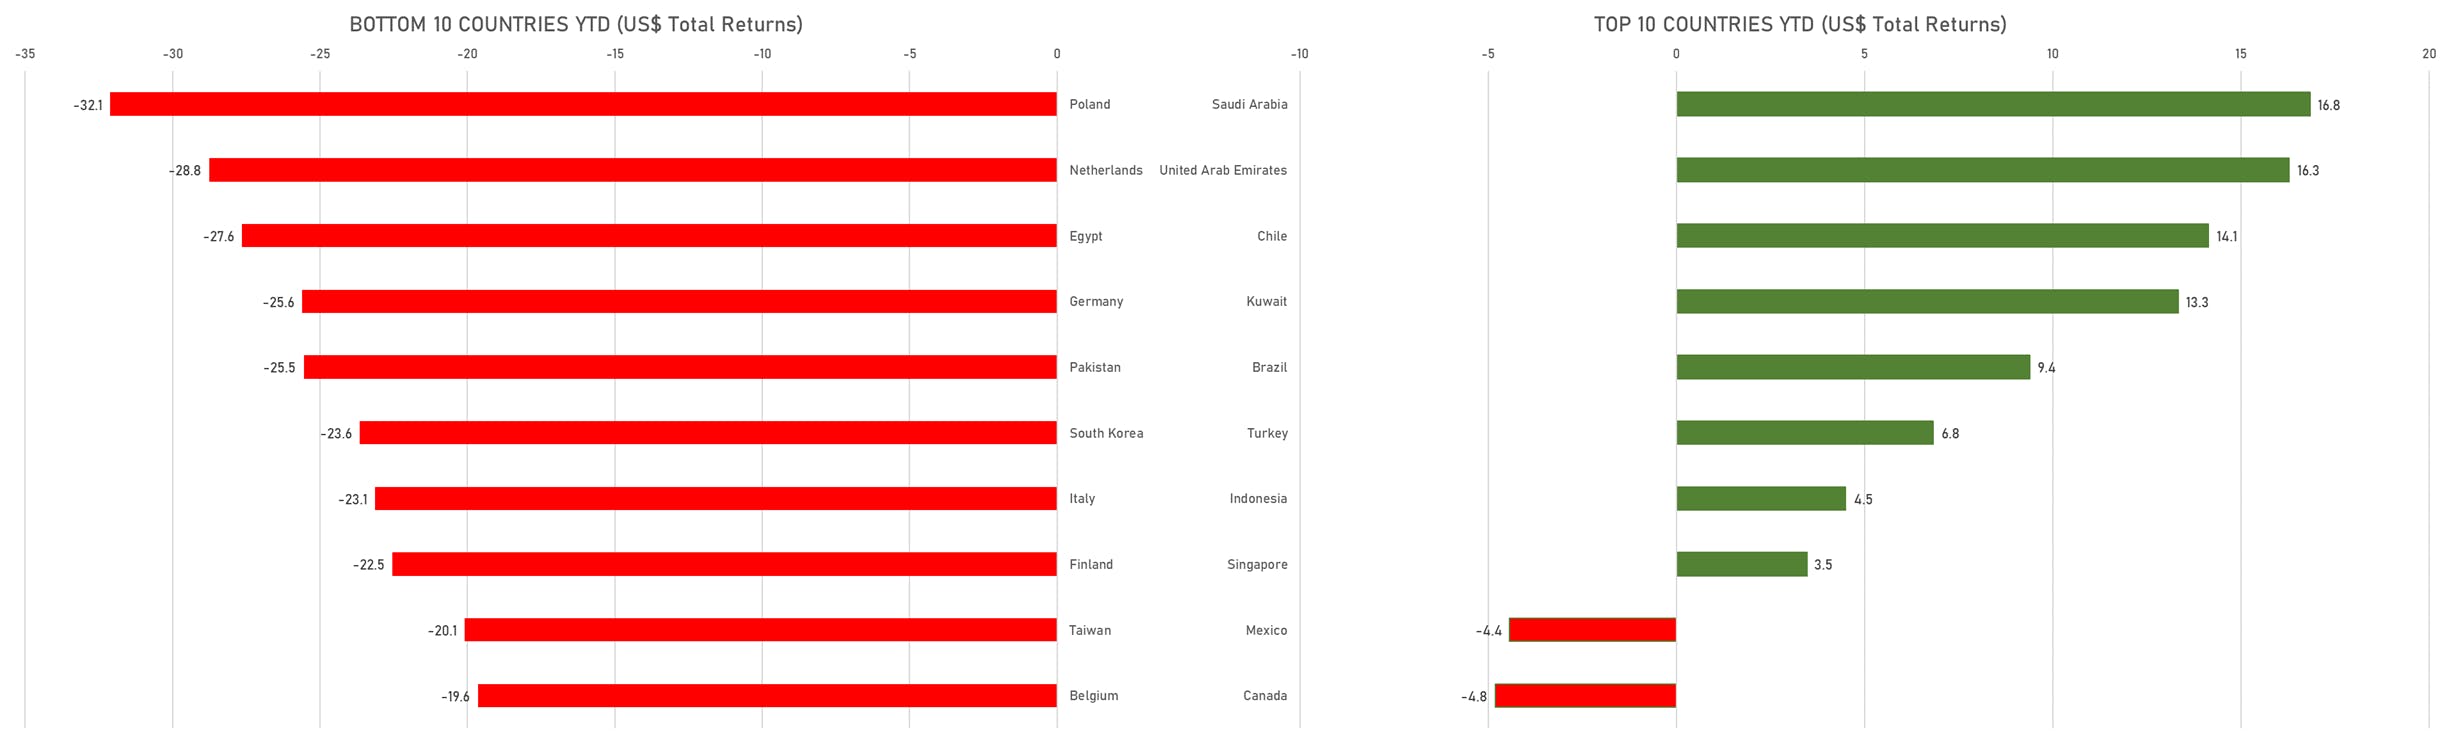
TOP / BOTTOM PERFORMING WORLD MARKETS YTD
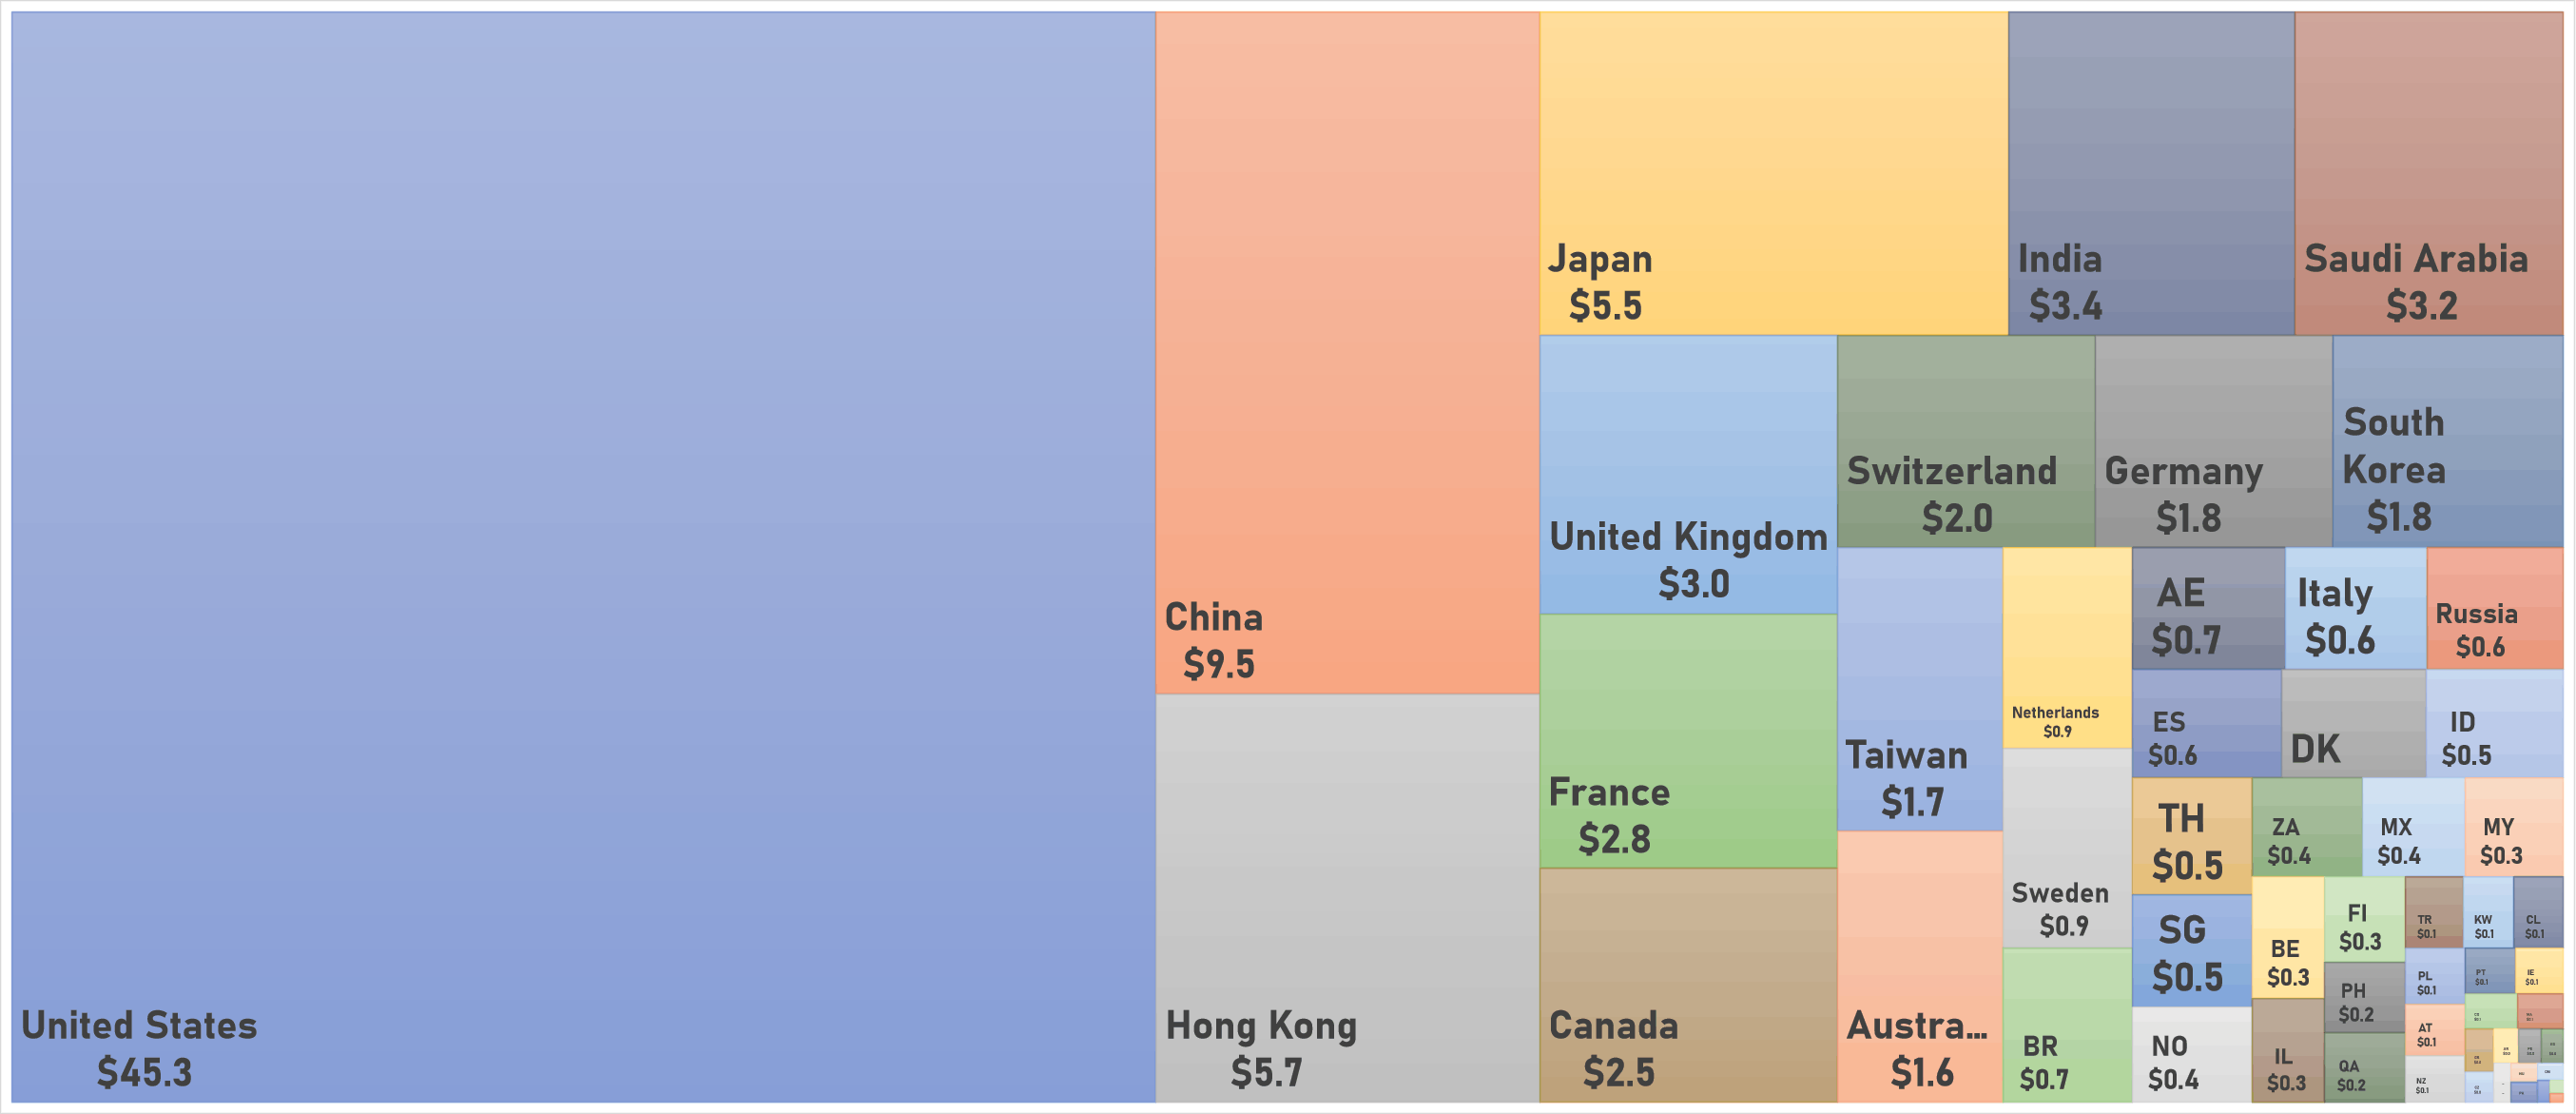
WORLD MARKET CAPITALIZATION (US$ Trillion)