Equities
US Equities Fly Higher As 2Q22 Earnings Showed Surprisingly Robust Margins, Corporates Mostly Able To Pass On Higher Costs
The path of least resistance is up for now, with strong technicals and low summer liquidity; but at some point, perhaps after Jackson Hole, the Fed will have to ensure that financial conditions aren't getting too loose to bring down inflation
Published ET
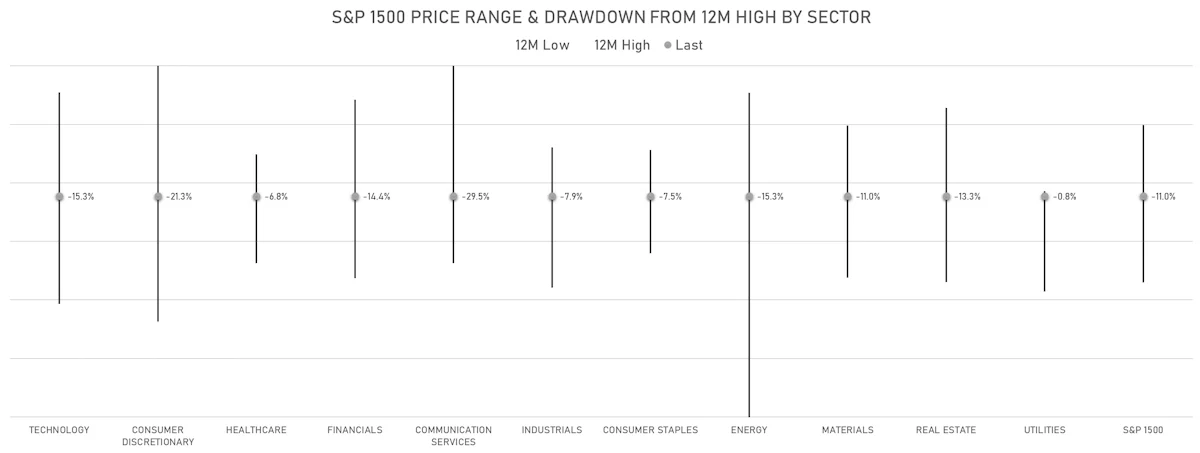
S&P 1500 Drawdowns From 12M Highs By Sector | Sources: ϕpost, Refinitiv data
DAILY SUMMARY
- Daily performance of US indices: S&P 500 up 1.73%; Nasdaq Composite up 2.09%; Wilshire 5000 up 1.76%
- 94.4% of S&P 500 stocks were up today, with 44.5% of stocks above their 200-day moving average (DMA) and 91.8% above their 50-DMA
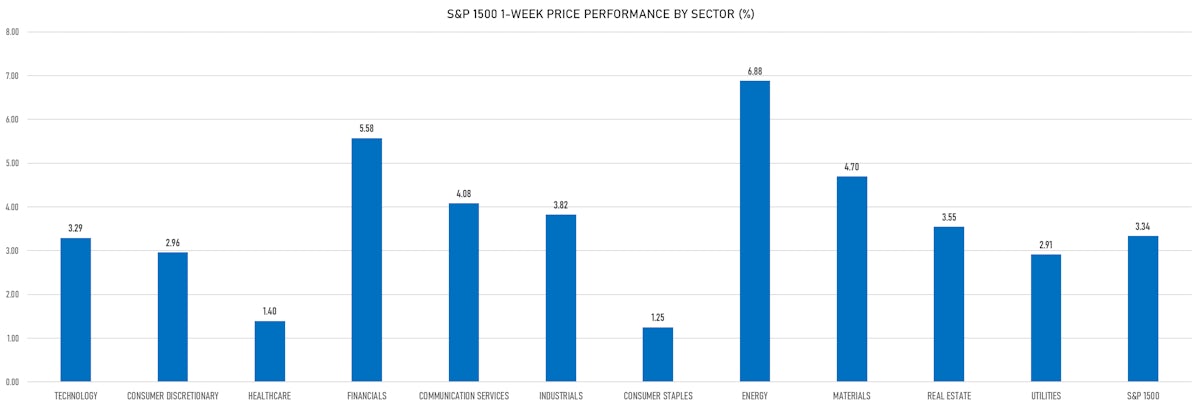
- Top performing sectors in the S&P 500: consumer discretionary up 2.30% and technology up 2.07%
- Bottom performing sectors in the S&P 500: energy up 0.80% and consumer staples up 0.92%
- The number of shares in the S&P 500 traded today was 509m for a total turnover of US$ 57 bn
- The S&P 500 Value Index was up 1.4%, while the S&P 500 Growth Index was up 2.1%; the S&P small caps index was up 1.8% and mid-caps were up 1.5%
- The volume on CME's INX (S&P 500 Index) was 1828.5m (3-month z-score: -1.2); the 3-month average volume is 2406.3m and the 12-month range is 1340.2 - 4692.3m
- Daily performance of international indices: Europe Stoxx 600 up 0.16%; UK FTSE 100 up 0.47%; Hang Seng SH-SZ-HK 300 Index up 0.21%; Japan's TOPIX 500 up 2.07%
VOLATILITY TODAY
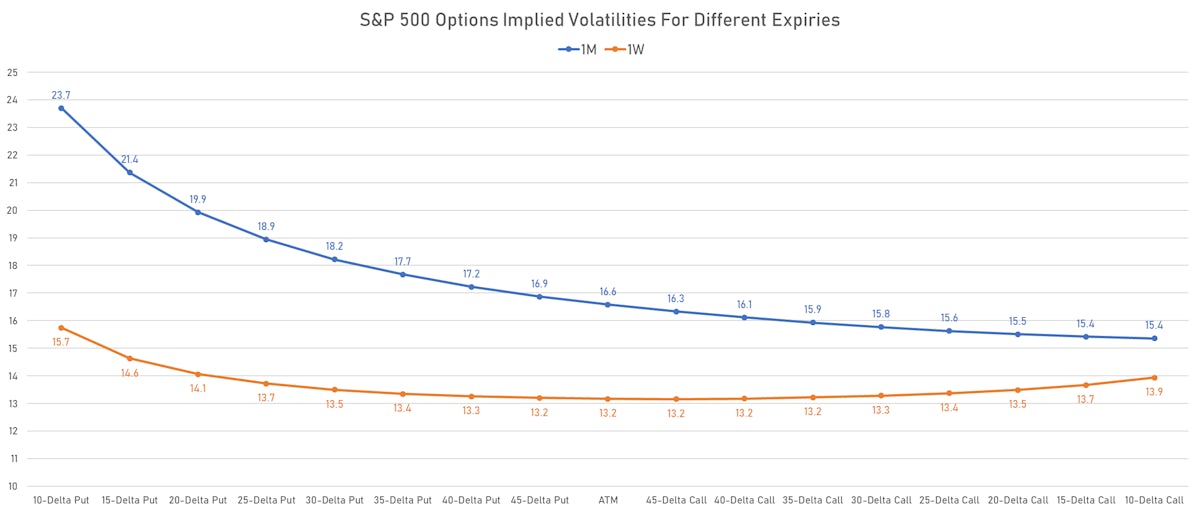
- 1-month at-the-money implied volatility on the S&P 500 at 16.6%, down from 17.0%
- 1-month at-the-money implied volatility on the Euro Stoxx 50 at 17.4%, down from 17.8%
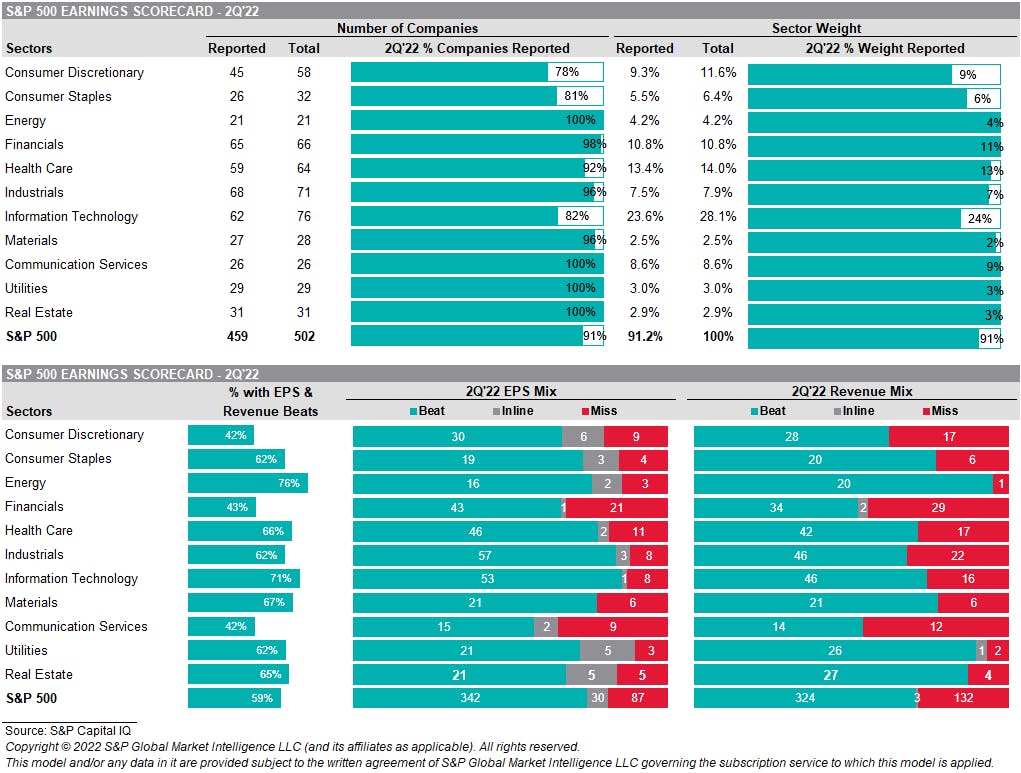
S&P 500 EARNINGS DASHBOARD
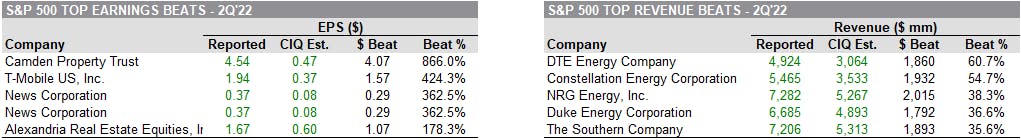
TOP EARNINGS BEATS
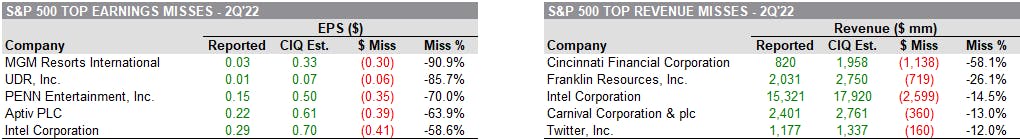
TOP EARNINGS MISSES
TOP S&P 500 PERFORMERS THIS WEEK
- Nielsen Holdings PLC (NLSN), up 19.7% to $27.58 / YTD price return: +34.5% / 12-Month Price Range: $ 16.02-27.77 / Short interest (% of float): 4.8%; days to cover: 6.9
- Albemarle Corp (ALB), up 18.3% to $281.57 / YTD price return: +20.4% / 12-Month Price Range: $ 169.95-291.48 / Short interest (% of float): 2.0%; days to cover: 1.9
- Principal Financial Group Inc (PFG), up 16.5% to $79.51 / YTD price return: +9.9% / 12-Month Price Range: $ 60.97-80.34 / Short interest (% of float): 4.2%; days to cover: 6.9
- Devon Energy Corp (DVN), up 15.7% to $65.55 / YTD price return: +48.8% / 12-Month Price Range: $ 24.47-79.40 / Short interest (% of float): 2.1%; days to cover: 1.0
- Viatris Inc (VTRS), up 14.4% to $11.13 / YTD price return: -17.7% / 12-Month Price Range: $ 9.45-15.60 / Short interest (% of float): 2.2%; days to cover: 2.4
- Walt Disney Co (DIS), up 14.0% to $121.57 / YTD price return: -21.5% / 12-Month Price Range: $ 90.23-187.57 / Short interest (% of float): 1.1%; days to cover: 1.9
- Aptiv PLC (APTV), up 13.2% to $111.43 / YTD price return: -32.4% / 12-Month Price Range: $ 84.15-180.70 / Short interest (% of float): 2.0%; days to cover: 2.8
- Generac Holdings Inc (GNRC), up 13.1% to $280.52 / YTD price return: -20.3% / 12-Month Price Range: $ 197.94-522.66 / Short interest (% of float): 9.0%; days to cover: 5.8
- Cardinal Health Inc (CAH), up 12.7% to $69.32 / YTD price return: +34.6% / 12-Month Price Range: $ 45.86-69.32 / Short interest (% of float): 2.4%; days to cover: 2.9
- SVB Financial Group (SIVB), up 12.3% to $464.24 / YTD price return: -31.6% / 12-Month Price Range: $ 355.42-763.22 / Short interest (% of float): 3.0%; days to cover: 2.9
BOTTOM S&P 500 PERFORMERS THIS WEEK
- Moderna Inc (MRNA), down 8.4% to $171.18 / YTD price return: -32.6% / 12-Month Price Range: $ 115.64-464.85 / Short interest (% of float): 4.2%; days to cover: 3.1
- Illumina Inc (ILMN), down 6.9% to $208.33 / YTD price return: -45.2% / 12-Month Price Range: $ 173.48-526.00 / Short interest (% of float): 1.9%; days to cover: 2.0 (the stock is currently on the short sale restriction list)
- Tyson Foods Inc (TSN), down 6.5% to $81.79 / YTD price return: -6.2% / 12-Month Price Range: $ 74.43-100.70 / Short interest (% of float): 1.7%; days to cover: 2.8
- Warner Bros Discovery Inc (WBD), down 6.2% to $13.68 / YTD price return: -41.9% / 12-Month Price Range: $ 12.77-31.55 / Short interest (% of float): 2.7%; days to cover: 2.9
- KLA Corp (KLAC), down 3.7% to $381.20 / YTD price return: -11.4% / 12-Month Price Range: $ 282.97-456.98 / Short interest (% of float): 5.3%; days to cover: 4.8
- Johnson & Johnson (JNJ), down 3.4% to $165.30 / YTD price return: -3.4% / 12-Month Price Range: $ 155.72-186.69 / Short interest (% of float): 0.5%; days to cover: 1.7
- Take-Two Interactive Software Inc (TTWO), down 3.2% to $123.14 / YTD price return: -30.7% / 12-Month Price Range: $ 101.85-195.83 / Short interest (% of float): 2.8%; days to cover: 2.5
- IDEXX Laboratories Inc (IDXX), down 2.8% to $396.43 / YTD price return: -39.8% / 12-Month Price Range: $ 318.50-694.95 / Short interest (% of float): 2.0%; days to cover: 2.8
- Tyler Technologies Inc (TYL), down 2.3% to $409.34 / YTD price return: -23.9% / 12-Month Price Range: $ 300.96-553.82 / Short interest (% of float): 1.4%; days to cover: 2.4
- Visa Inc (V), down 2.1% to $211.33 / YTD price return: -2.5% / 12-Month Price Range: $ 185.99-236.96 / Short interest (% of float): 2.1%; days to cover: 5.3
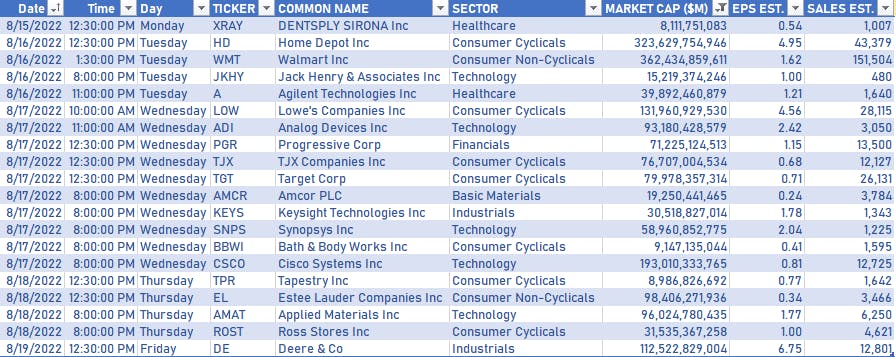
NOTABLE US EARNINGS RELEASES NEXT WEEK
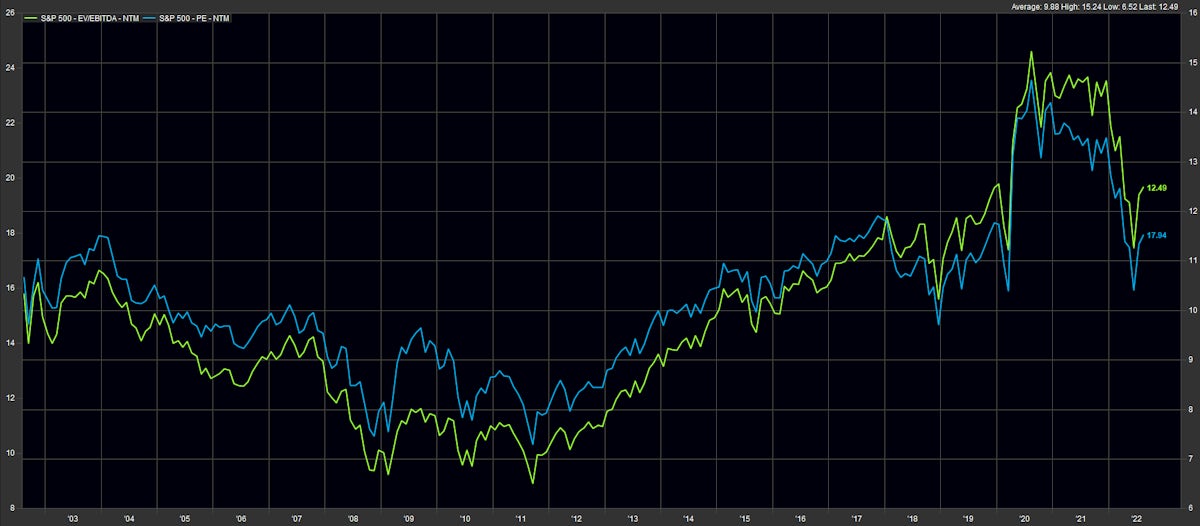
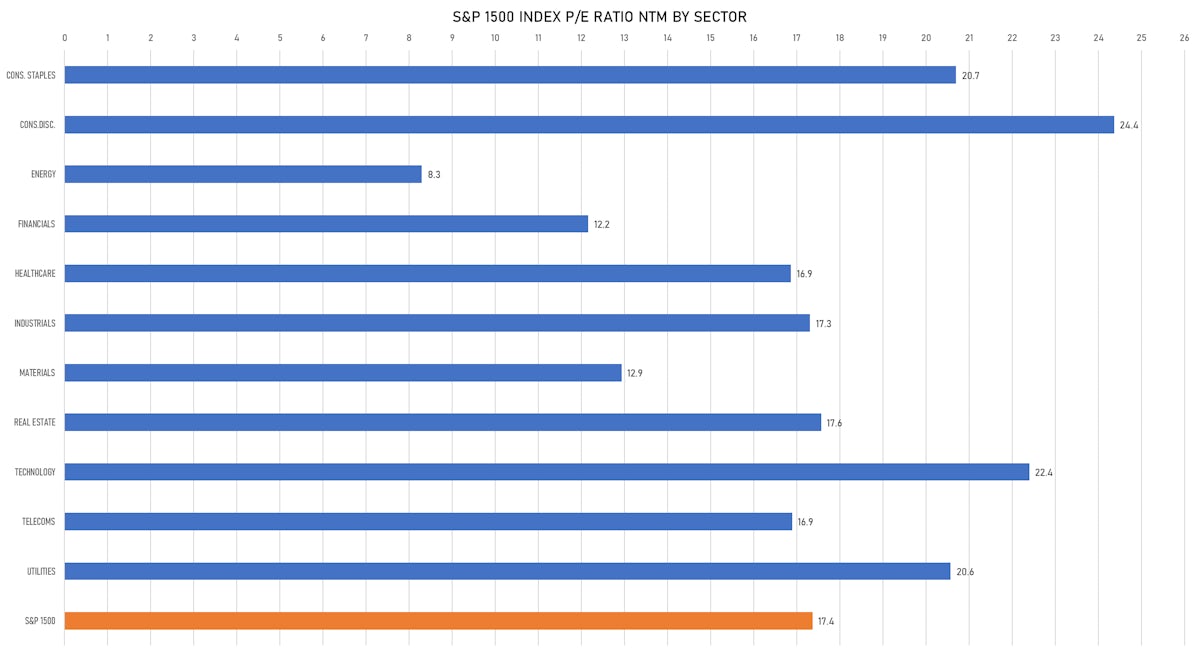
VALUATION MULTIPLES BY SECTORS
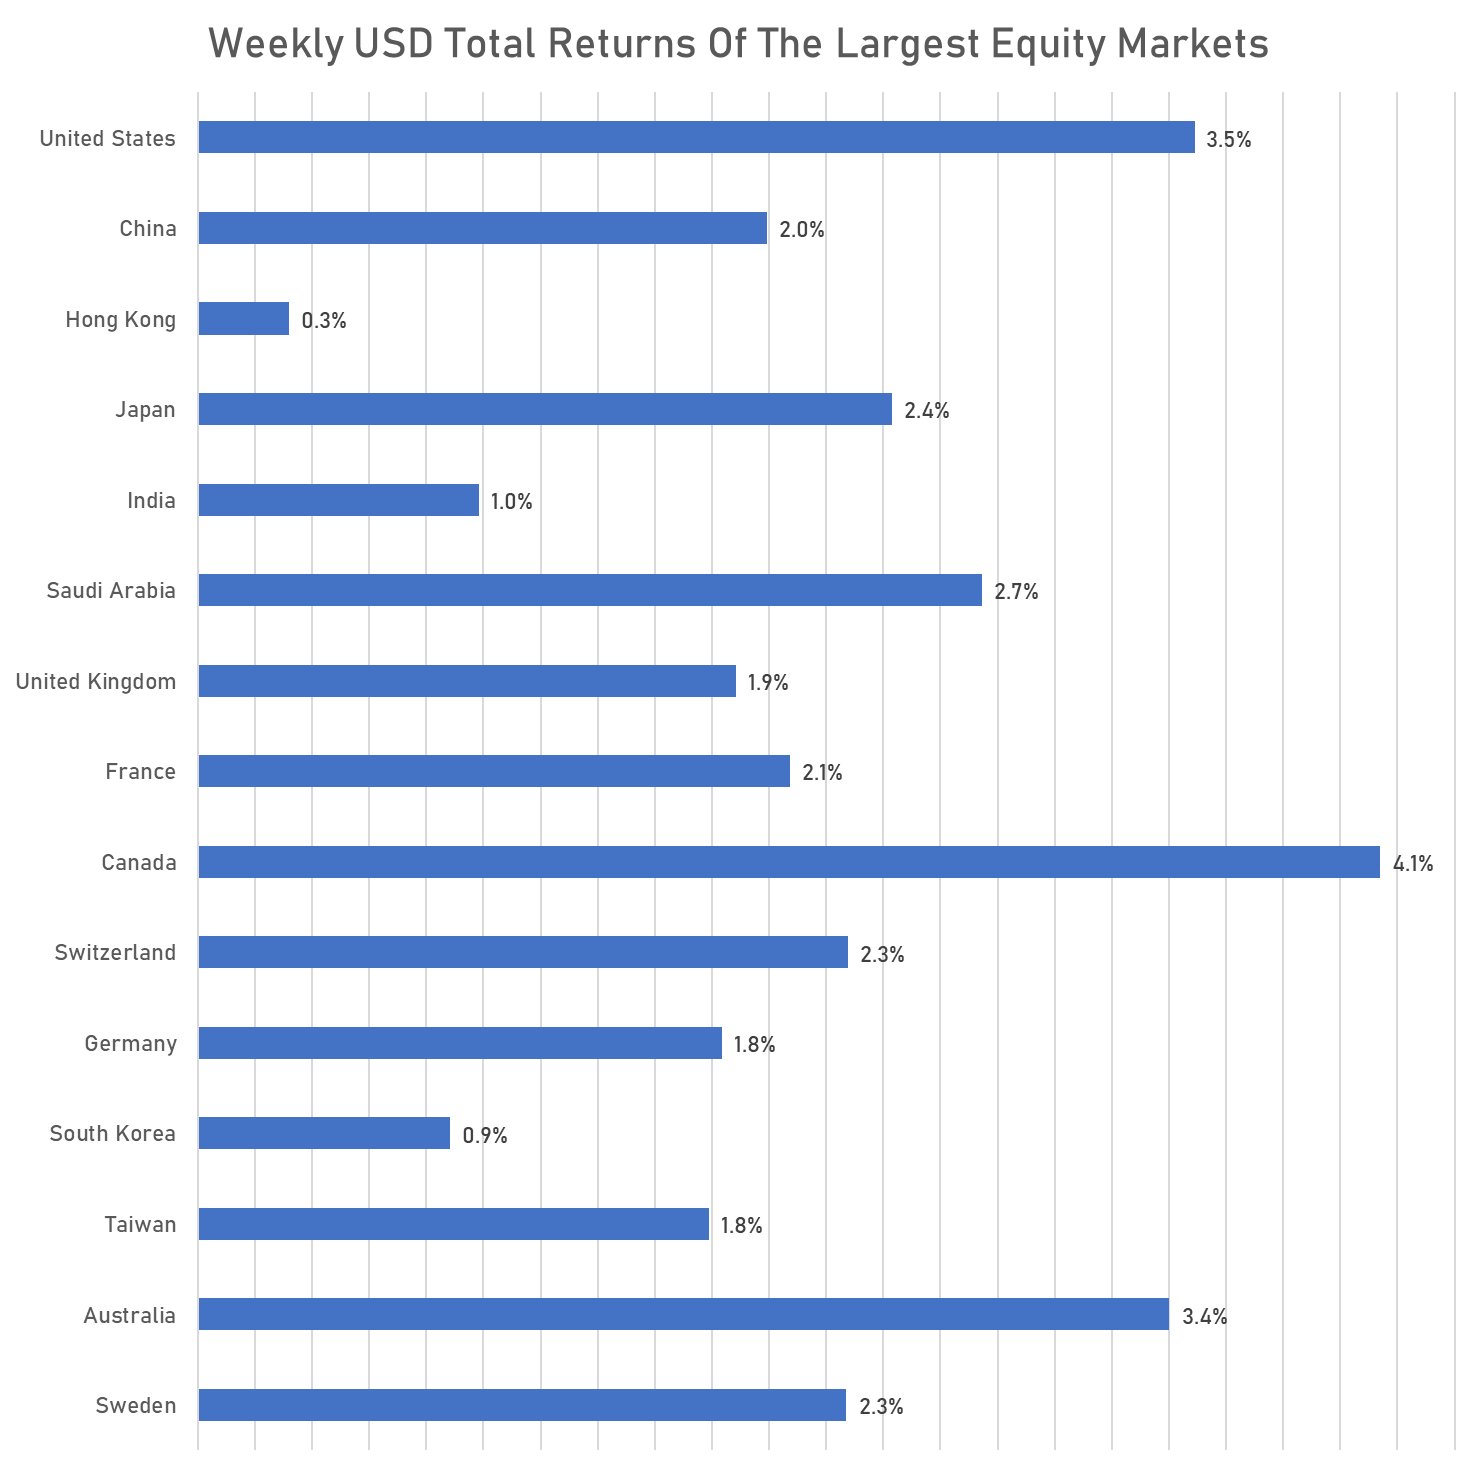
WEEKLY TOTAL RETURNS OF MAJOR GLOBAL EQUITY MARKETS
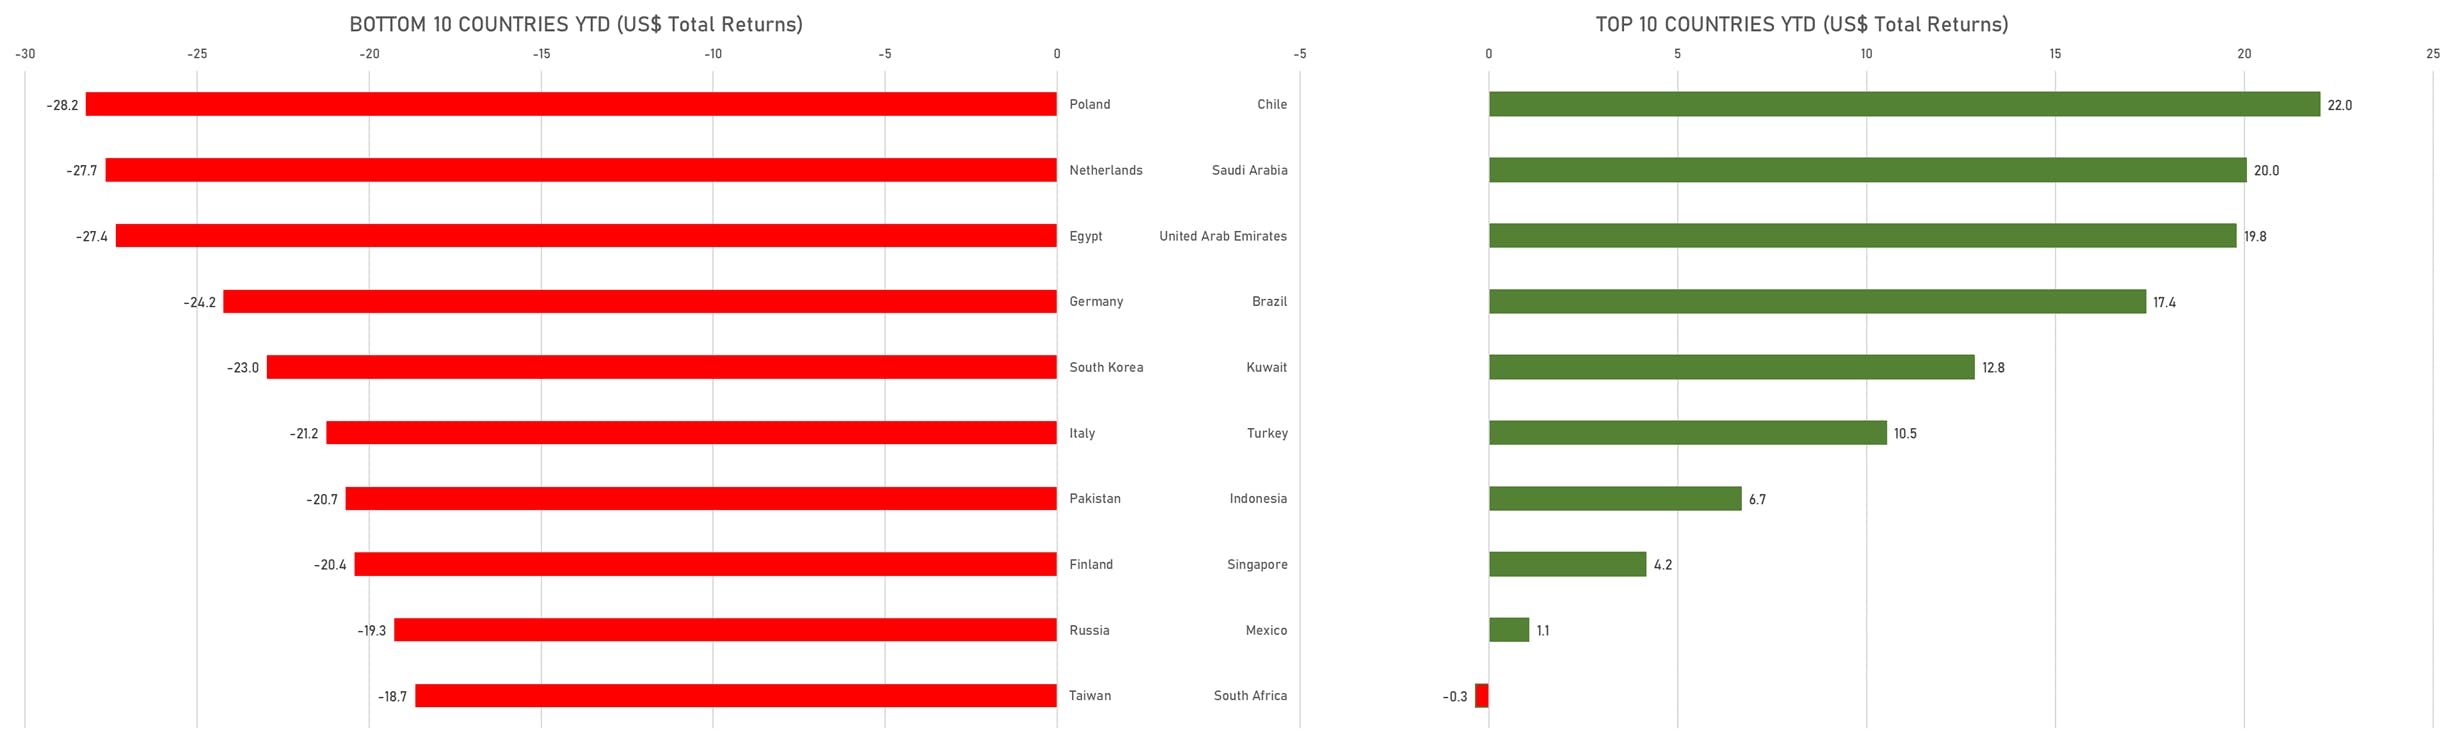
TOP / BOTTOM PERFORMING WORLD MARKETS YTD
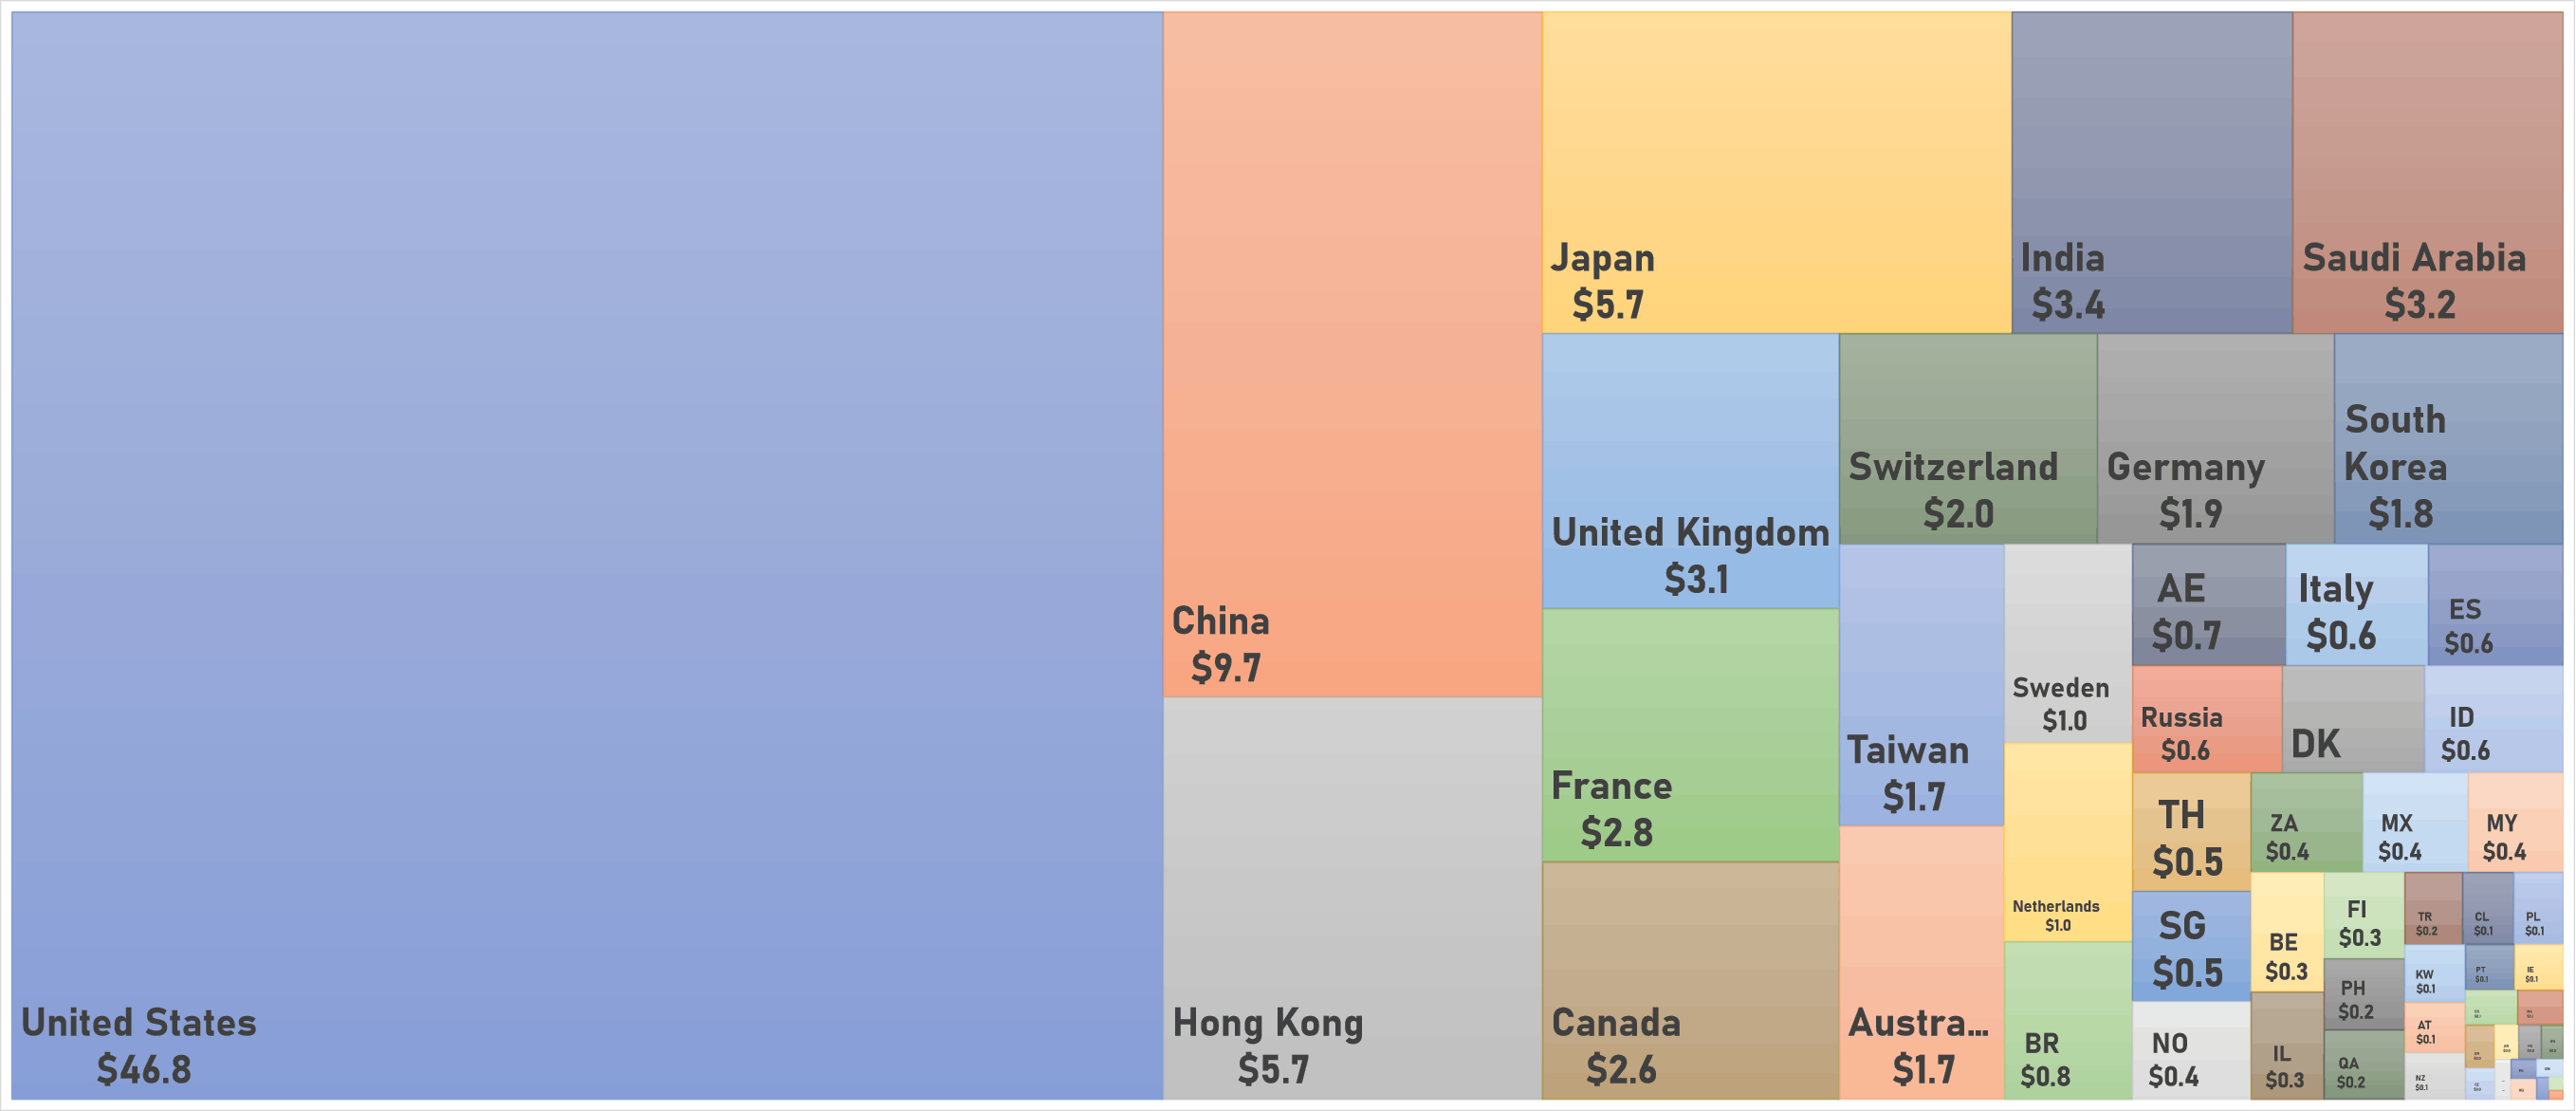
WORLD MARKET CAPITALIZATION (US$ Trillion)