Equities
Tough Weak For Global Equities, As The Perspective Of Higher Rates And Weaker Growth Starts Getting Repriced
As Peter Oppenheimer (Goldman Sachs) has pointed out recently, the split between growth and value stocks is no longer important: what matters more in the current context is identifying reasonably priced defensive positions (as opposed to cyclicals or long-duration unprofitable growth)
Published ET
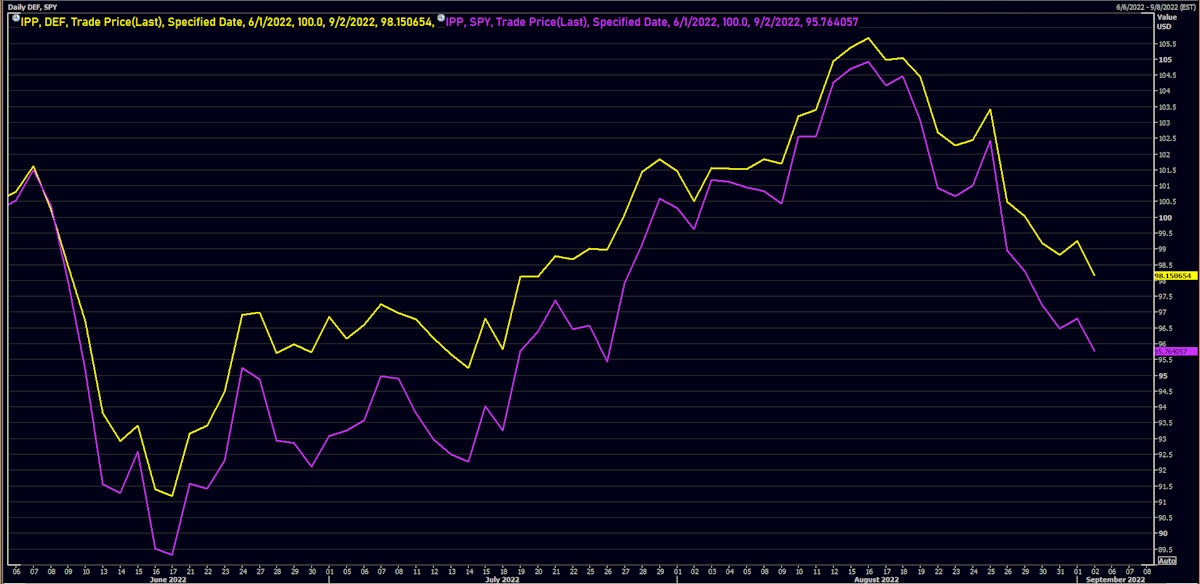
DEF vs SPY ETFs: Rebased Prices Since June 2022 | Source: Refinitiv
DAILY SUMMARY
- Daily performance of US indices: S&P 500 down -1.07%; Nasdaq Composite down -1.31%; Wilshire 5000 down -0.99%
- 16.9% of S&P 500 stocks were up today, with 25.8% of stocks above their 200-day moving average (DMA) and 34.4% above their 50-DMA
- Top performing sectors in the S&P 500: energy up 1.81% and materials down -0.09%
- Bottom performing sectors in the S&P 500: communication services down -1.85% and real estate down -1.68%
- The number of shares in the S&P 500 traded today was 581m for a total turnover of US$ 56 bn
- The S&P 500 Value Index was down -0.9%, while the S&P 500 Growth Index was down -1.3%; the S&P small caps index was down -0.7% and mid-caps were down -0.8%
- The volume on CME's INX (S&P 500 Index) was 2083.2m (3-month z-score: -0.4); the 3-month average volume is 2267.0m and the 12-month range is 1340.2 - 4692.3m
- Daily performance of international indices: Europe Stoxx 600 up 2.04%; UK FTSE 100 up 1.86%; Hang Seng SH-SZ-HK 300 Index down -0.61%; Japan's TOPIX 500 down -0.25%
VOLATILITY TODAY
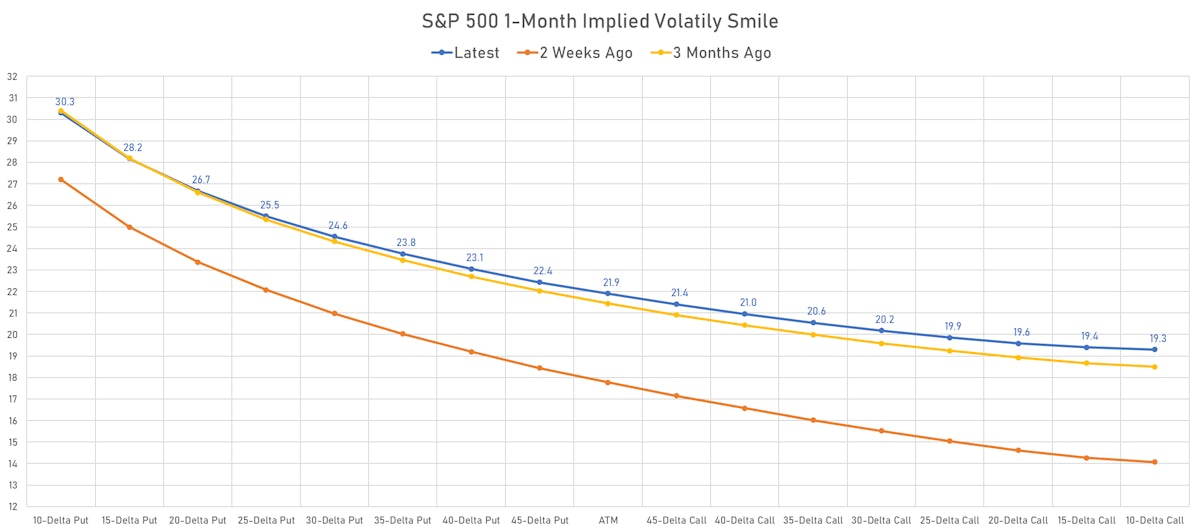
- 1-month at-the-money implied volatility on the S&P 500 at 21.9%, down from 22.0%
- 1-month at-the-money implied volatility on the Euro Stoxx 50 at 22.2%, down from 25.7%
TOP S&P 500 PERFORMERS THIS WEEK
- DXC Technology Co (DXC), up 13.2% to $27.48 / YTD price return: -14.4% / 12-Month Price Range: $ 24.00-39.65 / Short interest (% of float): 3.8%; days to cover: 5.5
- Cardinal Health Inc (CAH), up 5.0% to $70.99 / YTD price return: +37.9% / 12-Month Price Range: $ 45.86-71.55 / Short interest (% of float): 3.1%; days to cover: 3.0
- Bath & Body Works Inc (BBWI), up 4.5% to $38.47 / YTD price return: -44.9% / 12-Month Price Range: $ 25.80-82.00 / Short interest (% of float): 6.5%; days to cover: 3.2
- Ulta Beauty Inc (ULTA), up 2.8% to $423.08 / YTD price return: +2.6% / 12-Month Price Range: $ 331.07-438.50 / Short interest (% of float): 3.3%; days to cover: 2.2
- Dollar General Corp (DG), up 2.7% to $242.60 / YTD price return: +2.9% / 12-Month Price Range: $ 183.42-262.10 / Short interest (% of float): 1.9%; days to cover: 2.9
- Target Corp (TGT), up 2.5% to $164.60 / YTD price return: -28.9% / 12-Month Price Range: $ 137.23-268.97 / Short interest (% of float): 1.7%; days to cover: 2.3
- Gilead Sciences Inc (GILD), up 2.3% to $63.82 / YTD price return: -12.1% / 12-Month Price Range: $ 57.17-74.10 / Short interest (% of float): 1.4%; days to cover: 2.7
- AES Corp (AES), up 2.0% to $26.15 / YTD price return: +7.6% / 12-Month Price Range: $ 18.62-26.52 / Short interest (% of float): 1.4%; days to cover: 1.9
- Marketaxess Holdings Inc (MKTX), up 2.0% to $249.91 / YTD price return: -39.2% / 12-Month Price Range: $ 239.54-484.37 / Short interest (% of float): 1.9%; days to cover: 2.2
- Mckesson Corp (MCK), up 2.0% to $363.82 / YTD price return: +46.4% / 12-Month Price Range: $ 193.89-375.22 / Short interest (% of float): 1.9%; days to cover: 2.8
BOTTOM S&P 500 PERFORMERS THIS WEEK
- NVIDIA Corp (NVDA), down 16.1% to $136.47 / YTD price return: -53.6% / 12-Month Price Range: $ 132.71-346.10 / Short interest (% of float): 1.3%; days to cover: 0.6
- PVH Corp (PVH), down 14.8% to $54.58 / YTD price return: -48.8% / 12-Month Price Range: $ 53.28-125.26 / Short interest (% of float): 3.1%; days to cover: 1.9
- Seagate Technology Holdings PLC (STX), down 12.3% to $65.47 / YTD price return: -42.1% / 12-Month Price Range: $ 63.51-117.63 / Short interest (% of float): 5.9%; days to cover: 6.1
- Catalent Inc (CTLT), down 12.2% to $87.58 / YTD price return: -31.6% / 12-Month Price Range: $ 86.28-142.46 / Short interest (% of float): 1.6%; days to cover: 2.8
- Freeport-McMoRan Inc (FCX), down 12.1% to $28.30 / YTD price return: -32.2% / 12-Month Price Range: $ 24.81-51.99 / Short interest (% of float): 1.9%; days to cover: 1.3
- Advanced Micro Devices Inc (AMD), down 12.0% to $80.24 / YTD price return: -44.2% / 12-Month Price Range: $ 71.61-164.44 / Short interest (% of float): 2.2%; days to cover: 0.4
- HP Inc (HPQ), down 11.9% to $27.64 / YTD price return: -26.6% / 12-Month Price Range: $ 26.11-41.46 / Short interest (% of float): 4.8%; days to cover: 7.0
- Mosaic Co (MOS), down 11.2% to $54.84 / YTD price return: +39.6% / 12-Month Price Range: $ 30.58-79.25 / Short interest (% of float): 2.5%; days to cover: 1.7
- Monolithic Power Systems Inc (MPWR), down 11.0% to $424.42 / YTD price return: -14.0% / 12-Month Price Range: $ 348.73-579.19 / Short interest (% of float): 2.5%; days to cover: 2.3
- Newell Brands Inc (NWL), down 10.4% to $17.52 / YTD price return: -19.8% / 12-Month Price Range: $ 17.14-26.45 / Short interest (% of float): 4.5%; days to cover: 7.1
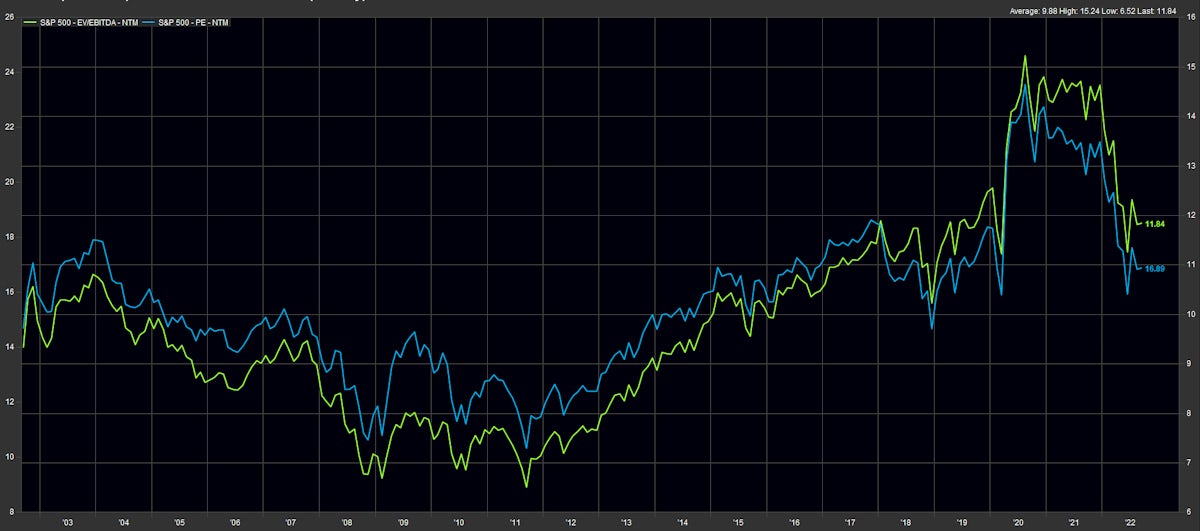
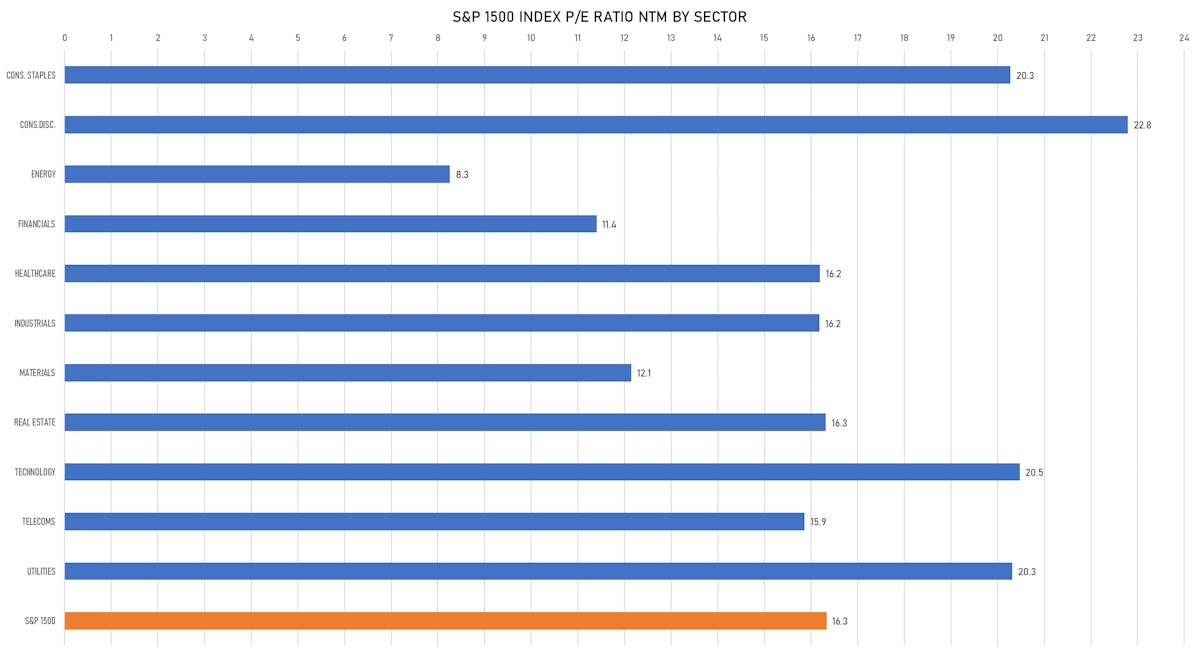
VALUATION MULTIPLES BY SECTORS
WEEKLY TOTAL RETURNS OF MAJOR GLOBAL EQUITY MARKETS
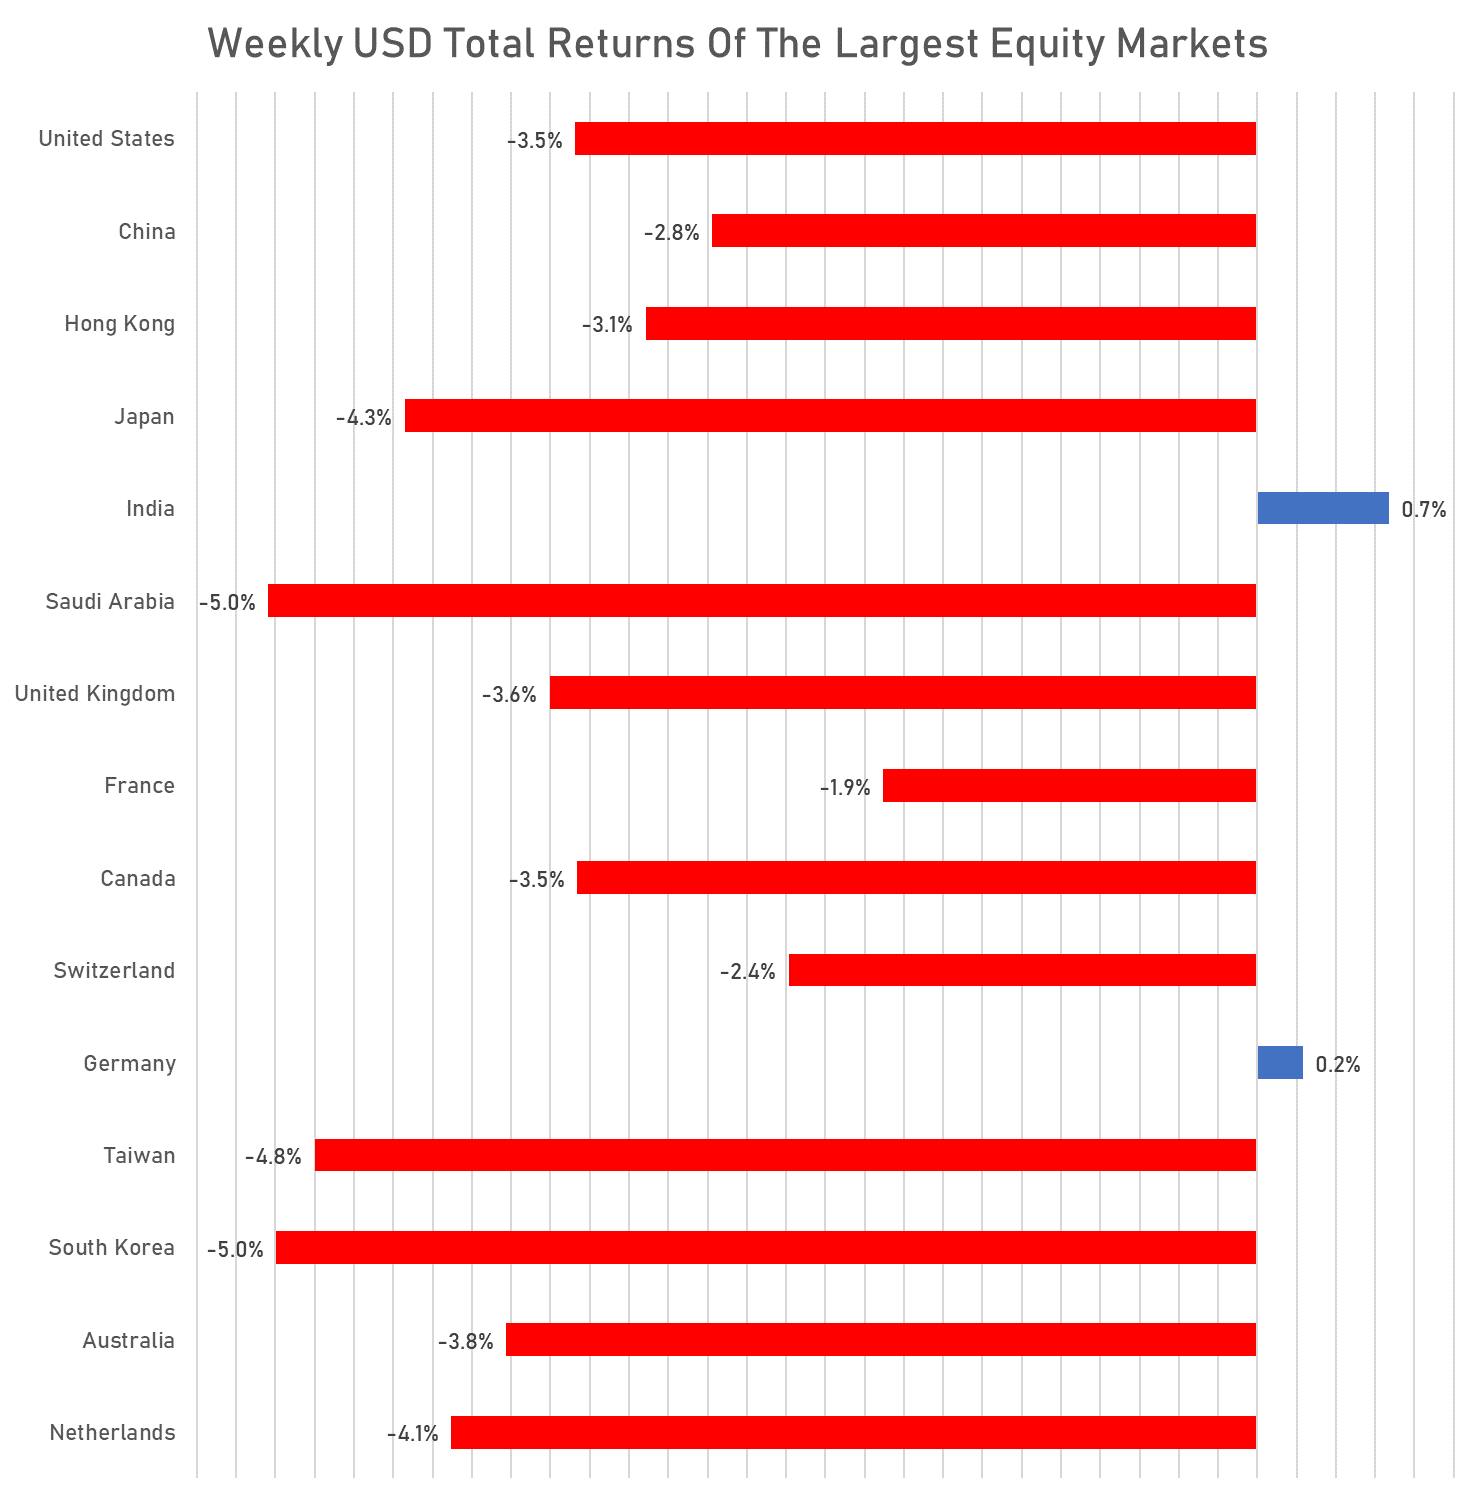
TOP / BOTTOM PERFORMING WORLD MARKETS YTD

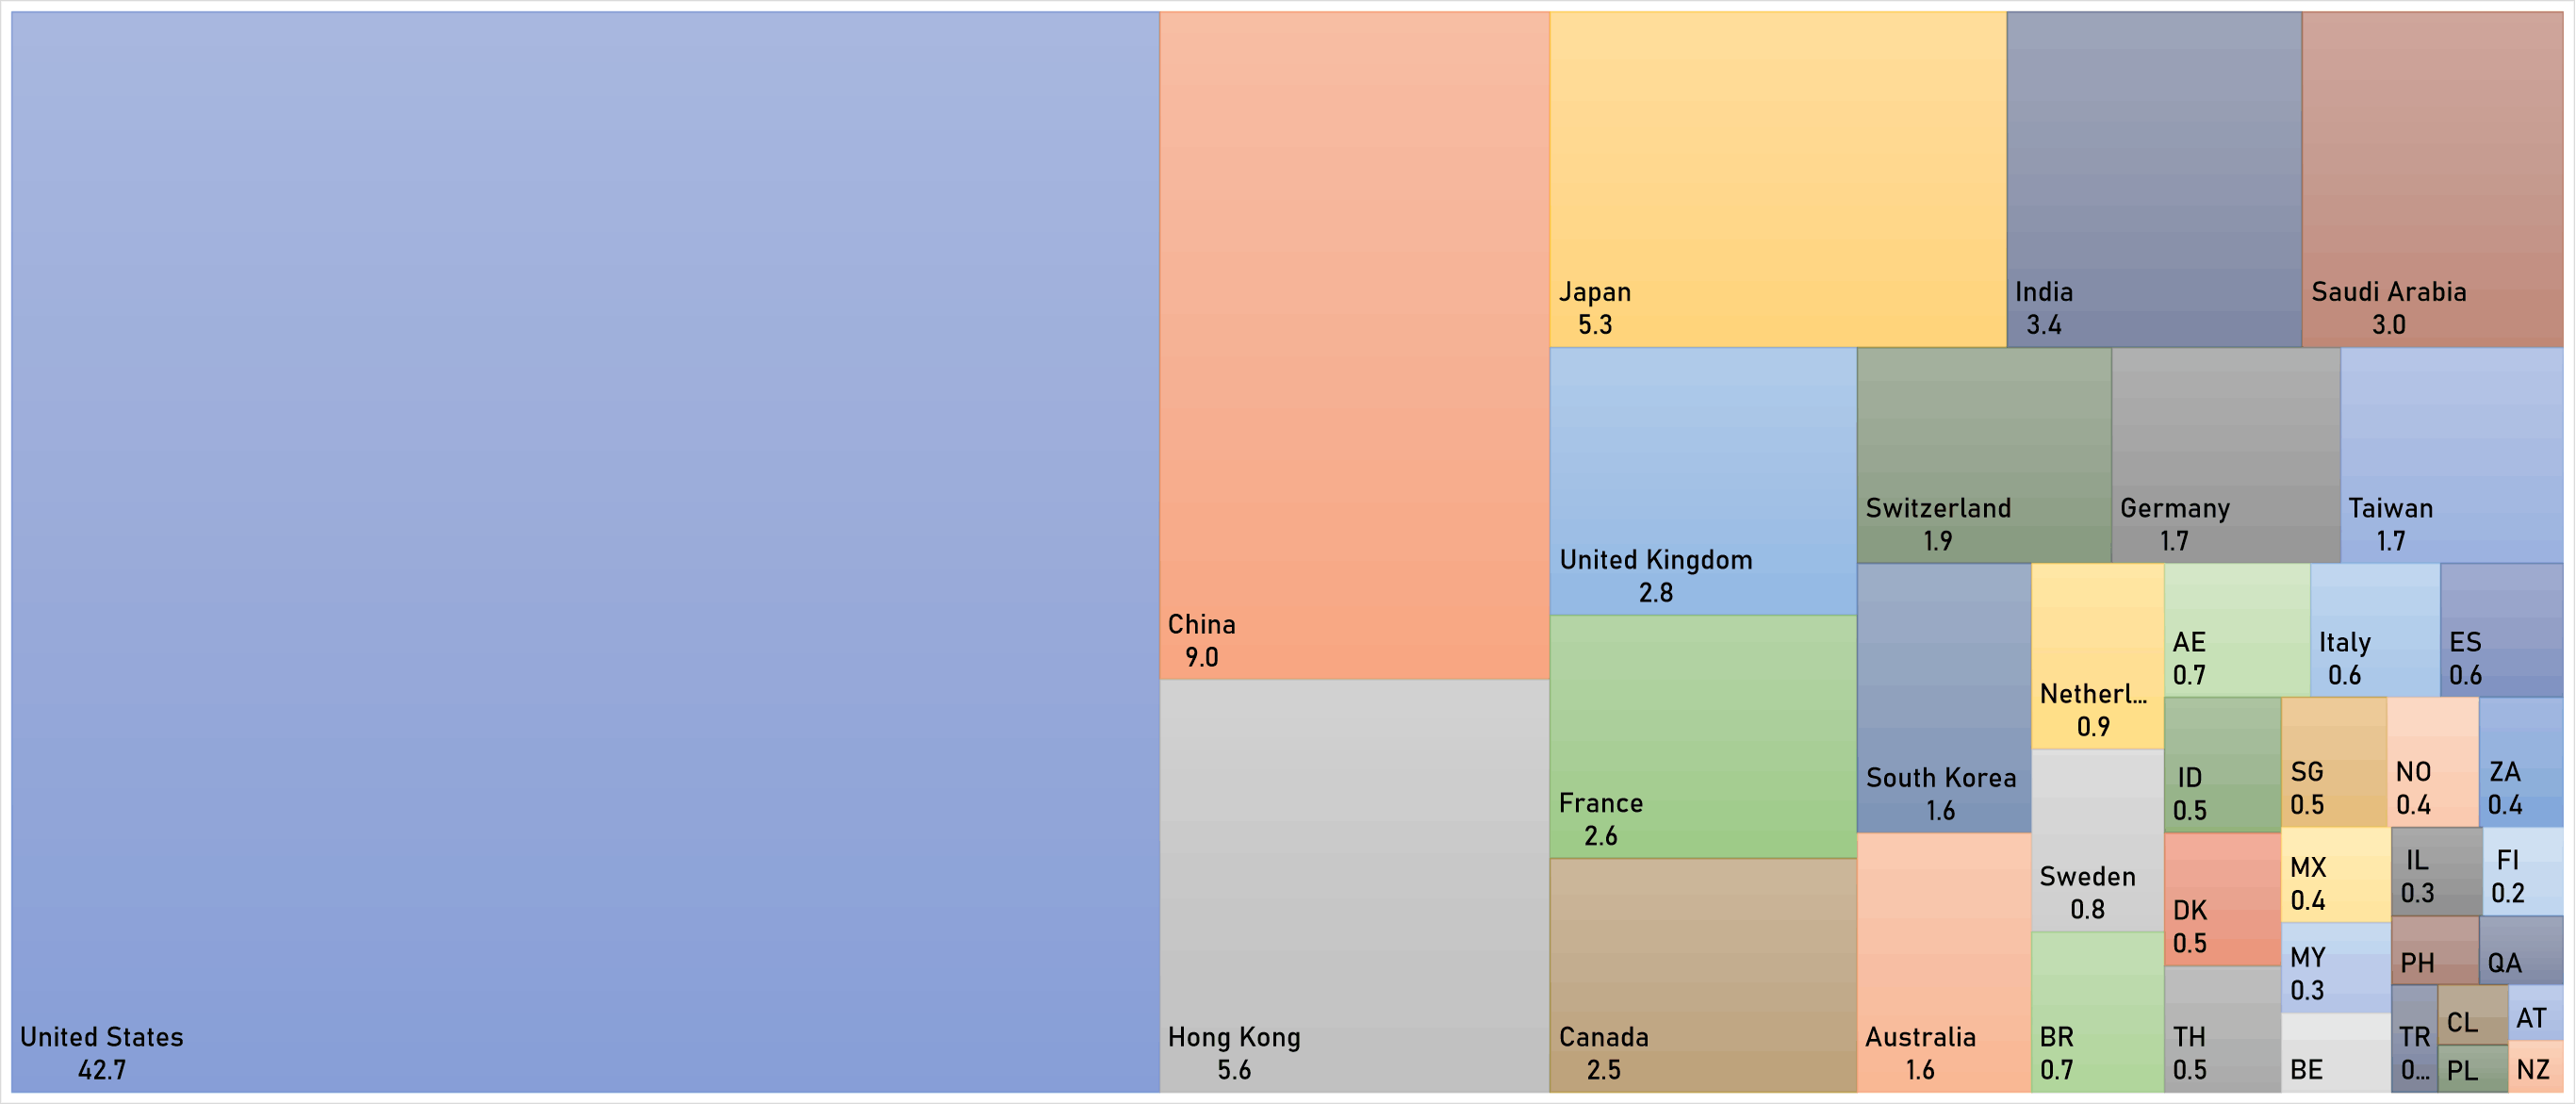
WORLD MARKET CAPITALIZATION (US$ Trillion)
