Equities
Broad Rebound In Global Equities From Oversold Levels, Helped By Lower Rates Volatility
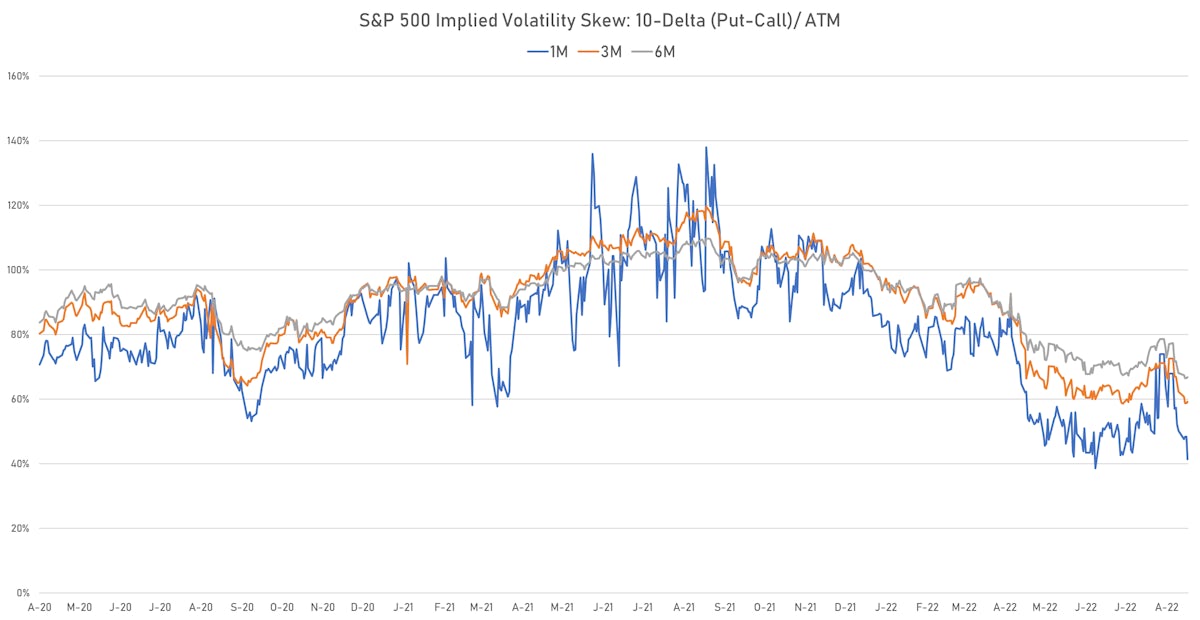
Considering the current level of the US equity risk premium, and the stretched implied volatility skew on 1-month S&P 500 options, we doubt this technical move higher will prove durable
Published ET
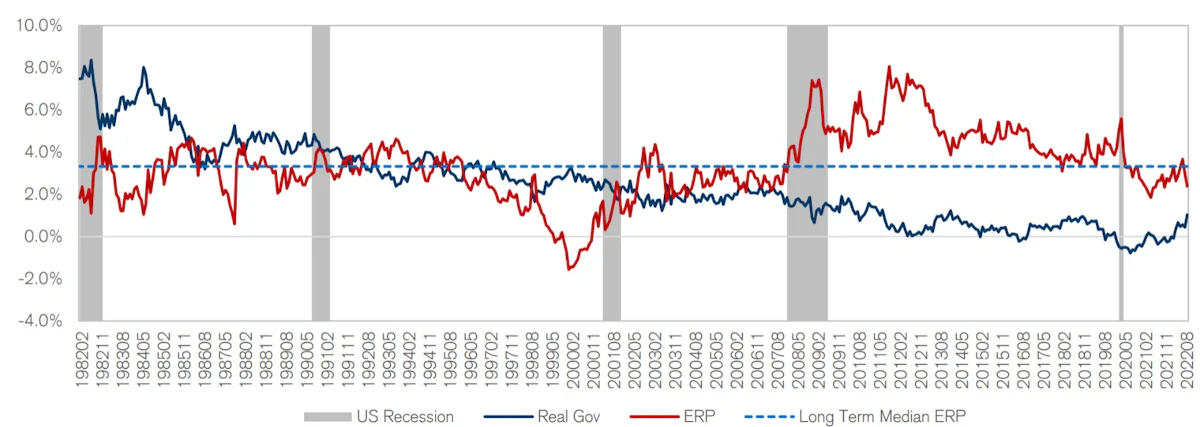
US Equity Risk Premium | Source: Credit Suisse
DAILY SUMMARY
- Daily performance of US indices: S&P 500 up 1.53%; Nasdaq Composite up 2.11%; Wilshire 5000 up 1.66%
- 89.9% of S&P 500 stocks were up today, with 36.8% of stocks above their 200-day moving average (DMA) and 64.0% above their 50-DMA
- Top performing sectors in the S&P 500: communication services up 2.53% and energy up 2.38%
- Bottom performing sectors in the S&P 500: utilities up 0.42% and healthcare up 0.83%
- The number of shares in the S&P 500 traded today was 576m for a total turnover of US$ 57 bn
- The S&P 500 Value Index was up 1.2%, while the S&P 500 Growth Index was up 1.9%; the S&P small caps index was up 1.9% and mid-caps were up 1.8%
- The volume on CME's INX (S&P 500 Index) was 2,097.3m (3-month z-score: -0.4); the 3-month average volume is 2,285.7m and the 12-month range is 1,340.2 - 4,692.3m
- Daily performance of international indices: Europe Stoxx 600 up 1.52%; UK FTSE 100 up 1.23%; Hang Seng SH-SZ-HK 300 Index up 1.69%; Japan's TOPIX 500 up 0.37%
VOLATILITY TODAY
- 1-month at-the-money implied volatility on the S&P 500 at 20.7%, down from 23.5%
- 1-month at-the-money implied volatility on the Euro Stoxx 50 at 21.9%, down from 22.8%
TOP S&P 500 PERFORMERS THIS WEEK
- Regeneron Pharmaceuticals Inc (REGN), up 24.7% to $724.32 / YTD price return: +14.7% / 12-Month Price Range: $ 538.27-747.19
- Solaredge Technologies Inc (SEDG), up 17.2% to $313.00 / YTD price return: +11.6% / 12-Month Price Range: $ 200.95-389.00 / Short interest (% of float): 3.4%; days to cover: 1.6
- Albemarle Corp (ALB), up 15.6% to $300.37 / YTD price return: +28.5% / 12-Month Price Range: $ 169.95-300.37
- Royal Caribbean Cruises Ltd (RCL), up 15.2% to $47.24 / YTD price return: -38.6% / 12-Month Price Range: $ 31.09-98.21
- Freeport-McMoRan Inc (FCX), up 13.7% to $32.17 / YTD price return: -22.9% / 12-Month Price Range: $ 24.81-51.99 / Short interest (% of float): 1.9%; days to cover: 1.3
- DISH Network Corp (DISH), up 13.6% to $19.33 / YTD price return: -40.4% / 12-Month Price Range: $ 16.21-46.30
- Caesars Entertainment Inc (CZR), up 13.5% to $48.33 / YTD price return: -48.3% / 12-Month Price Range: $ 35.10-119.79 / Short interest (% of float): 5.9%; days to cover: 3.5
- Dexcom Inc (DXCM), up 13.3% to $92.89 / YTD price return: -30.8% / 12-Month Price Range: $ 66.94-164.63 / Short interest (% of float): 3.4%; days to cover: 4.8
- Stryker Corp (SYK), up 12.9% to $230.00 / YTD price return: -14.0% / 12-Month Price Range: $ 188.89-281.12
- Match Group Inc (MTCH), up 12.8% to $62.25 / YTD price return: -52.9% / 12-Month Price Range: $ 53.22-181.99
BOTTOM S&P 500 PERFORMERS THIS WEEK
- Occidental Petroleum Corp (OXY), down 4.6% to $65.61 / YTD price return: +126.3% / 12-Month Price Range: $ 24.39-77.11
- McCormick & Company Inc (MKC), down 3.8% to $79.89 / YTD price return: -17.3% / 12-Month Price Range: $ 77.68-107.34
- Church & Dwight Co Inc (CHD), down 3.1% to $81.56 / YTD price return: -20.4% / 12-Month Price Range: $ 79.37-105.28
- CF Industries Holdings Inc (CF), down 3.0% to $103.68 / YTD price return: +46.5% / 12-Month Price Range: $ 44.06-119.57 / Short interest (% of float): 2.8%; days to cover: 2.4
- Williams Companies Inc (WMB), down 2.8% to $32.77 / YTD price return: +25.8% / 12-Month Price Range: $ 23.99-37.96
- DXC Technology Co (DXC), down 2.6% to $26.76 / YTD price return: -16.9% / 12-Month Price Range: $ 24.00-39.65 / Short interest (% of float): 3.8%; days to cover: 5.5
- Devon Energy Corp (DVN), down 2.6% to $68.51 / YTD price return: +55.5% / 12-Month Price Range: $ 27.41-79.40 / Short interest (% of float): 2.6%; days to cover: 1.5
- Campbell Soup Co (CPB), down 2.4% to $47.93 / YTD price return: +10.3% / 12-Month Price Range: $ 39.77-51.94
- Kraft Heinz Co (KHC), down 2.3% to $36.46 / YTD price return: +1.6% / 12-Month Price Range: $ 32.79-44.87 / Short interest (% of float): 1.8%; days to cover: 2.0
- APA Corp (US) (APA), down 1.8% to $38.09 / YTD price return: +41.7% / 12-Month Price Range: $ 18.53-51.95
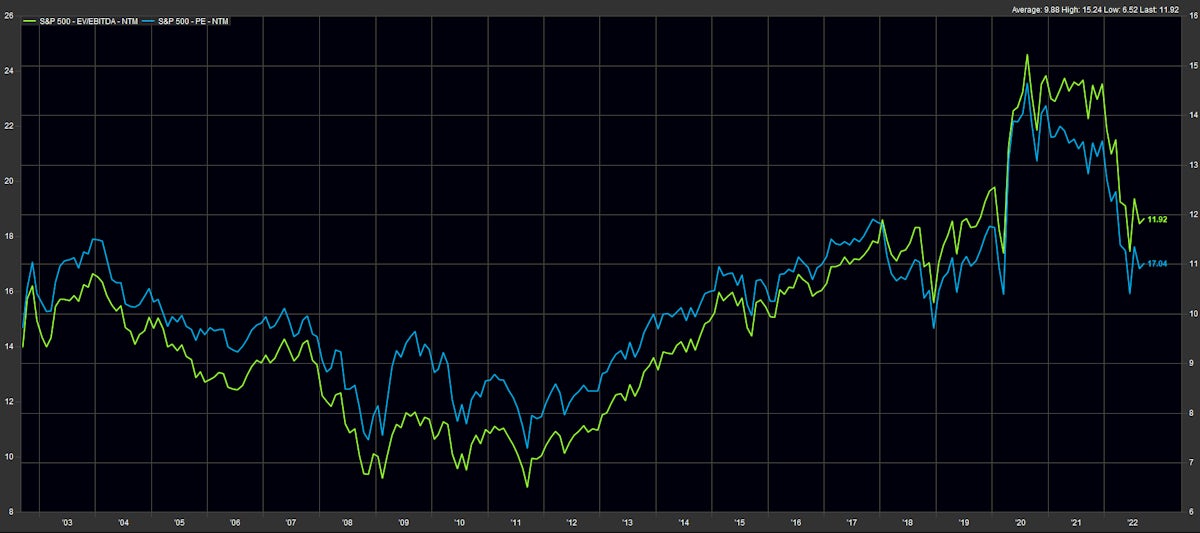
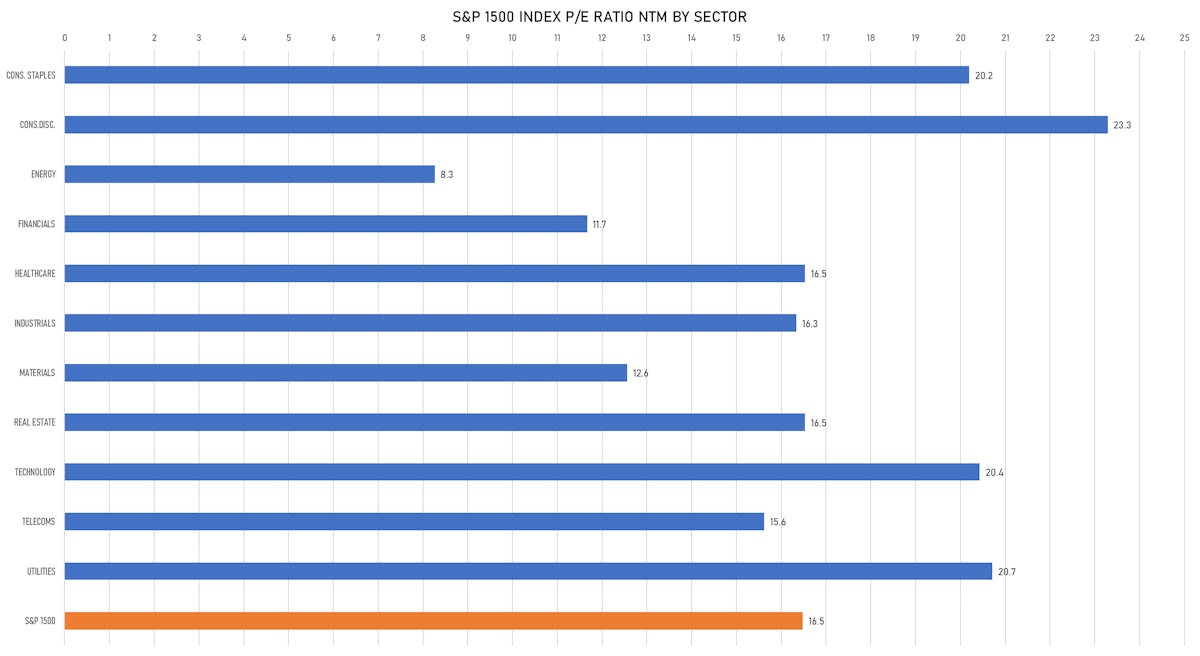
VALUATION MULTIPLES BY SECTORS
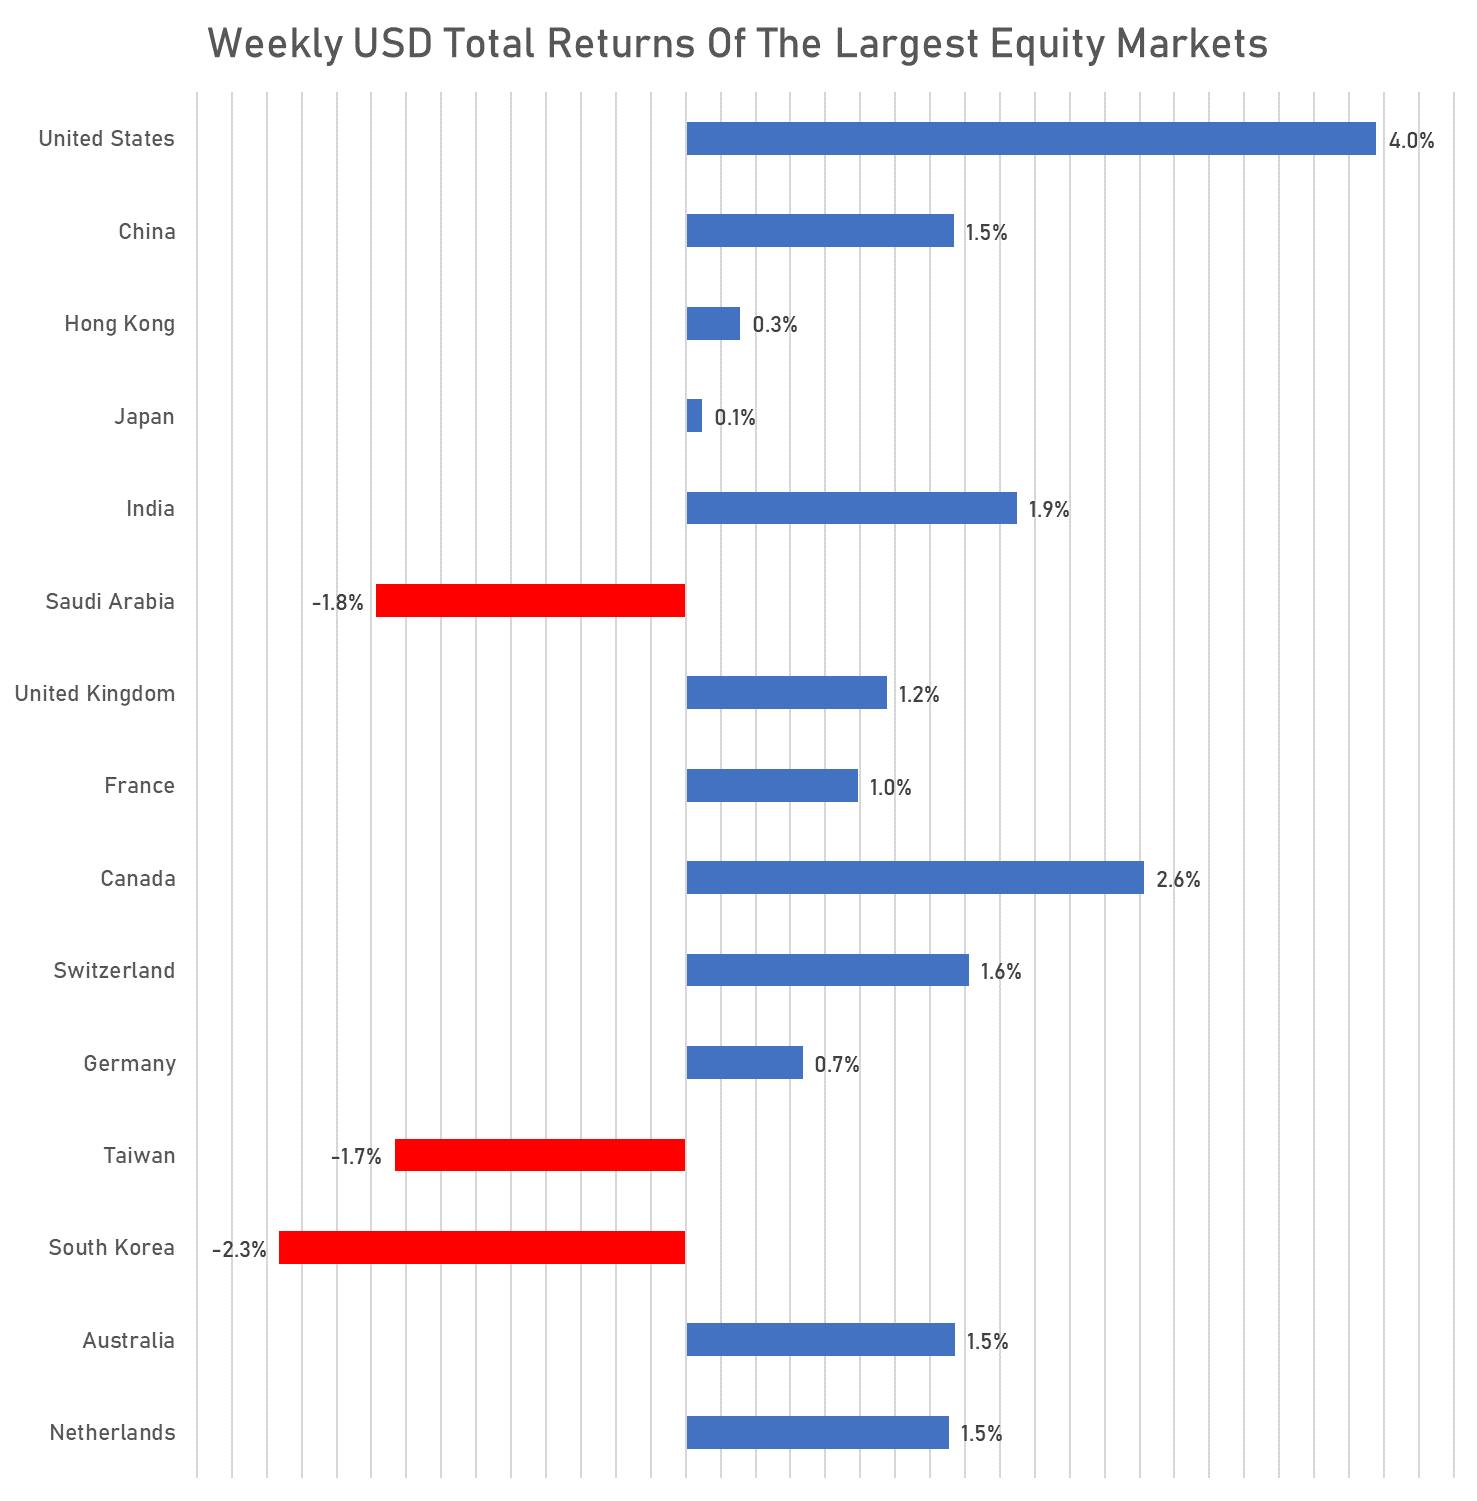
WEEKLY TOTAL RETURNS OF MAJOR GLOBAL EQUITY MARKETS
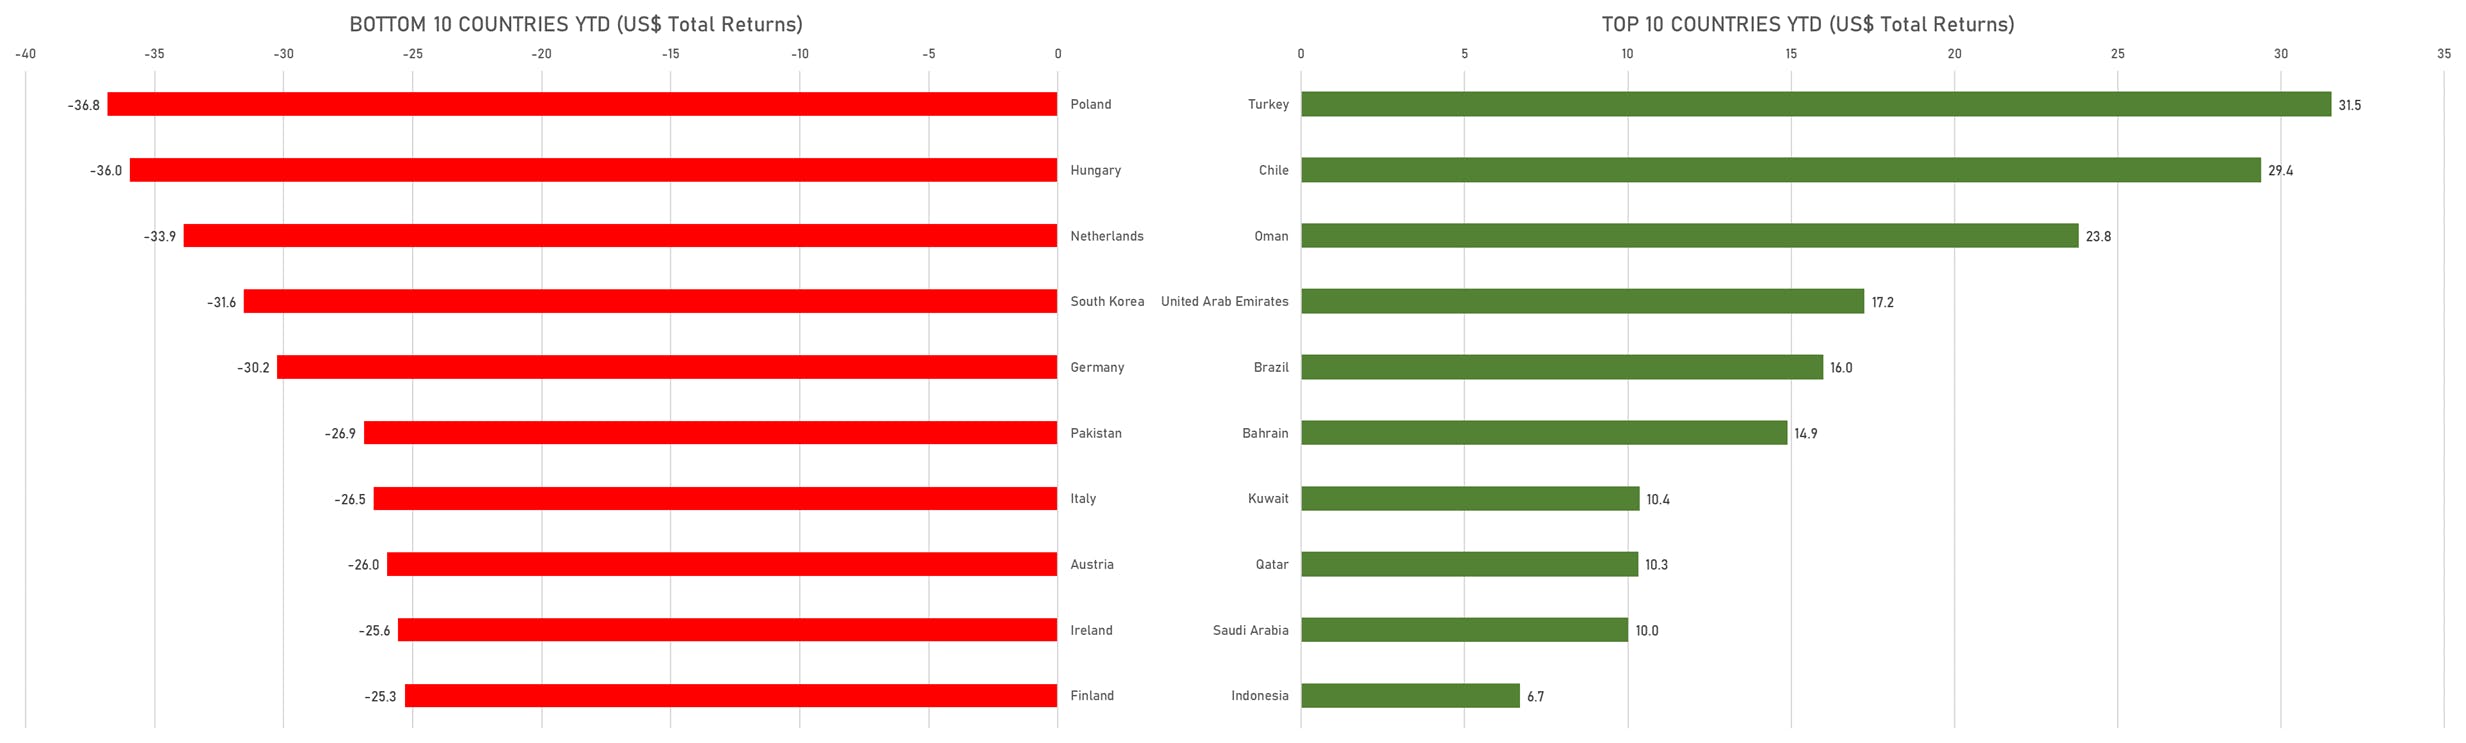
TOP / BOTTOM PERFORMING WORLD MARKETS YTD
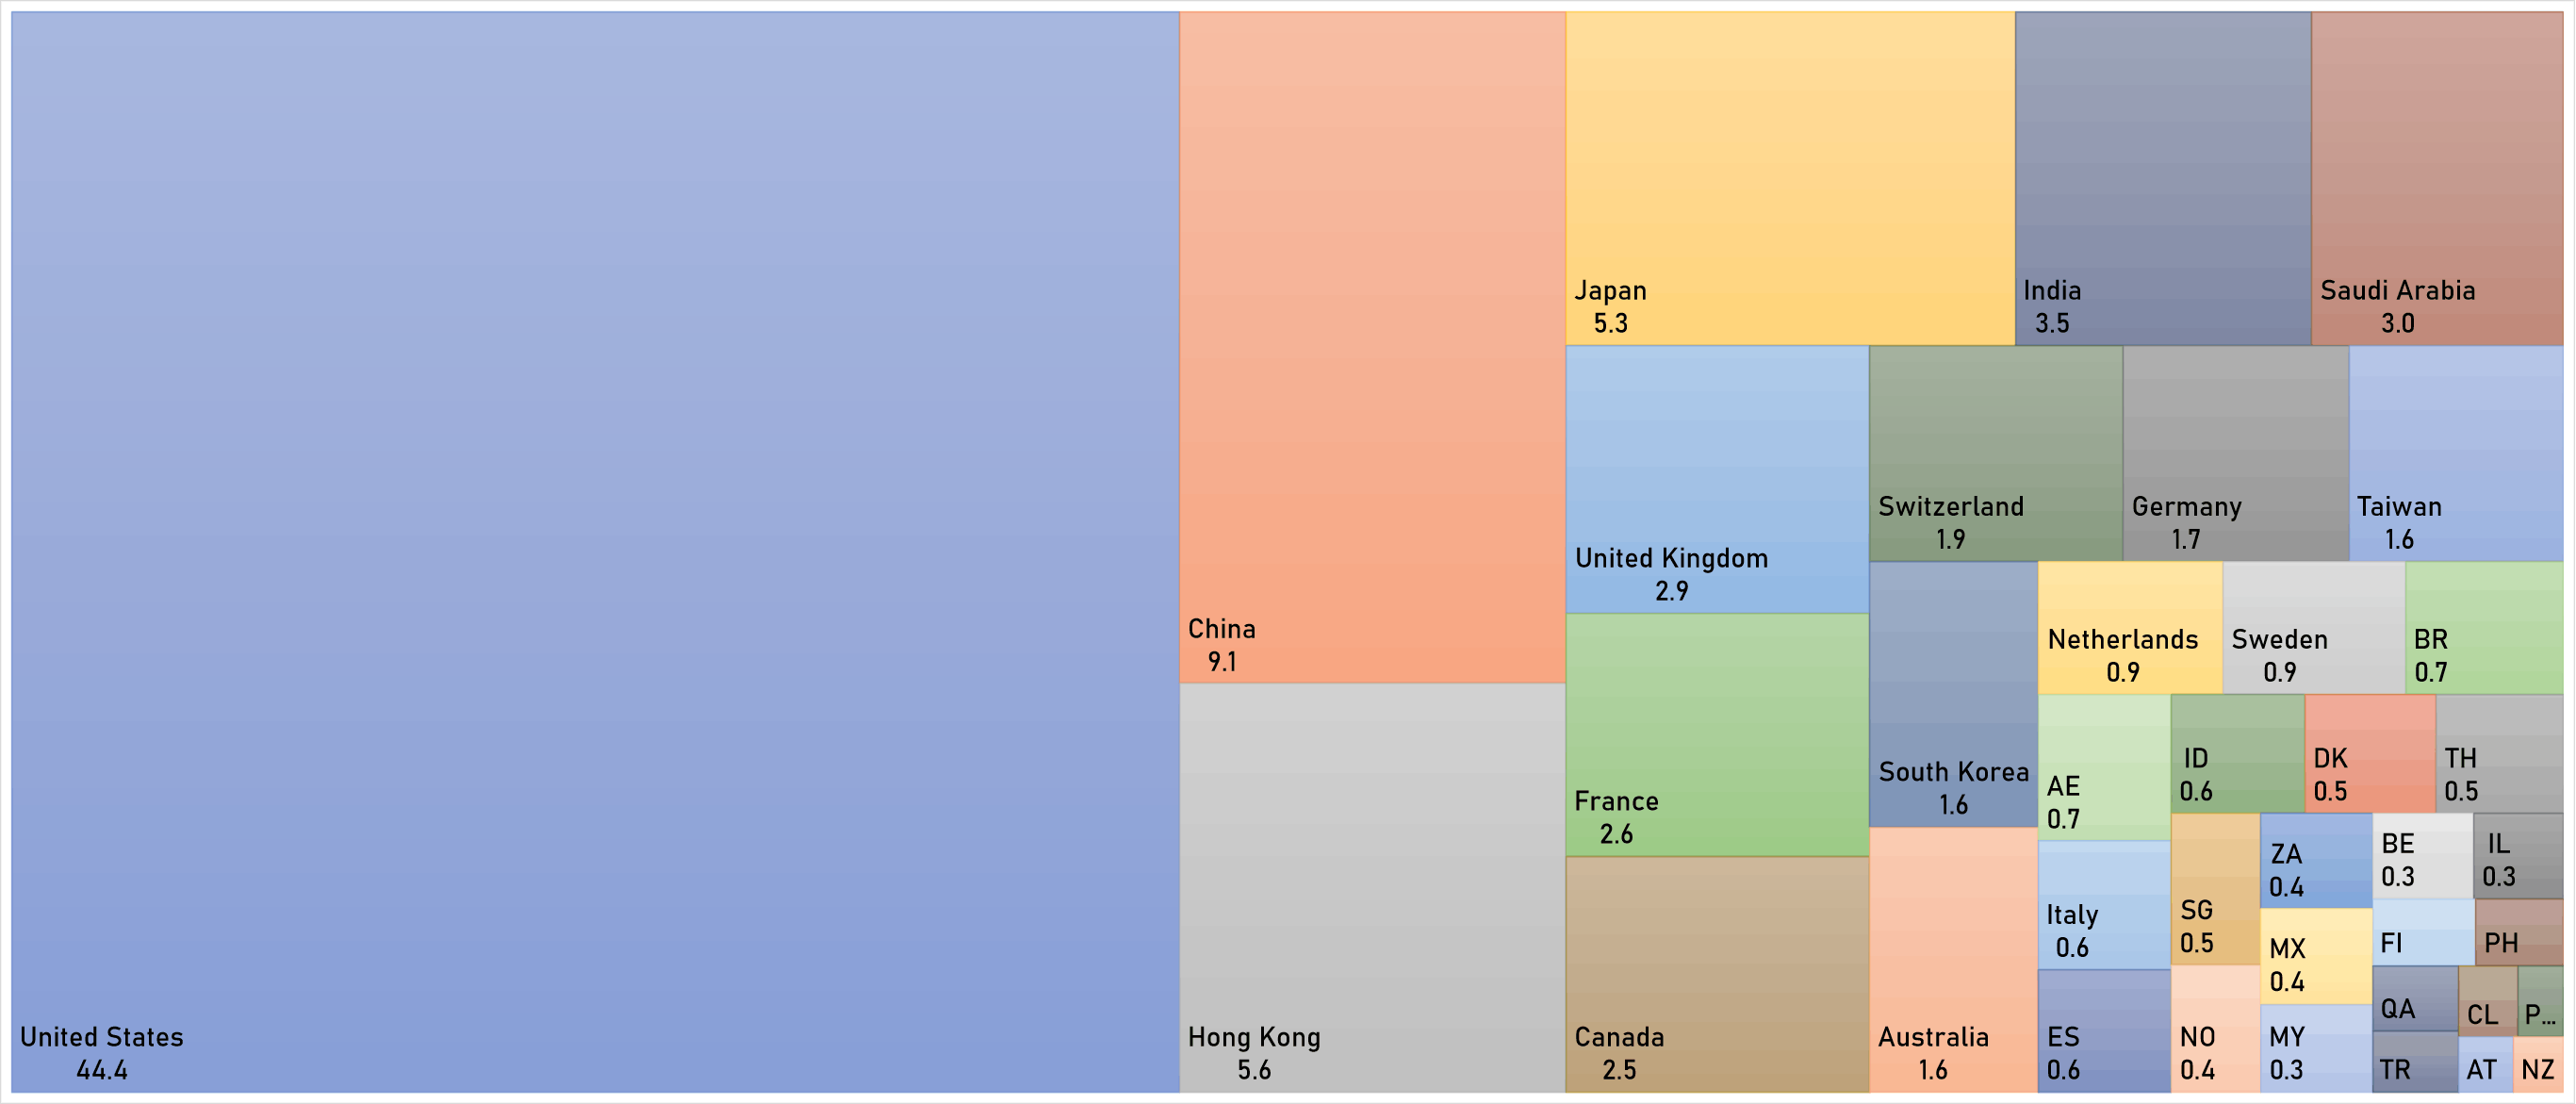
WORLD MARKET CAPITALIZATION (US$ Trillion)