Equities
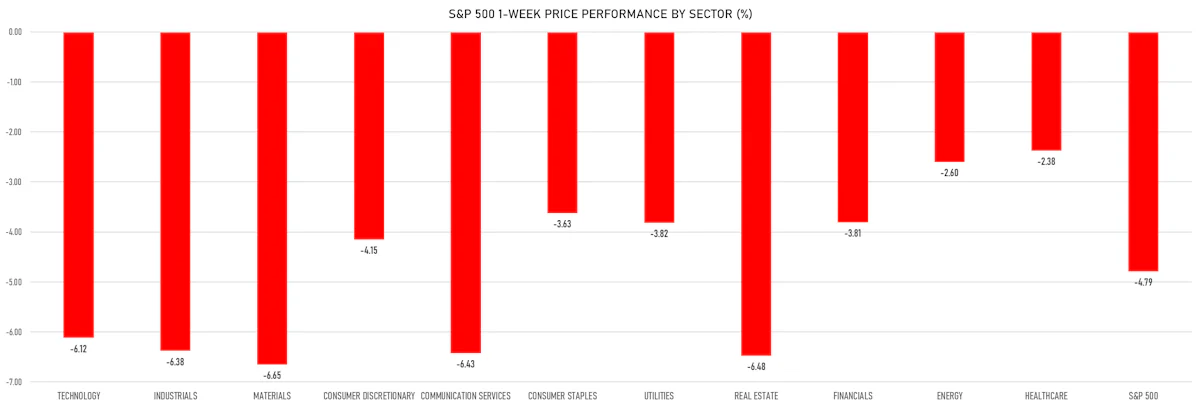
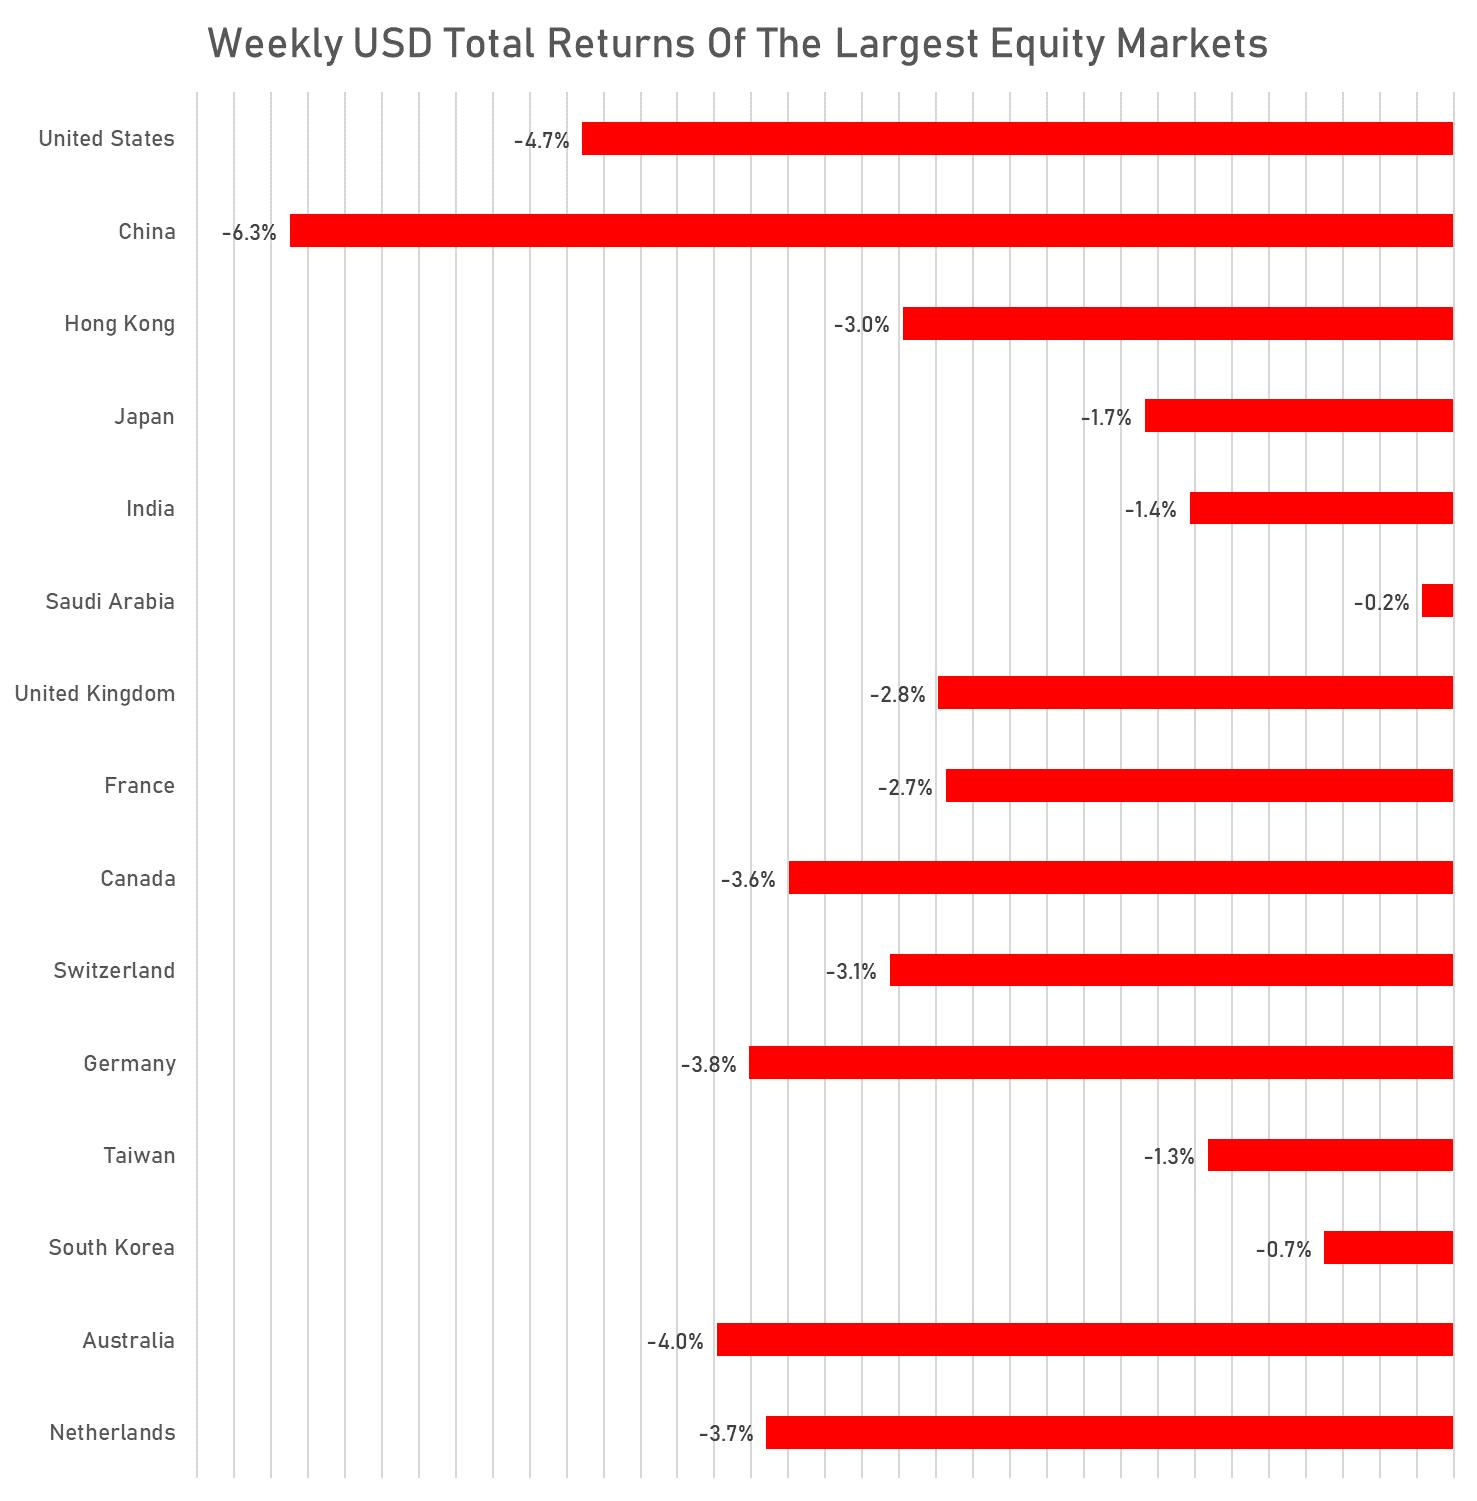
Ugly Week For Equities, With All Major Global Indices Falling: S&P 500 Down 4.8%, Nasdaq Composite Down 5.5%
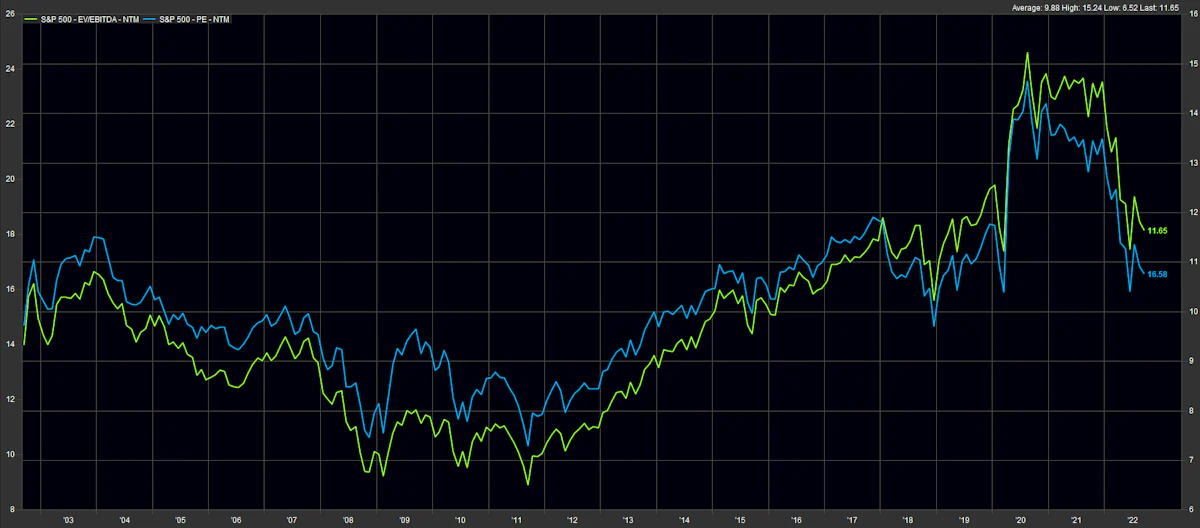
As mentioned last week, we continue to expect equities to make new cycle lows: with US core inflation still rising, the rates complex is repricing the path of Fed Funds higher, which will inevitably lead valuation multiples lower
Published ET
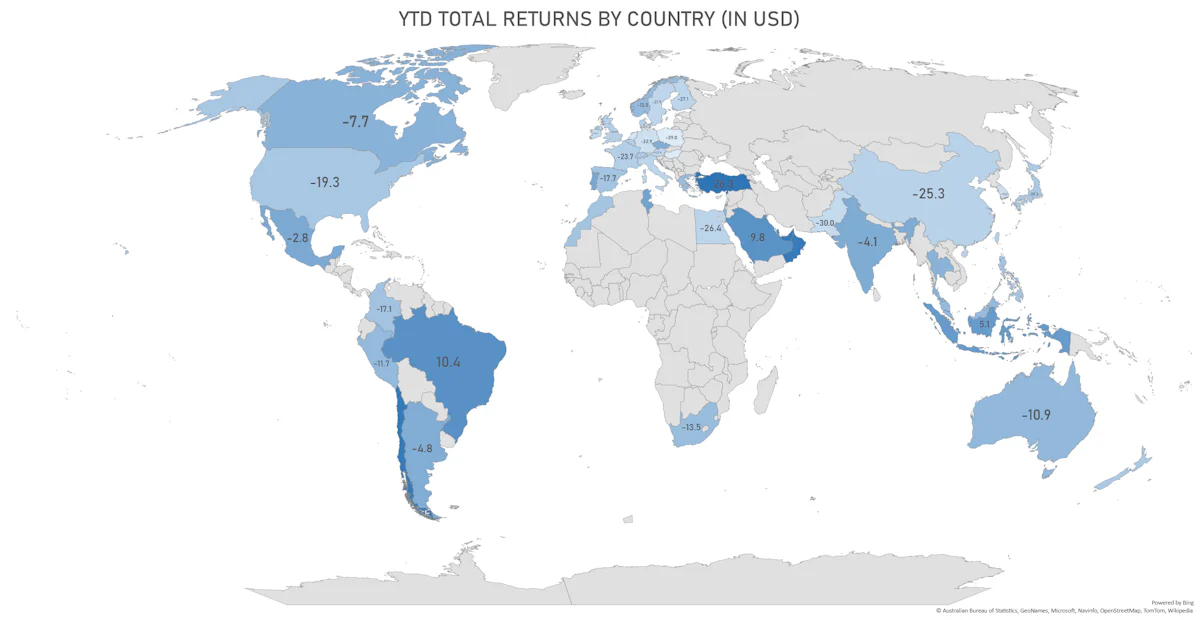
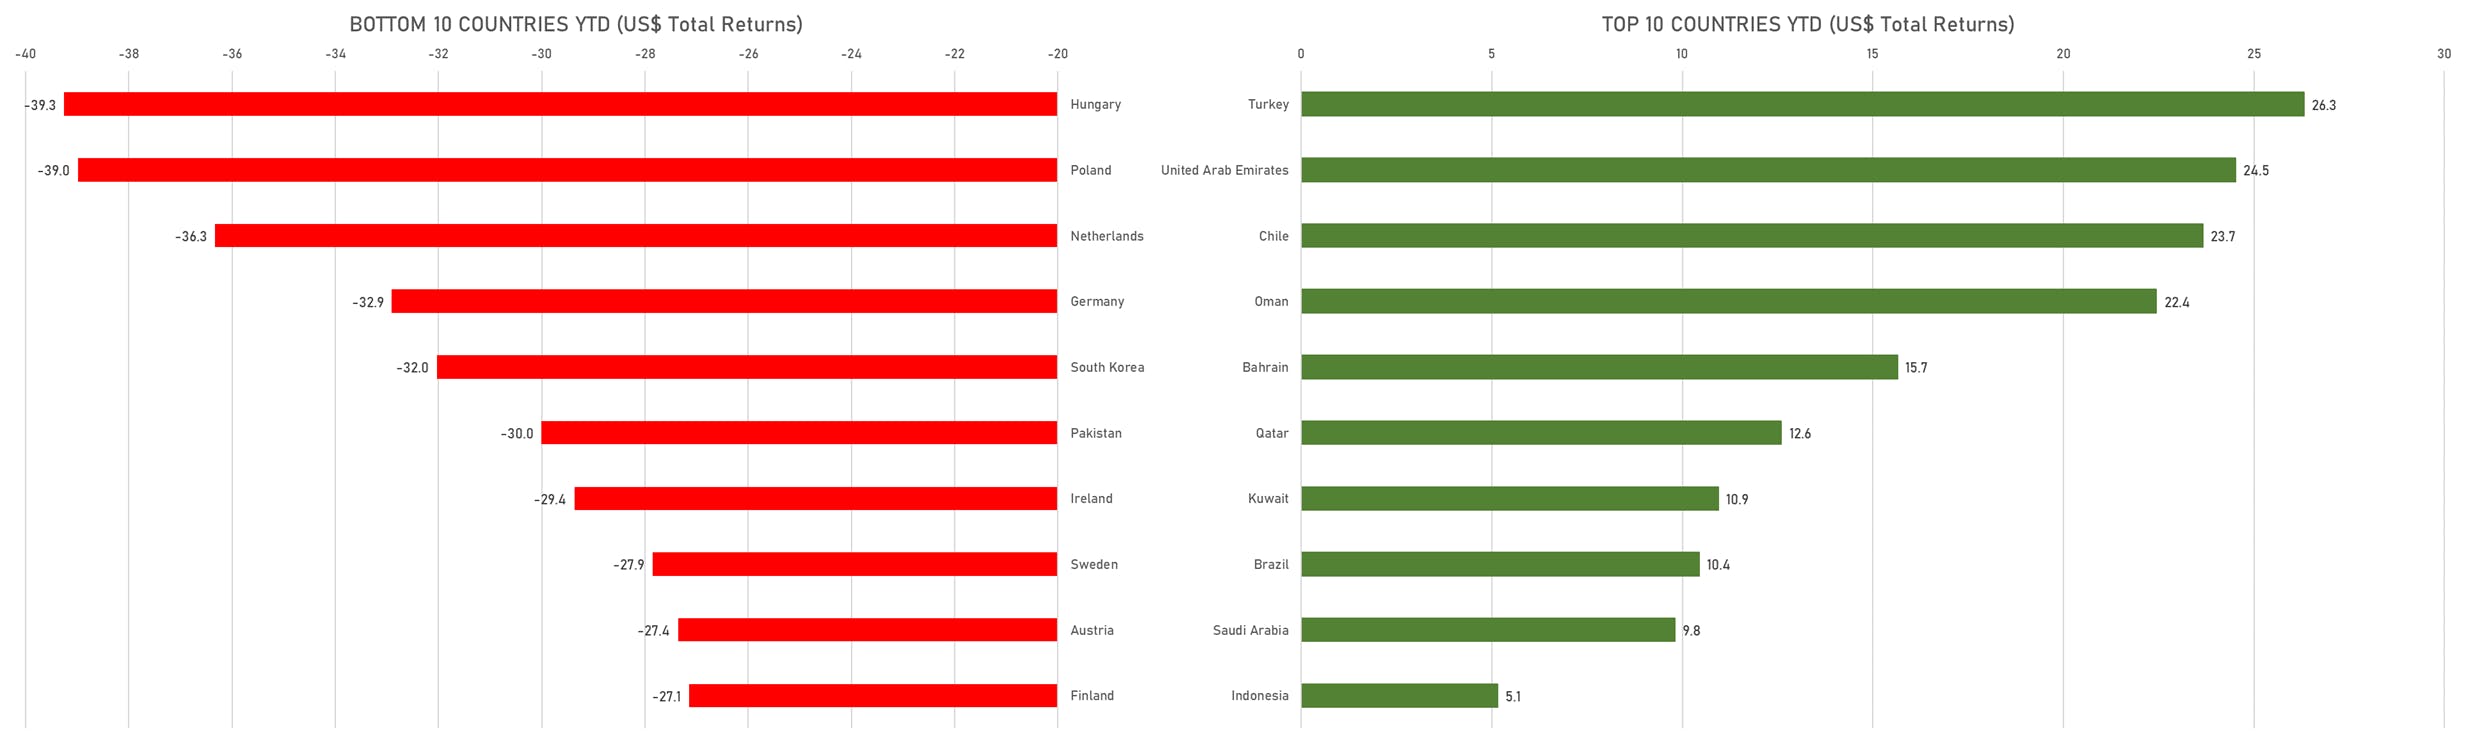
USD Total Returns Year To Date | Sources: ϕpost, FactSet data
DAILY SUMMARY
- Daily performance of US indices: S&P 500 down -0.72%; Nasdaq Composite down -0.90%; Wilshire 5000 down -0.95%
- 27.6% of S&P 500 stocks were up today, with 25.2% of stocks above their 200-day moving average (DMA) and 24.7% above their 50-DMA
- Top performing sectors in the S&P 500: consumer staples up 0.25% and real estate up 0.03%
- Bottom performing sectors in the S&P 500: energy down -2.17% and industrials down -2.06%
- The number of shares in the S&P 500 traded today was 2,094m for a total turnover of US$ 190 bn
- The S&P 500 Value Index was down -0.7%, while the S&P 500 Growth Index was down -0.7%; the S&P small caps index was down -0.7% and mid-caps were down -1.4%
- The volume on CME's INX (S&P 500 Index) was 4,363.3m (3-month z-score: 4.1); the 3-month average volume is 2,302.0m and the 12-month range is 1,340.2 - 4,692.3m
- Daily performance of international indices: Europe Stoxx 600 down -1.58%; UK FTSE 100 down -0.62%; Hang Seng SH-SZ-HK 300 Index down -1.84%; Japan's TOPIX 500 down -0.59%
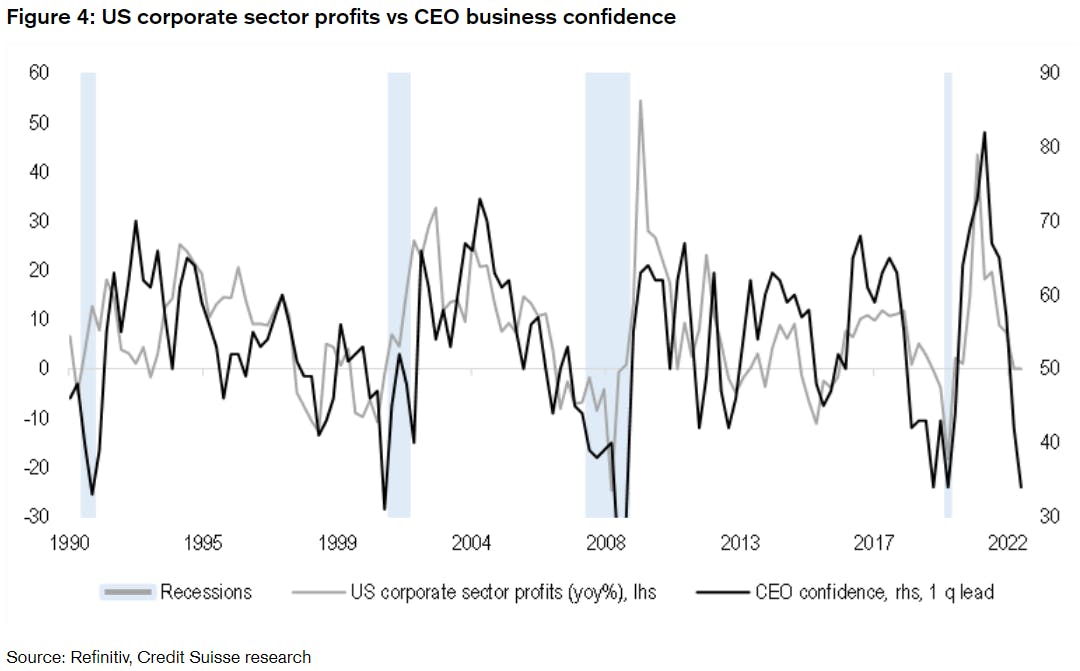
- In addition to real rates pushing multiples lower, it's worth noting that US CEOs are currently much more pessimistic than the corporate profits data
VOLATILITY TODAY
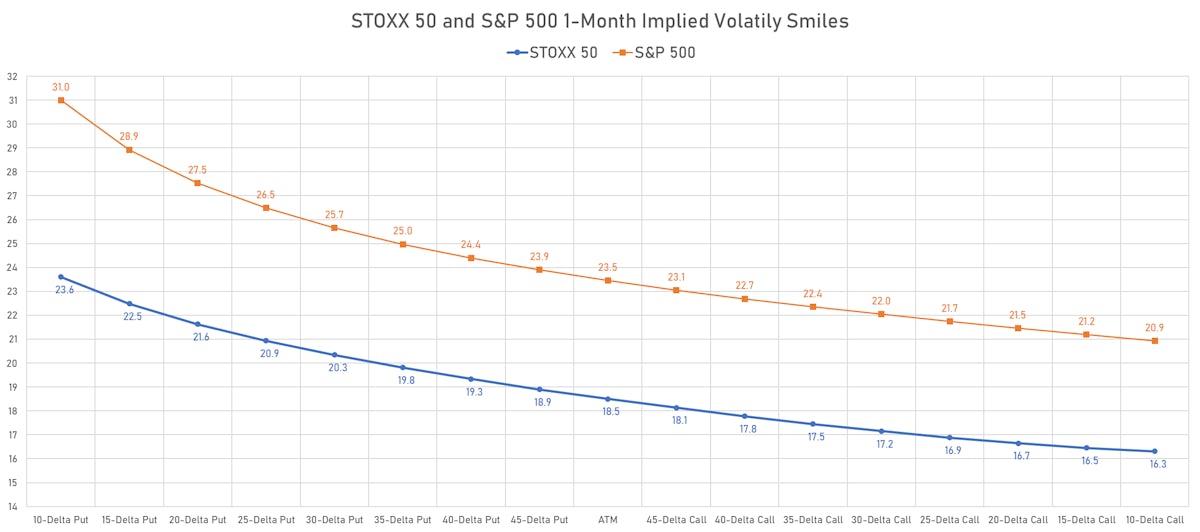
- 1-month at-the-money implied volatility on the S&P 500 at 23.5%, up from 22.6%
- 1-month at-the-money implied volatility on the STOXX Europe 600 at 19.7%, up from 18.8%
TOP S&P 500 PERFORMERS THIS WEEK
- Royal Caribbean Cruises Ltd (RCL), up 6.8% to $50.44 / YTD price return: -34.4% / 12-Month Price Range: $ 31.09-98.21 / Short interest (% of float): 9.5%; days to cover: 2.7
- APA Corp (US) (APA), up 6.2% to $40.46 / YTD price return: +50.5% / 12-Month Price Range: $ 18.53-51.95 / Short interest (% of float): 3.4%; days to cover: 1.4
- Norwegian Cruise Line Holdings Ltd (NCLH), up 4.9% to $15.31 / YTD price return: -26.2% / 12-Month Price Range: $ 10.31-29.44
- Humana Inc (HUM), up 4.5% to $499.79 / YTD price return: +7.8% / 12-Month Price Range: $ 351.58-504.35 / Short interest (% of float): 1.3%; days to cover: 2.4
- Wynn Resorts Ltd (WYNN), up 4.2% to $65.42 / YTD price return: -23.1% / 12-Month Price Range: $ 50.22-98.99
- Enphase Energy Inc (ENPH), up 4.0% to $318.01 / YTD price return: +73.8% / 12-Month Price Range: $ 113.49-324.78 / Short interest (% of float): 3.2%; days to cover: 1.2
- Carnival Corp (CCL), up 3.5% to $10.76 / YTD price return: -46.5% / 12-Month Price Range: $ 8.10-27.39
- Starbucks Corp (SBUX), up 3.0% to $91.31 / YTD price return: -21.9% / 12-Month Price Range: $ 68.39-117.80 / Short interest (% of float): 1.4%; days to cover: 2.7
- Netflix Inc (NFLX), up 2.8% to $240.13 / YTD price return: -60.1% / 12-Month Price Range: $ 162.81-700.50 / Short interest (% of float): 2.2%; days to cover: 1.2
- Allstate Corp (ALL), up 2.4% to $129.42 / YTD price return: +10.0% / 12-Month Price Range: $ 106.12-144.46 / Short interest (% of float): 1.8%; days to cover: 2.8
BOTTOM S&P 500 PERFORMERS THIS WEEK
- Adobe Inc (ADBE), down 24.1% to $299.50 / YTD price return: -47.2% / 12-Month Price Range: $ 299.50-699.50 / Short interest (% of float): 1.1%; days to cover: 2.2
- FedEx Corp (FDX), down 23.0% to $161.02 / YTD price return: -37.7% / 12-Month Price Range: $ 161.02-266.66 / Short interest (% of float): 1.4%; days to cover: 2.2 (the stock is currently on the short sale restriction list)
- Nucor Corp (NUE), down 18.4% to $117.08 / YTD price return: +2.6% / 12-Month Price Range: $ 88.50-187.90 / Short interest (% of float): 3.3%; days to cover: 4.8
- Westrock Co (WRK), down 16.3% to $34.15 / YTD price return: -23.0% / 12-Month Price Range: $ 34.15-54.78 / Short interest (% of float): 1.2%; days to cover: 2.0 (the stock is currently on the short sale restriction list)
- Generac Holdings Inc (GNRC), down 15.9% to $200.17 / YTD price return: -43.1% / 12-Month Price Range: $ 197.94-522.66 / Short interest (% of float): 10.5%; days to cover: 7.4
- International Paper Co (IP), down 15.6% to $35.23 / YTD price return: -25.0% / 12-Month Price Range: $ 35.23-56.53 / Short interest (% of float): 4.4%; days to cover: 6.0 (the stock is currently on the short sale restriction list)
- Eastman Chemical Co (EMN), down 15.5% to $79.13 / YTD price return: -34.6% / 12-Month Price Range: $ 79.13-129.44 / Short interest (% of float): 1.9%; days to cover: 2.8
- Packaging Corp of America (PKG), down 15.4% to $118.07 / YTD price return: -13.3% / 12-Month Price Range: $ 118.07-168.25 / Short interest (% of float): 2.4%; days to cover: 3.5 (the stock is currently on the short sale restriction list)
- Western Digital Corp (WDC), down 15.0% to $37.22 / YTD price return: -42.9% / 12-Month Price Range: $ 37.22-69.35
- West Pharmaceutical Services Inc (WST), down 14.5% to $268.06 / YTD price return: -42.8% / 12-Month Price Range: $ 268.06-473.91 / Short interest (% of float): 1.0%; days to cover: 2.0
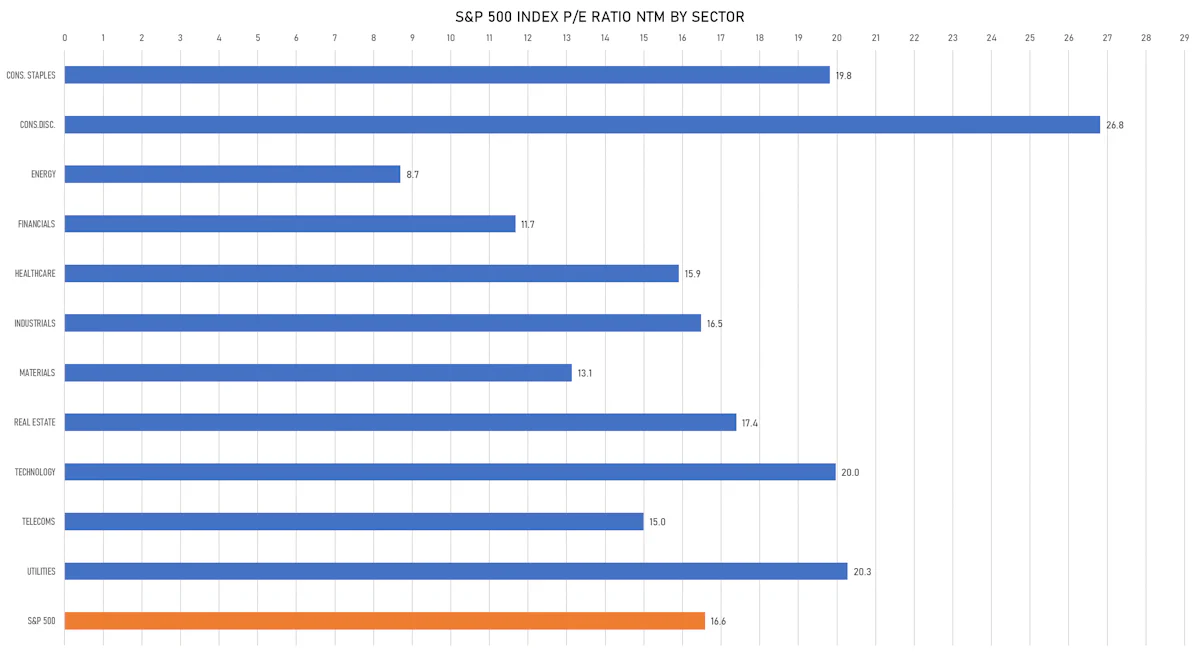
US VALUATION MULTIPLES
WEEKLY TOTAL RETURNS OF MAJOR GLOBAL EQUITY MARKETS
TOP / BOTTOM PERFORMING WORLD MARKETS YTD
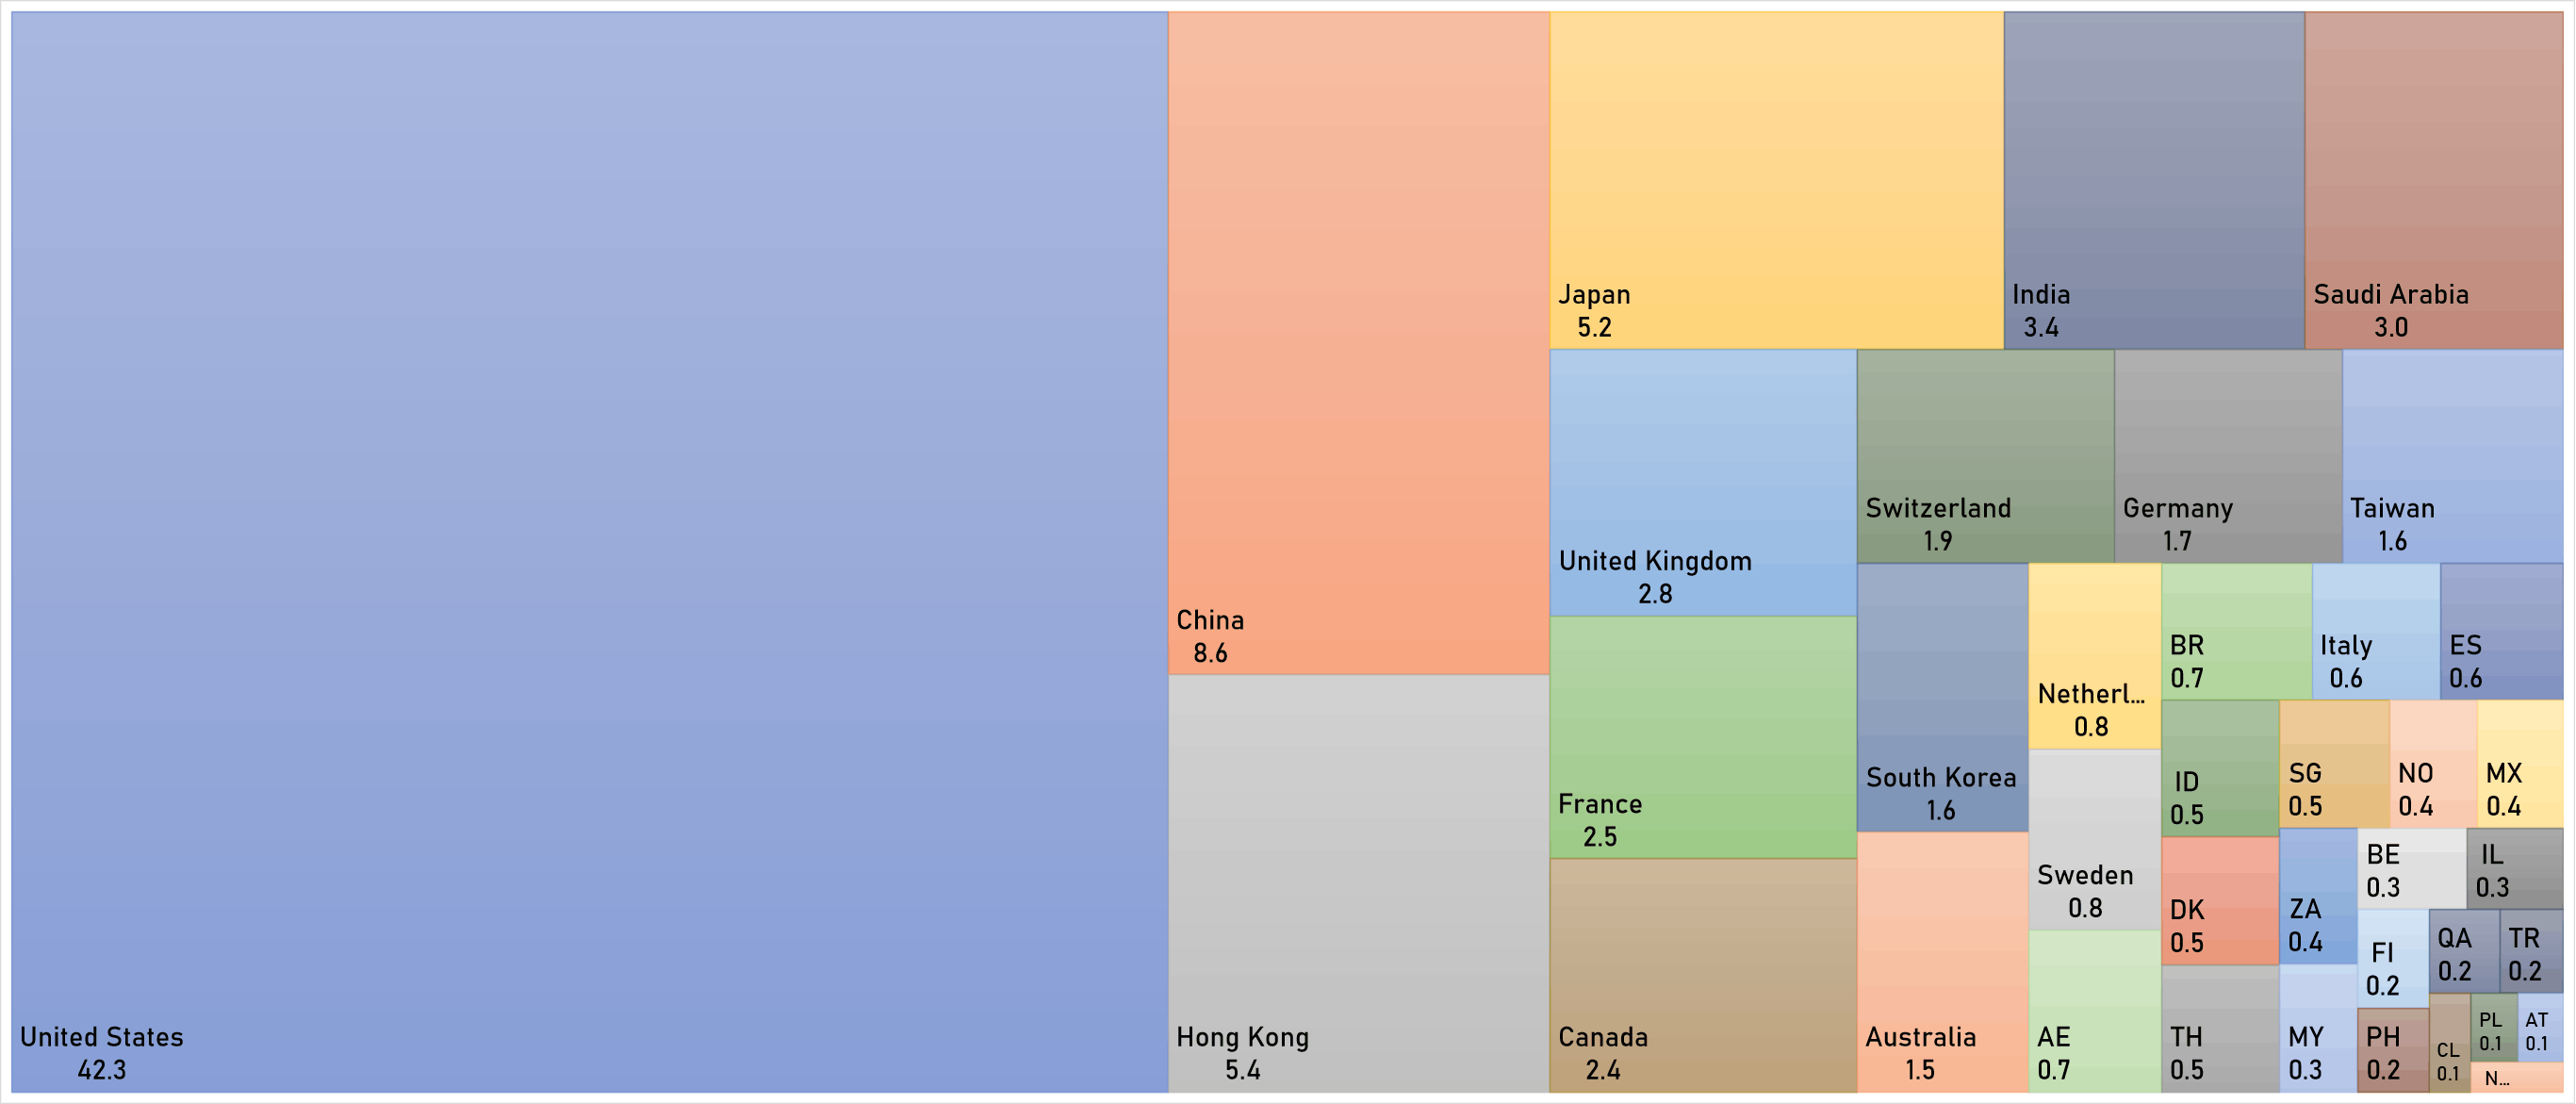
WORLD MARKET CAPITALIZATION (US$ Trillion)