Equities
No Surprises In The Extended US Equities Drawdown, With Rates Volatility Driving Further Losses
Although we still expect lower lows for this cycle, from a compression in multiples and corporate margins, we should see a bounce this week, as multiple technical indicators point to short-term capitulation
Published ET
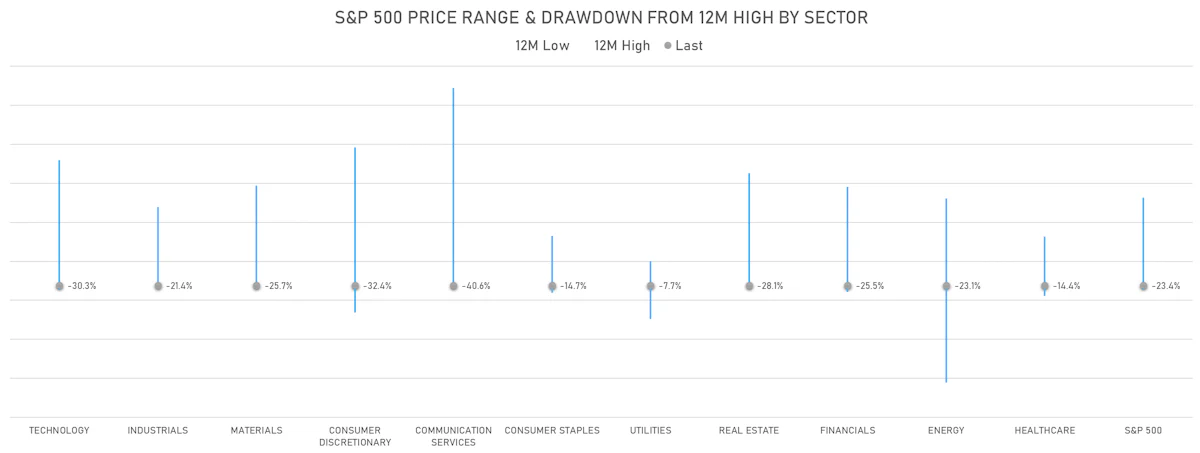
S&P 500 12-Month Price Range By Sector | Sources: ϕpost, Refinitiv data
DAILY SUMMARY
- Daily performance of US indices: S&P 500 down -1.72%; Nasdaq Composite down -1.80%; Wilshire 5000 down -1.86%
- 13.3% of S&P 500 stocks were up today, with 13.1% of stocks above their 200-day moving average (DMA) and 4.4% above their 50-DMA
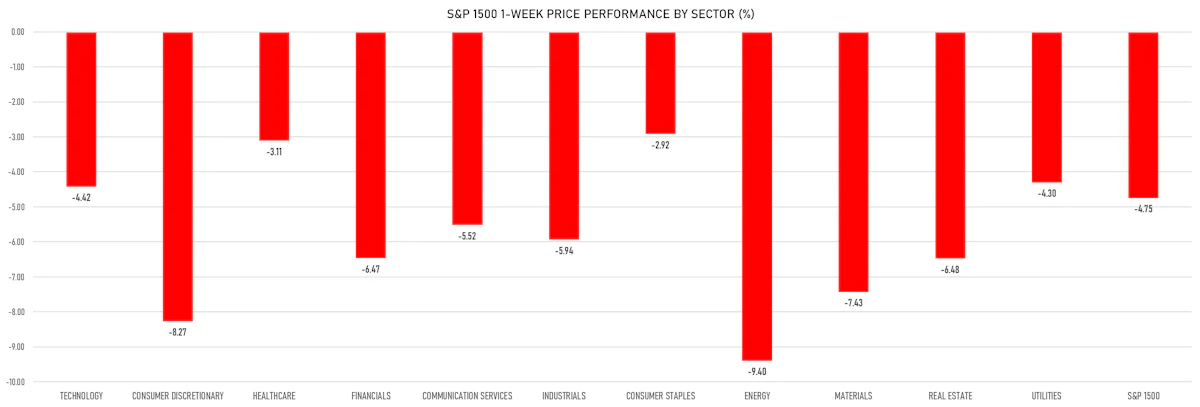
- Top performing sectors in the S&P 500: healthcare down -0.54% and utilities down -1.18%
- Bottom performing sectors in the S&P 500: energy down -6.75% and consumer discretionary down -2.29%
- The number of shares in the S&P 500 traded today was 730m for a total turnover of US$ 64 bn
- The S&P 500 Value Index was down -1.8%, while the S&P 500 Growth Index was down -1.6%; the S&P small caps index was down -2.2% and mid-caps were down -2.1%
- The volume on CME's INX (S&P 500 Index) was 2812.6m (3-month z-score: 1.5); the 3-month average volume is 2250.8m and the 12-month range is 1340.2 - 4692.3m
- Daily performance of international indices: Europe Stoxx 600 down -2.34%; UK FTSE 100 down -1.97%; Hang Seng SH-SZ-HK 300 Index down -0.73%; Japan's TOPIX 500 down -0.25%
VOLATILITY TODAY
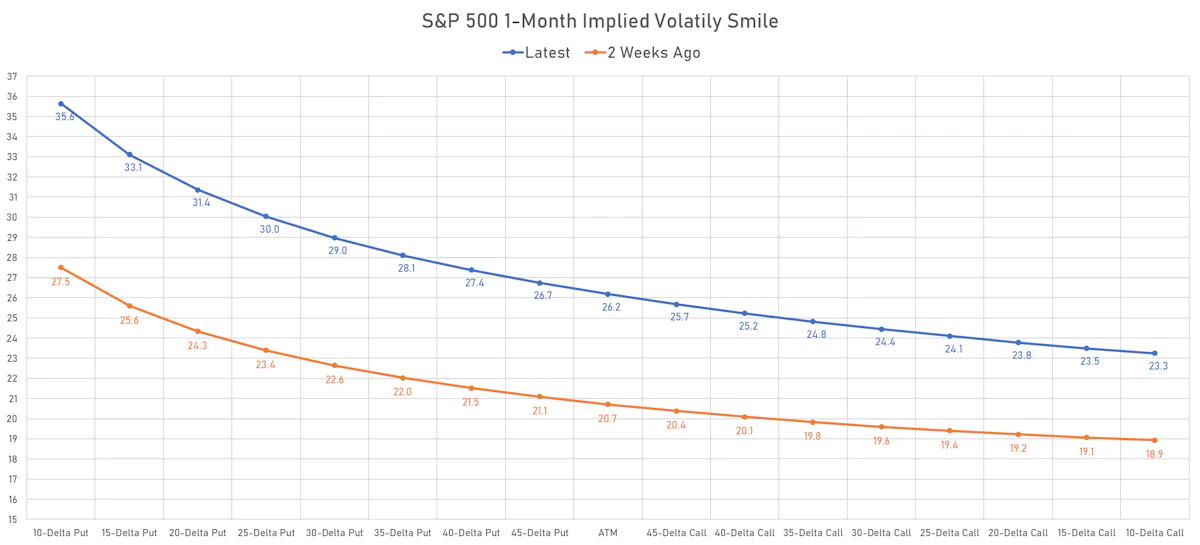
- 1-month at-the-money implied volatility on the S&P 500 at 26.2%, up from 24.4%
- 1-month at-the-money implied volatility on the STOXX Europe 600 at 23.0%, up from 21.1%
TOP S&P 500 PERFORMERS THIS WEEK
- General Mills Inc (GIS), up 5.2% to $79.17 / YTD price return: +17.5% / 12-Month Price Range: $ 58.85-81.23 / Short interest (% of float): 2.2%; days to cover: 4.0
- Kellogg Co (K), up 2.8% to $73.04 / YTD price return: +13.4% / 12-Month Price Range: $ 59.54-76.99 / Short interest (% of float): 3.7%; days to cover: 5.6
- Allegion PLC (ALLE), up 2.7% to $92.04 / YTD price return: -30.5% / 12-Month Price Range: $ 89.01-139.50 / Short interest (% of float): 2.2%; days to cover: 3.0
- Hormel Foods Corp (HRL), up 2.4% to $46.87 / YTD price return: -4.0% / 12-Month Price Range: $ 40.48-55.11 / Short interest (% of float): 3.8%; days to cover: 9.2
- Campbell Soup Co (CPB), up 1.9% to $48.60 / YTD price return: +11.8% / 12-Month Price Range: $ 39.77-51.94 / Short interest (% of float): 6.3%; days to cover: 6.6
- Hershey Co (HSY), up 1.8% to $223.94 / YTD price return: +15.7% / 12-Month Price Range: $ 167.82-234.55 / Short interest (% of float): 1.7%; days to cover: 3.0
- Lennar Corp (LEN), up 1.7% to $77.07 / YTD price return: -33.7% / 12-Month Price Range: $ 62.60-117.50 / Short interest (% of float): 5.0%; days to cover: 4.7
- Conagra Brands Inc (CAG), up 1.6% to $34.35 / YTD price return: +.7% / 12-Month Price Range: $ 30.07-36.97 / Short interest (% of float): 1.9%; days to cover: 3.3
- Lamb Weston Holdings Inc (LW), up 1.3% to $77.55 / YTD price return: +22.4% / 12-Month Price Range: $ 49.72-83.28 / Short interest (% of float): 1.7%; days to cover: 1.9
- J M Smucker Co (SJM), up 1.3% to $140.65 / YTD price return: +3.6% / 12-Month Price Range: $ 119.09-146.74 / Short interest (% of float): 4.2%; days to cover: 5.4
BOTTOM S&P 500 PERFORMERS THIS WEEK
- Caesars Entertainment Inc (CZR), down 21.5% to $35.37 / YTD price return: -62.2% / 12-Month Price Range: $ 35.10-119.79 / Short interest (% of float): 5.9%; days to cover: 4.4
- APA Corp (US) (APA), down 18.8% to $32.87 / YTD price return: +22.2% / 12-Month Price Range: $ 19.95-51.95 / Short interest (% of float): 3.4%; days to cover: 1.4 (the stock is currently on the short sale restriction list)
- Carnival Corp (CCL), down 16.8% to $8.95 / YTD price return: -55.5% / 12-Month Price Range: $ 8.10-27.39 / Short interest (% of float): 9.8%; days to cover: 1.8
- Solaredge Technologies Inc (SEDG), down 16.7% to $258.80 / YTD price return: -7.8% / 12-Month Price Range: $ 200.95-389.00 / Short interest (% of float): 3.2%; days to cover: 1.5
- Marathon Oil Corp (MRO), down 16.5% to $21.90 / YTD price return: +33.4% / 12-Month Price Range: $ 12.07-33.23 / Short interest (% of float): 2.7%; days to cover: 1.3 (the stock is currently on the short sale restriction list)
- Ford Motor Co (F), down 16.3% to $12.31 / YTD price return: -40.7% / 12-Month Price Range: $ 10.62-25.87 / Short interest (% of float): 2.8%; days to cover: 1.7
- Iron Mountain Inc (IRM), down 15.7% to $46.60 / YTD price return: -10.9% / 12-Month Price Range: $ 41.67-58.61 / Short interest (% of float): 6.0%; days to cover: 10.8
- Catalent Inc (CTLT), down 15.4% to $76.07 / YTD price return: -40.6% / 12-Month Price Range: $ 76.07-142.08 / Short interest (% of float): 1.9%; days to cover: 2.9
- Charter Communications Inc (CHTR), down 14.8% to $321.66 / YTD price return: -50.7% / 12-Month Price Range: $ 321.66-762.83 / Short interest (% of float): 8.2%; days to cover: 7.0
- Match Group Inc (MTCH), down 14.6% to $47.30 / YTD price return: -64.2% / 12-Month Price Range: $ 47.30-181.99 / Short interest (% of float): 3.8%; days to cover: 3.2
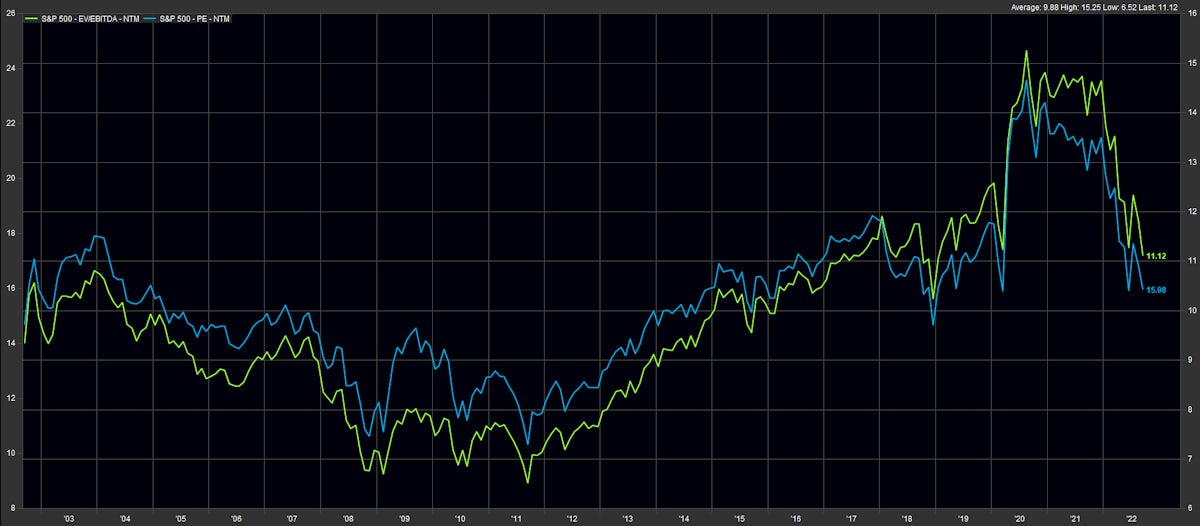
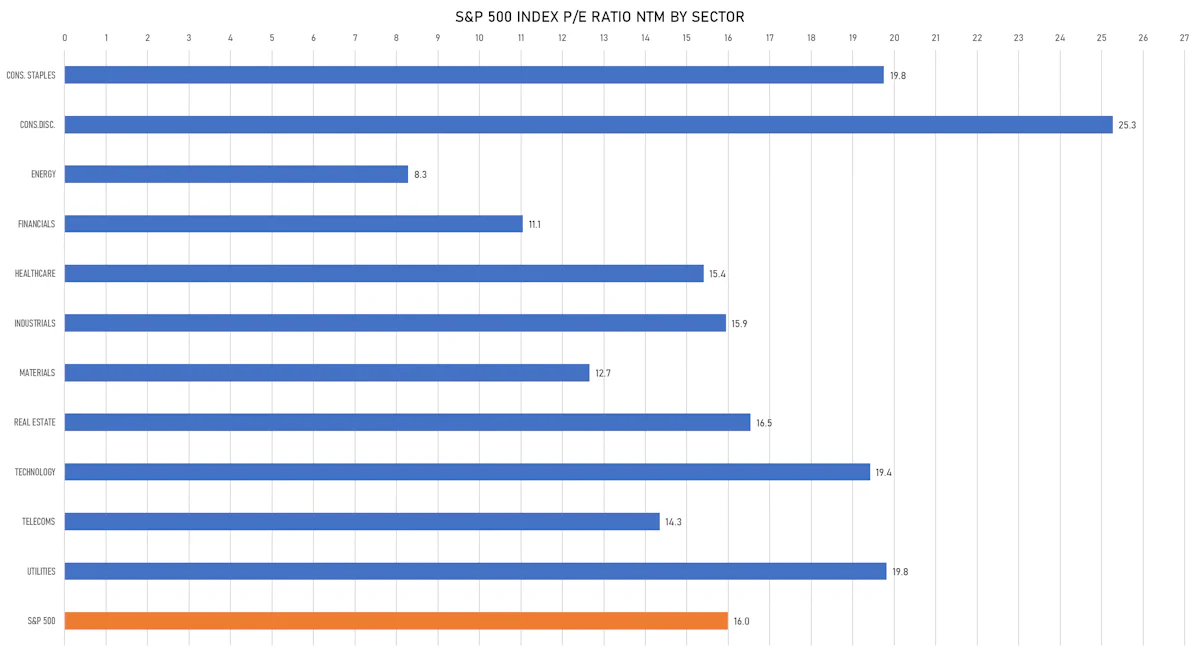
US VALUATION MULTIPLES
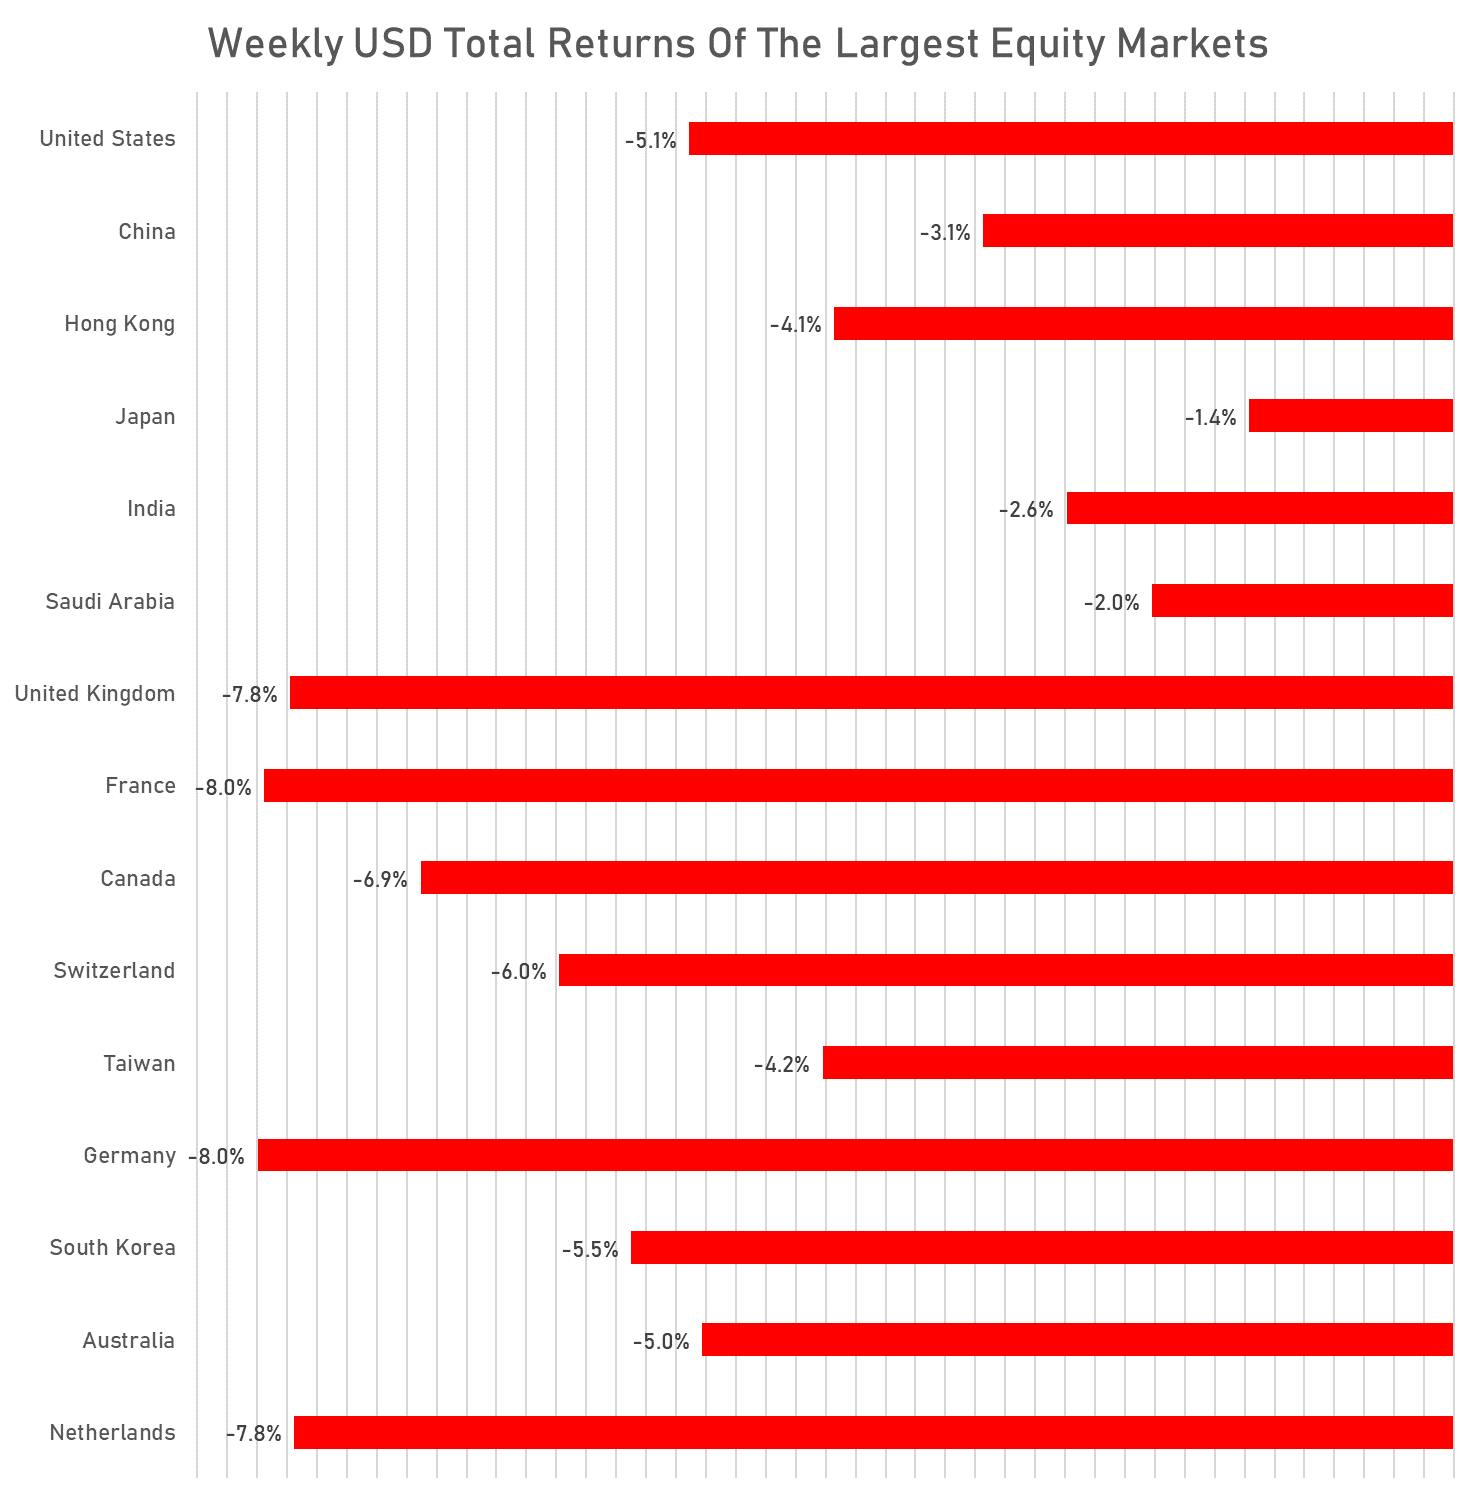
WEEKLY TOTAL RETURNS OF MAJOR GLOBAL EQUITY MARKETS
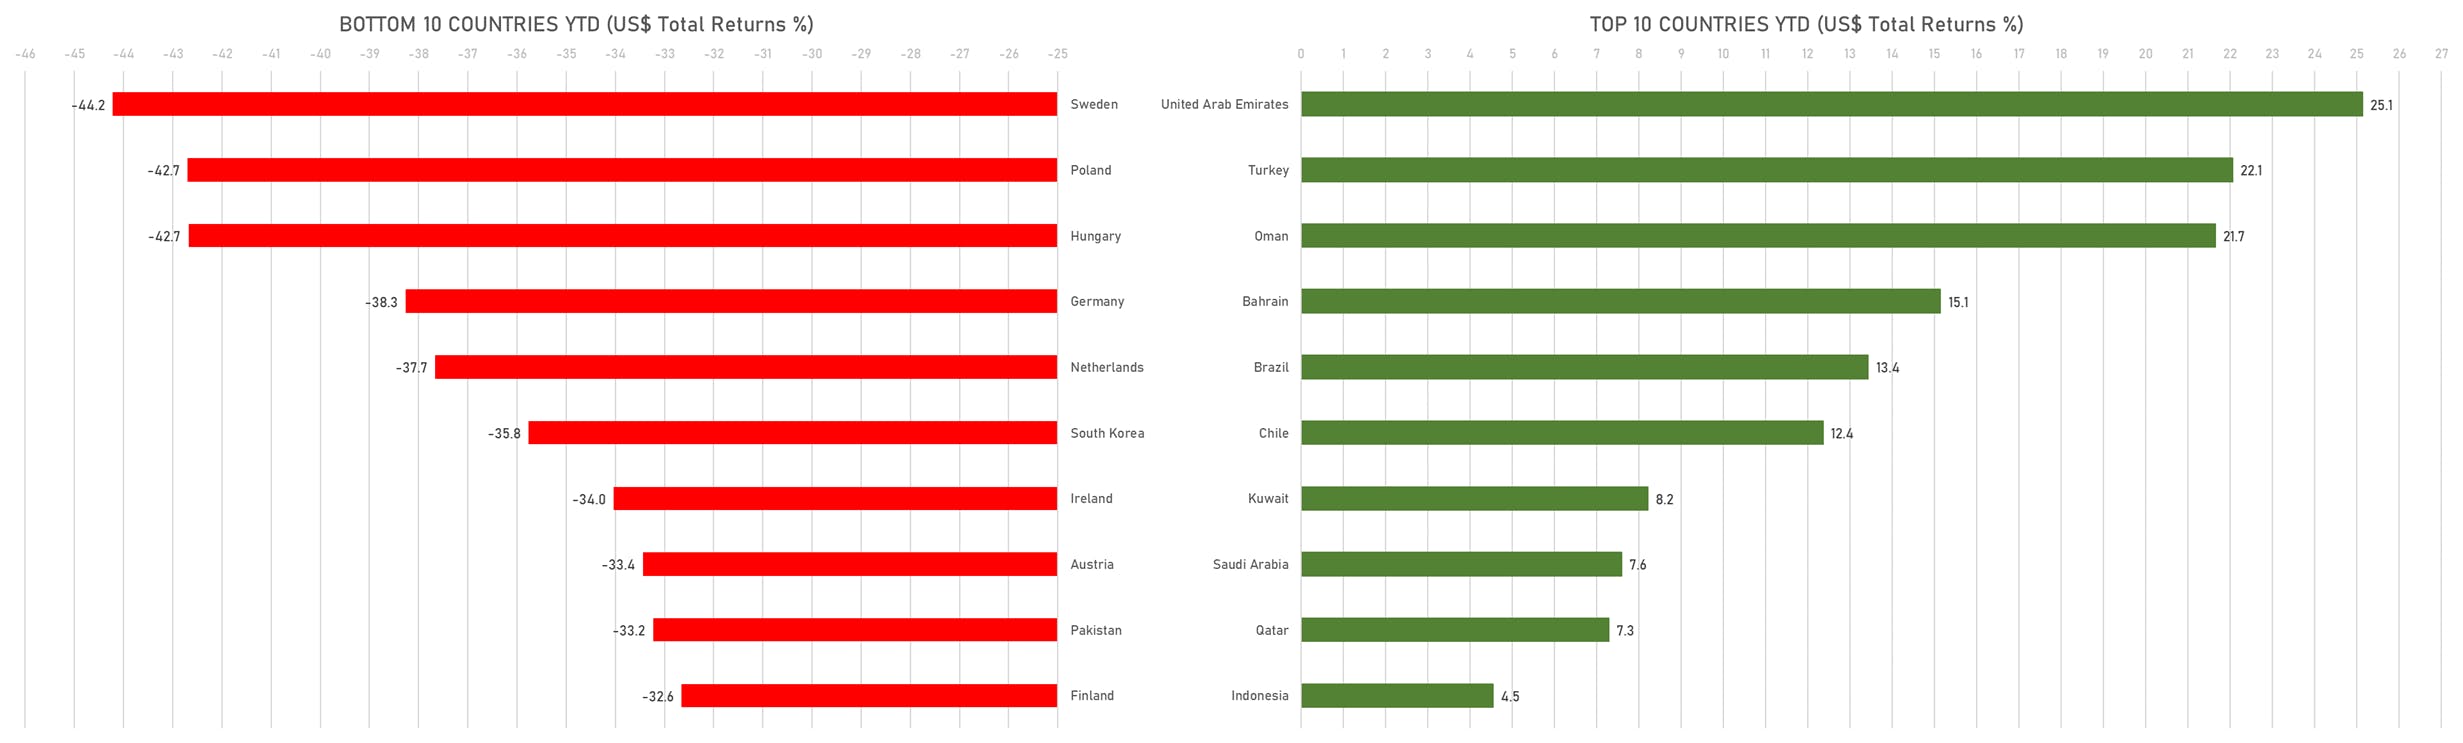
TOP / BOTTOM PERFORMING WORLD MARKETS YTD
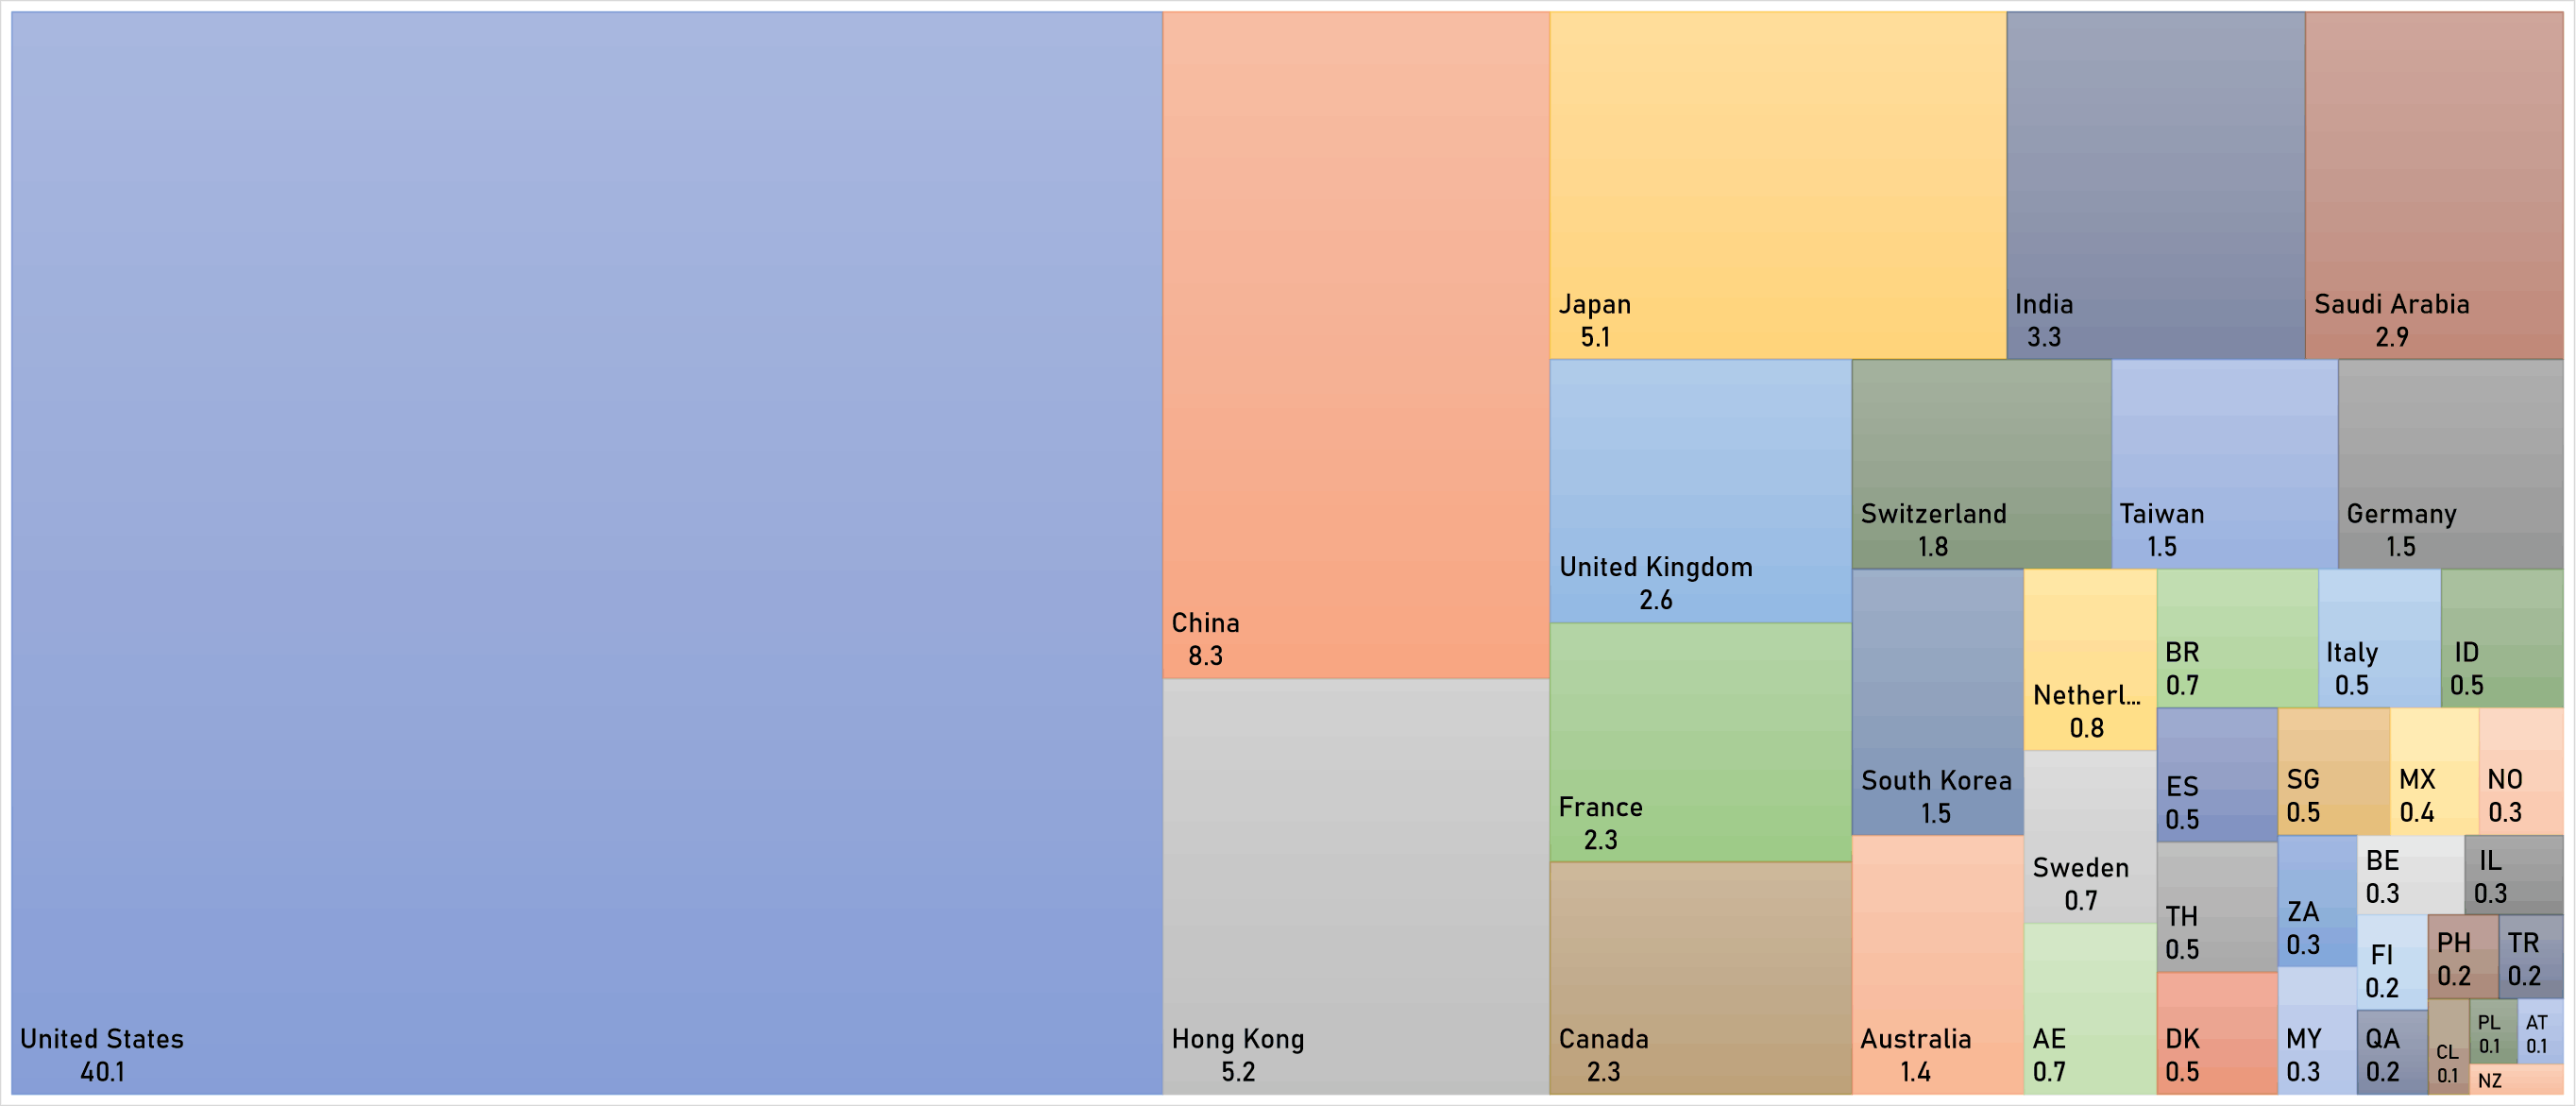
WORLD MARKET CAPITALIZATION (US$ Trillion)