Equities
Choppy Week For US Equities, Ending Modestly Up After Big Gapping Moves On Tuesday And Friday
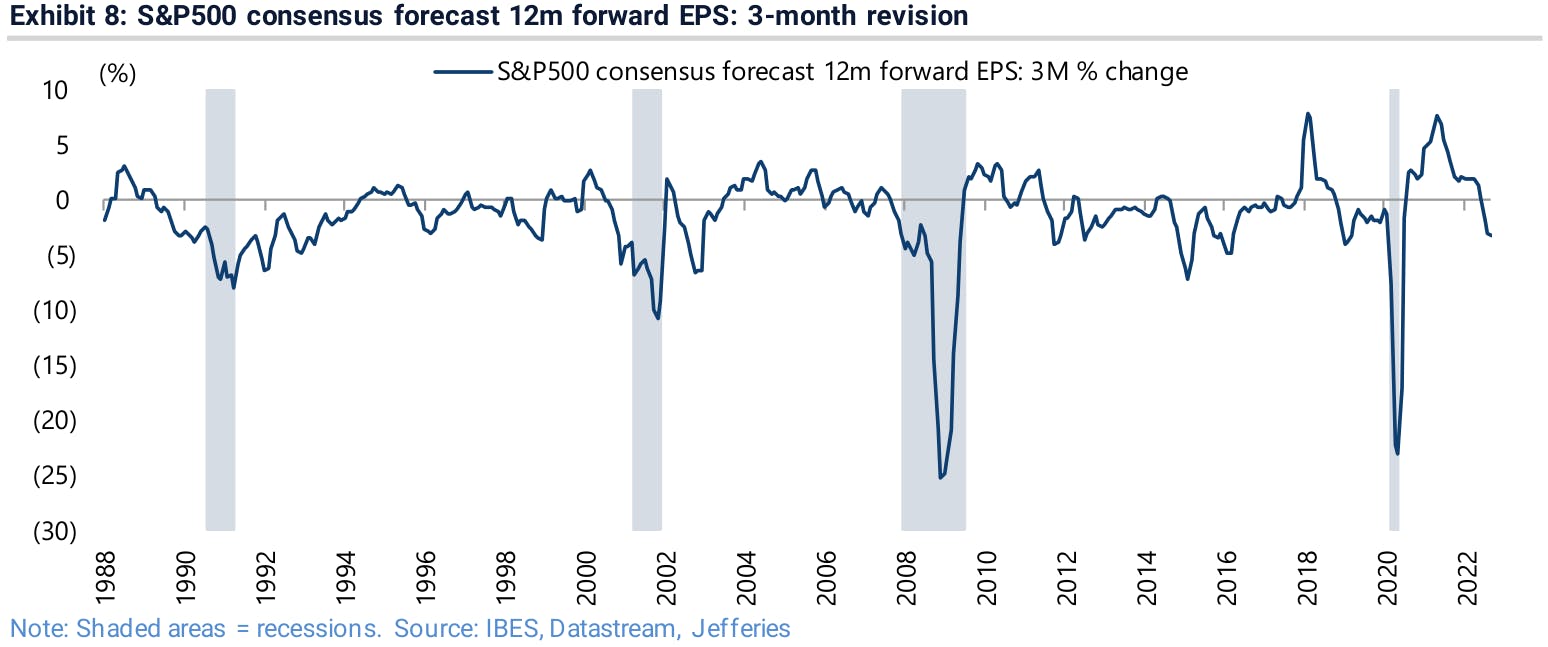
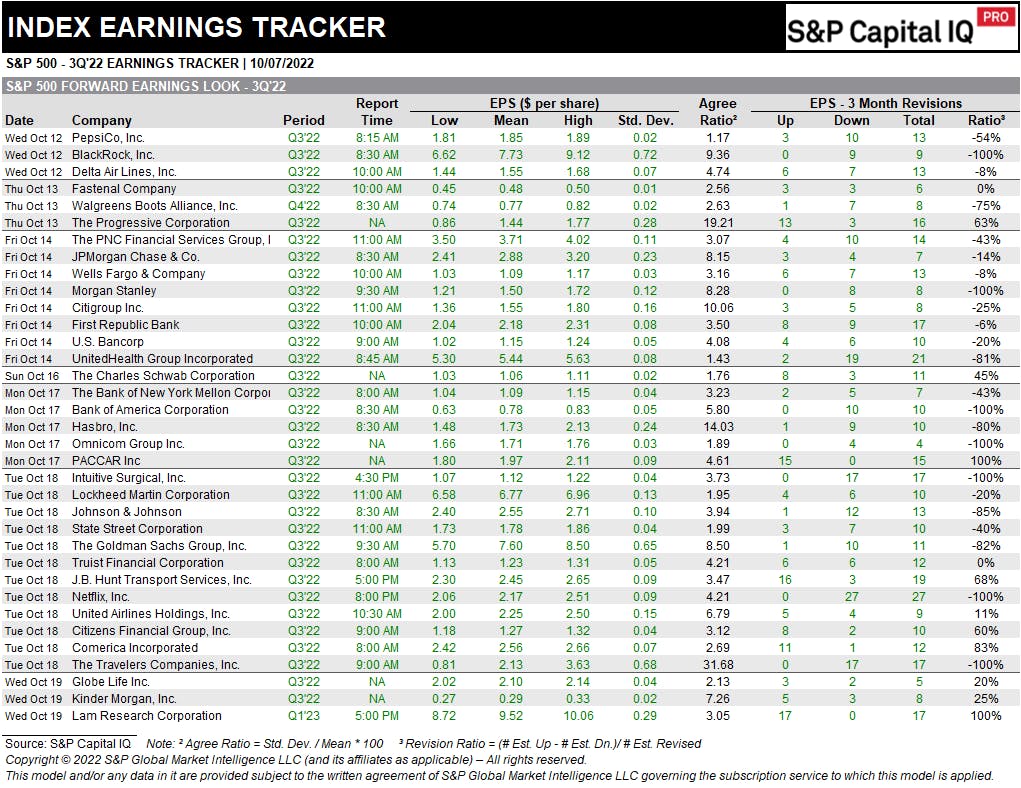
3Q22 earnings season is upon us, with Pepsi kicking things off on Wednesday; estimates have come down over the past month, but probably not enough to reflect a US recession 1Y forward
Published ET
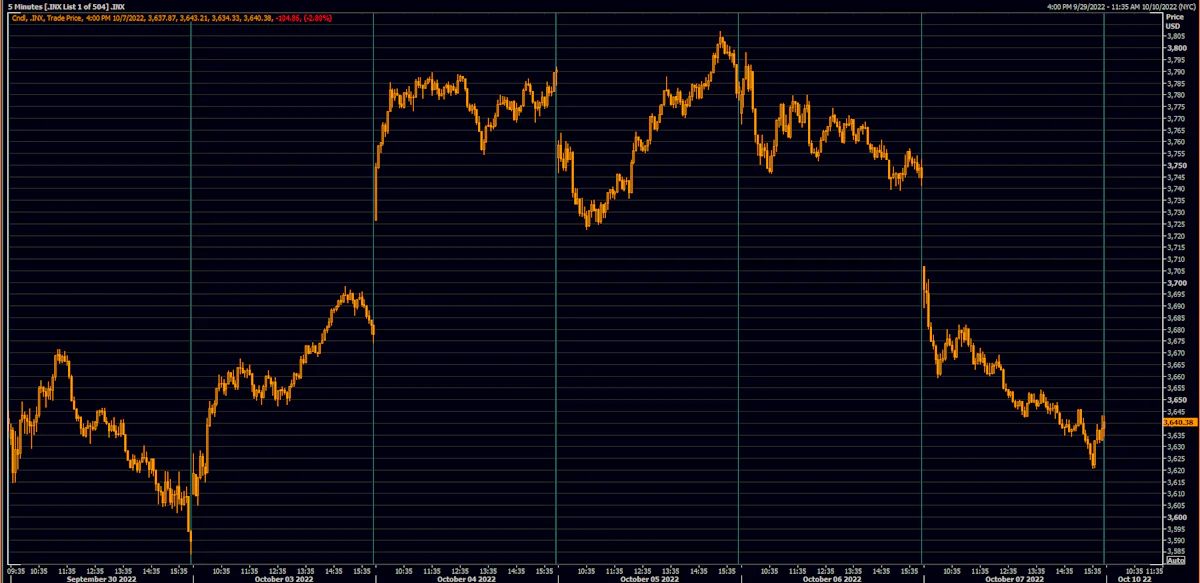
S&P 500 Index Prices Over The Past Week | Source: Refinitiv
US EQUITIES OUTLOOK
- Tactical indicators were pointing to a rebound a couple of weeks ago and we sort of got that earlier this week, but unemployment data today brought things back down. We're tempted to think we could have a more meaningful bear market rally, especially if the CPI next week meets market expectations
- Having said that, we still view US equities making a lower cycle low later on, with 1Y forward estimates far from discounting a recession in the back half of next year
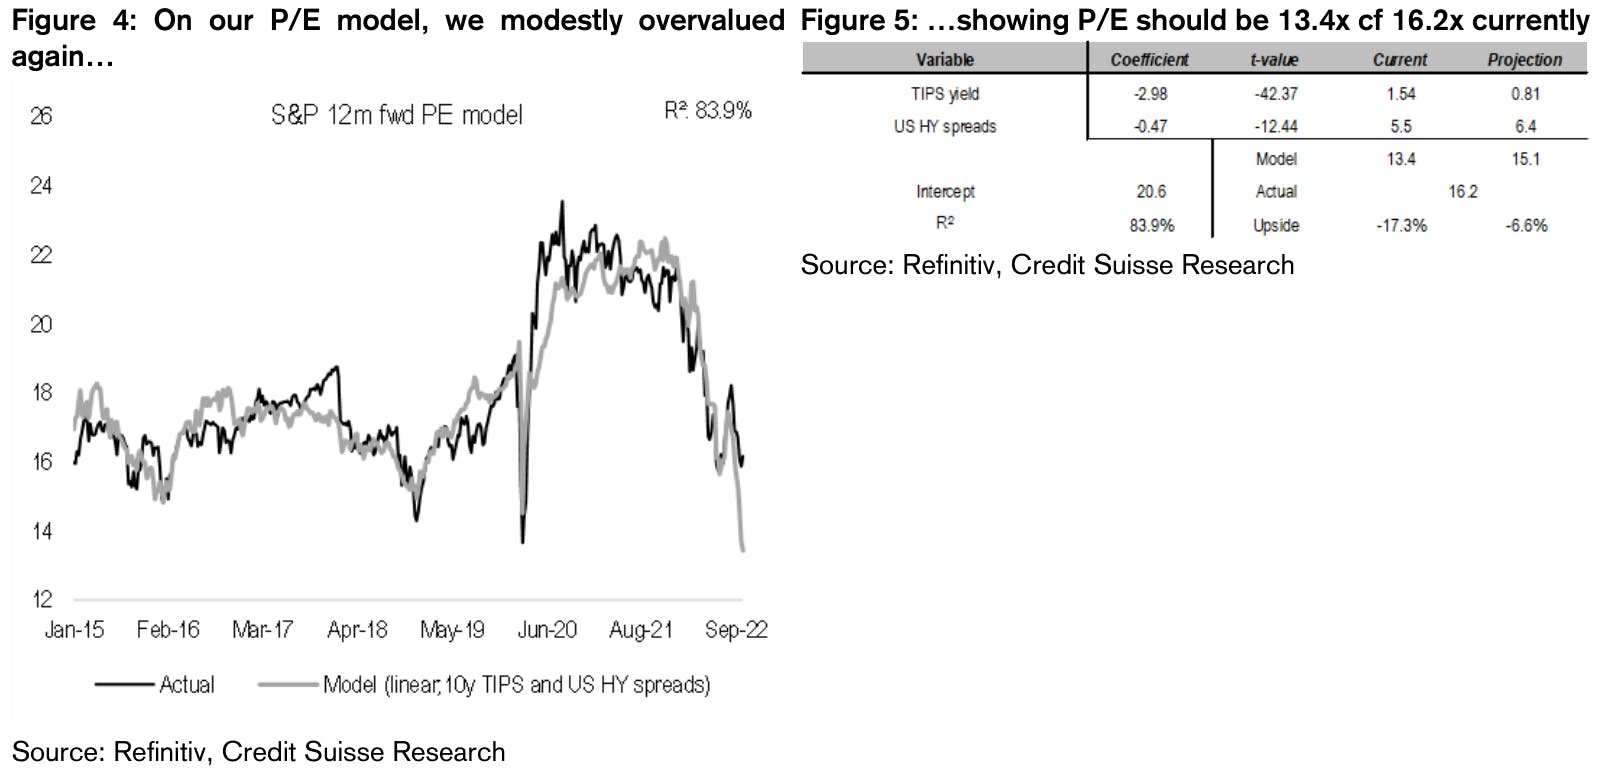
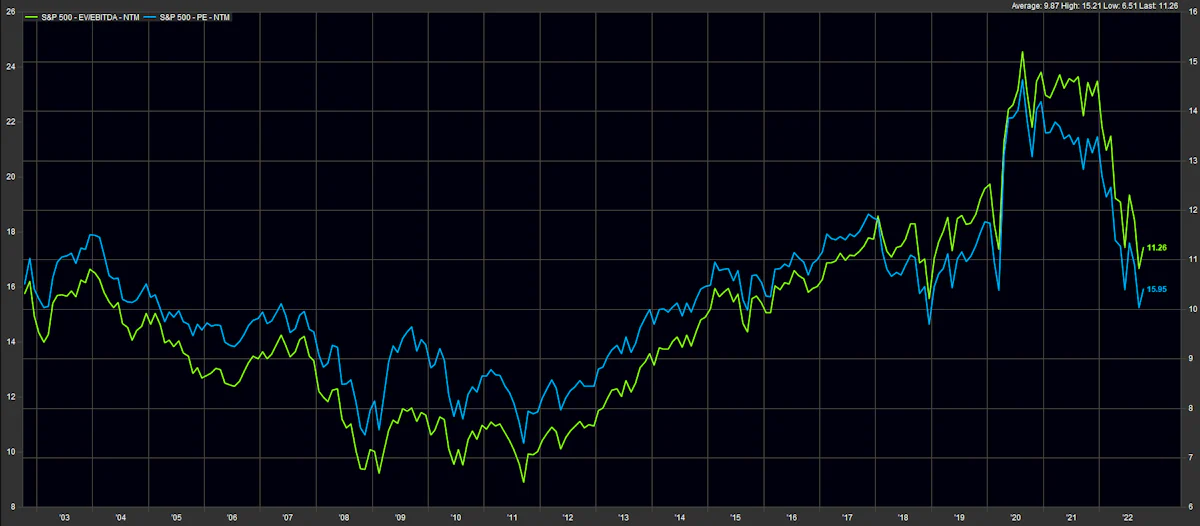
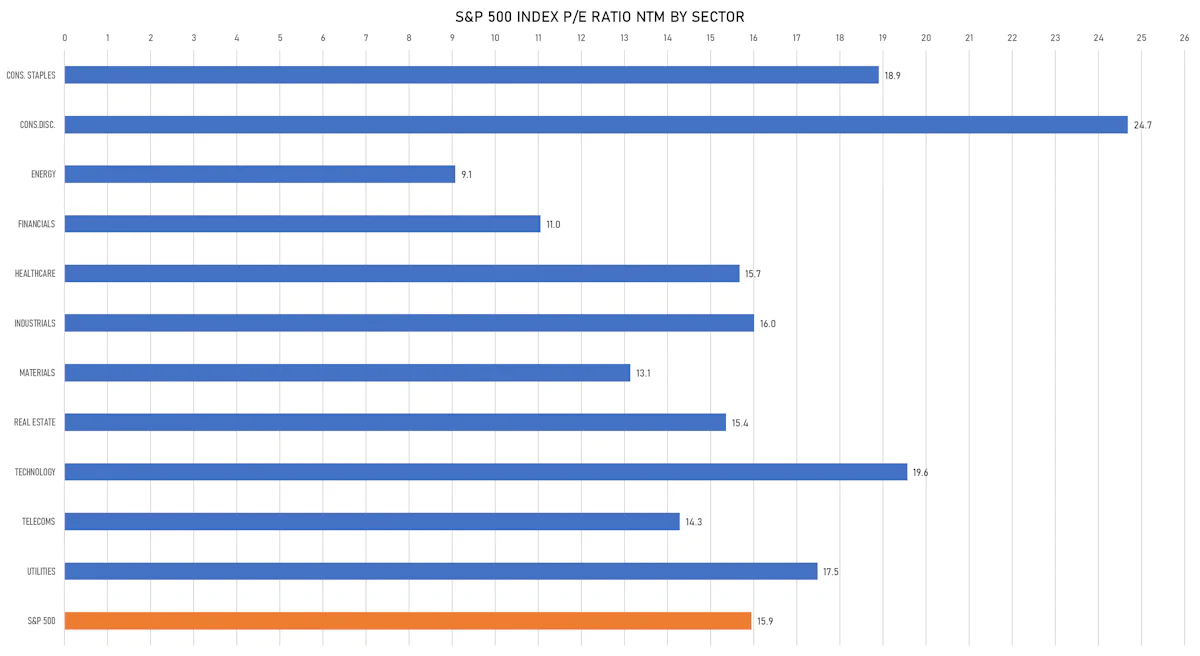
- In addition to earnings, multiples should compress further, with the Credit Suisse model pointing to a forward P/E of 13.4 for the S&P 500 (vs 16 currently)
DAILY SUMMARY
- Daily performance of US indices: S&P 500 down -2.80%; Nasdaq Composite down -3.80%; Wilshire 5000 down -2.86%
- 5.8% of S&P 500 stocks were up today, with 16.1% of stocks above their 200-day moving average (DMA) and 11.5% above their 50-DMA
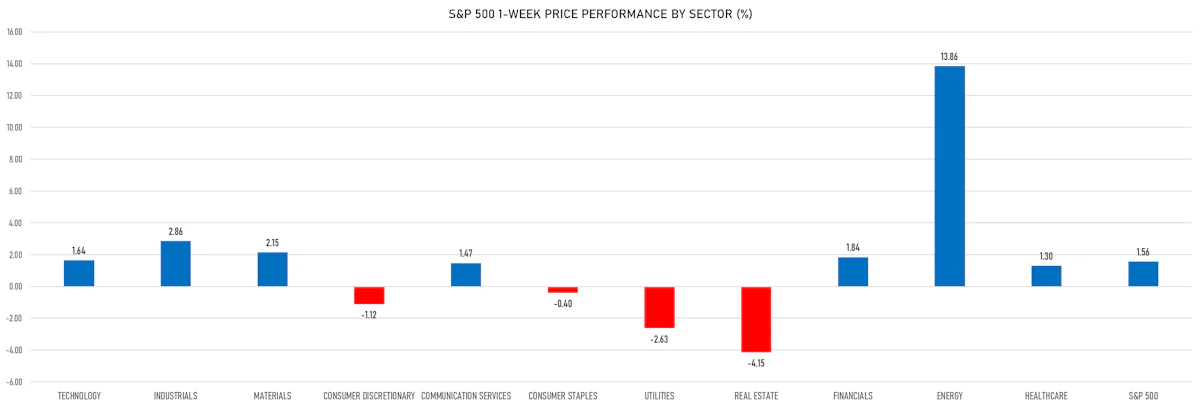
- Top performing sectors in the S&P 500: energy down -0.72% and consumer staples down -1.55%
- Bottom performing sectors in the S&P 500: technology down -4.14% and consumer discretionary down -3.54%
- The number of shares in the S&P 500 traded today was 758m for a total turnover of US$ 66 bn
- The S&P 500 Value Index was down -2.0%, while the S&P 500 Growth Index was down -3.6%; the S&P small caps index was down -2.2% and mid caps were down -2.2%
- The volume on CME's INX (S&P 500 Index) was 2716.1m (3-month z-score: 1.0); the 3-month average volume is 2307.1m and the 12-month range is 1340.2 - 4692.3m
- Daily performance of international indices: Europe Stoxx 600 down -1.18%; UK FTSE 100 down -0.09%; Hang Seng SH-SZ-HK 300 Index down -0.70%; Japan's TOPIX 500 down -0.84%
VOLATILITY TODAY
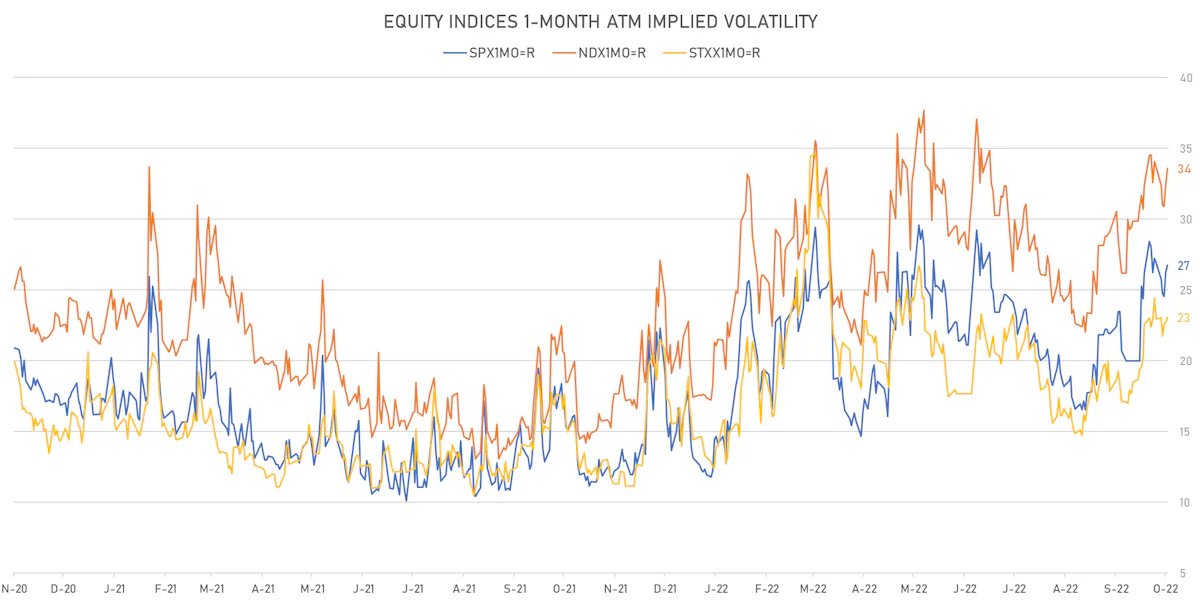
- 1-month at-the-money implied volatility on the S&P 500 at 26.8%, up from 26.3%
- 1-month at-the-money implied volatility on the STOXX Europe 600 at 23.9%, up from 23.7%
S&P 500 EARNINGS IN THE WEEK AHEAD
TOP S&P 500 PERFORMERS THIS WEEK
- Dexcom Inc (DXCM), up 26.8% to $102.14 / YTD price return: -23.9% / 12-Month Price Range: $ 66.94-164.63 / Short interest (% of float): 3.9%; days to cover: 6.2
- APA Corp (US) (APA), up 24.4% to $42.52 / YTD price return: +58.1% / 12-Month Price Range: $ 21.98-51.95 / Short interest (% of float): 3.0%; days to cover: 1.2
- Halliburton Co (HAL), up 23.5% to $30.41 / YTD price return: +33.0% / 12-Month Price Range: $ 20.78-43.99 / Short interest (% of float): 2.0%; days to cover: 2.0
- Devon Energy Corp (DVN), up 19.8% to $72.04 / YTD price return: +63.5% / 12-Month Price Range: $ 35.56-79.40 / Short interest (% of float): 2.7%; days to cover: 1.5
- PG&E Corp (PCG), up 19.4% to $14.93 / YTD price return: +23.0% / 12-Month Price Range: $ 9.64-15.07 / Short interest (% of float): 3.5%; days to cover: 5.7
- Schlumberger NV (SLB), up 18.6% to $42.59 / YTD price return: +42.2% / 12-Month Price Range: $ 27.66-49.83 / Short interest (% of float): 1.8%; days to cover: 2.4
- Diamondback Energy Inc (FANG), up 18.2% to $142.43 / YTD price return: +36.9% / 12-Month Price Range: $ 91.78-159.41 / Short interest (% of float): 4.4%; days to cover: 3.2
- Hess Corp (HES), up 17.6% to $128.20 / YTD price return: +73.2% / 12-Month Price Range: $ 68.37-131.42 / Short interest (% of float): 2.3%; days to cover: 4.1
- Wynn Resorts Ltd (WYNN), up 16.0% to $73.09 / YTD price return: -14.1% / 12-Month Price Range: $ 50.22-98.99 / Short interest (% of float): 5.6%; days to cover: 2.6
- Exxon Mobil Corp (XOM), up 15.8% to $101.03 / YTD price return: +65.2% / 12-Month Price Range: $ 57.96-105.57 / Short interest (% of float): 0.9%; days to cover: 2.1
BOTTOM S&P 500 PERFORMERS THIS WEEK
- Tesla Inc (TSLA), down 15.9% to $223.07 / YTD price return: -36.7% / 12-Month Price Range: $ 206.87-414.42 / Short interest (% of float): 2.4%; days to cover: 1.0
- Generac Holdings Inc (GNRC), down 13.4% to $154.26 / YTD price return: -56.2% / 12-Month Price Range: $ 154.26-522.66 / Short interest (% of float): 10.6%; days to cover: 7.3
- Solaredge Technologies Inc (SEDG), down 9.4% to $209.62 / YTD price return: -25.3% / 12-Month Price Range: $ 200.95-389.00 / Short interest (% of float): 3.4%; days to cover: 2.0
- American Tower Corp (AMT), down 9.3% to $194.63 / YTD price return: -33.5% / 12-Month Price Range: $ 194.63-294.31 / Short interest (% of float): 0.7%; days to cover: 2.5
- UDR Inc (UDR), down 8.8% to $38.04 / YTD price return: -36.6% / 12-Month Price Range: $ 38.04-61.05 / Short interest (% of float): 1.7%; days to cover: 3.3
- Essex Property Trust Inc (ESS), down 8.7% to $221.21 / YTD price return: -37.2% / 12-Month Price Range: $ 221.21-362.84 / Short interest (% of float): 1.5%; days to cover: 2.9
- Lumen Technologies Inc (LUMN), down 8.0% to $6.70 / YTD price return: -46.6% / 12-Month Price Range: $ 6.70-14.49 / Short interest (% of float): 15.7%; days to cover: 14.2
- Vornado Realty Trust (VNO), down 7.9% to $21.32 / YTD price return: -49.1% / 12-Month Price Range: $ 21.32-47.22 / Short interest (% of float): 9.4%; days to cover: 8.5
- SBA Communications Corp (SBAC), down 7.8% to $262.40 / YTD price return: -32.5% / 12-Month Price Range: $ 262.40-391.10 / Short interest (% of float): 1.1%; days to cover: 2.6
- Advanced Micro Devices Inc (AMD), down 7.8% to $58.44 / YTD price return: -59.4% / 12-Month Price Range: $ 58.44-164.44 / Short interest (% of float): 1.9%; days to cover: 0.4 (the stock is currently on the short sale restriction list)
VALUATION MULTIPLES BY SECTORS
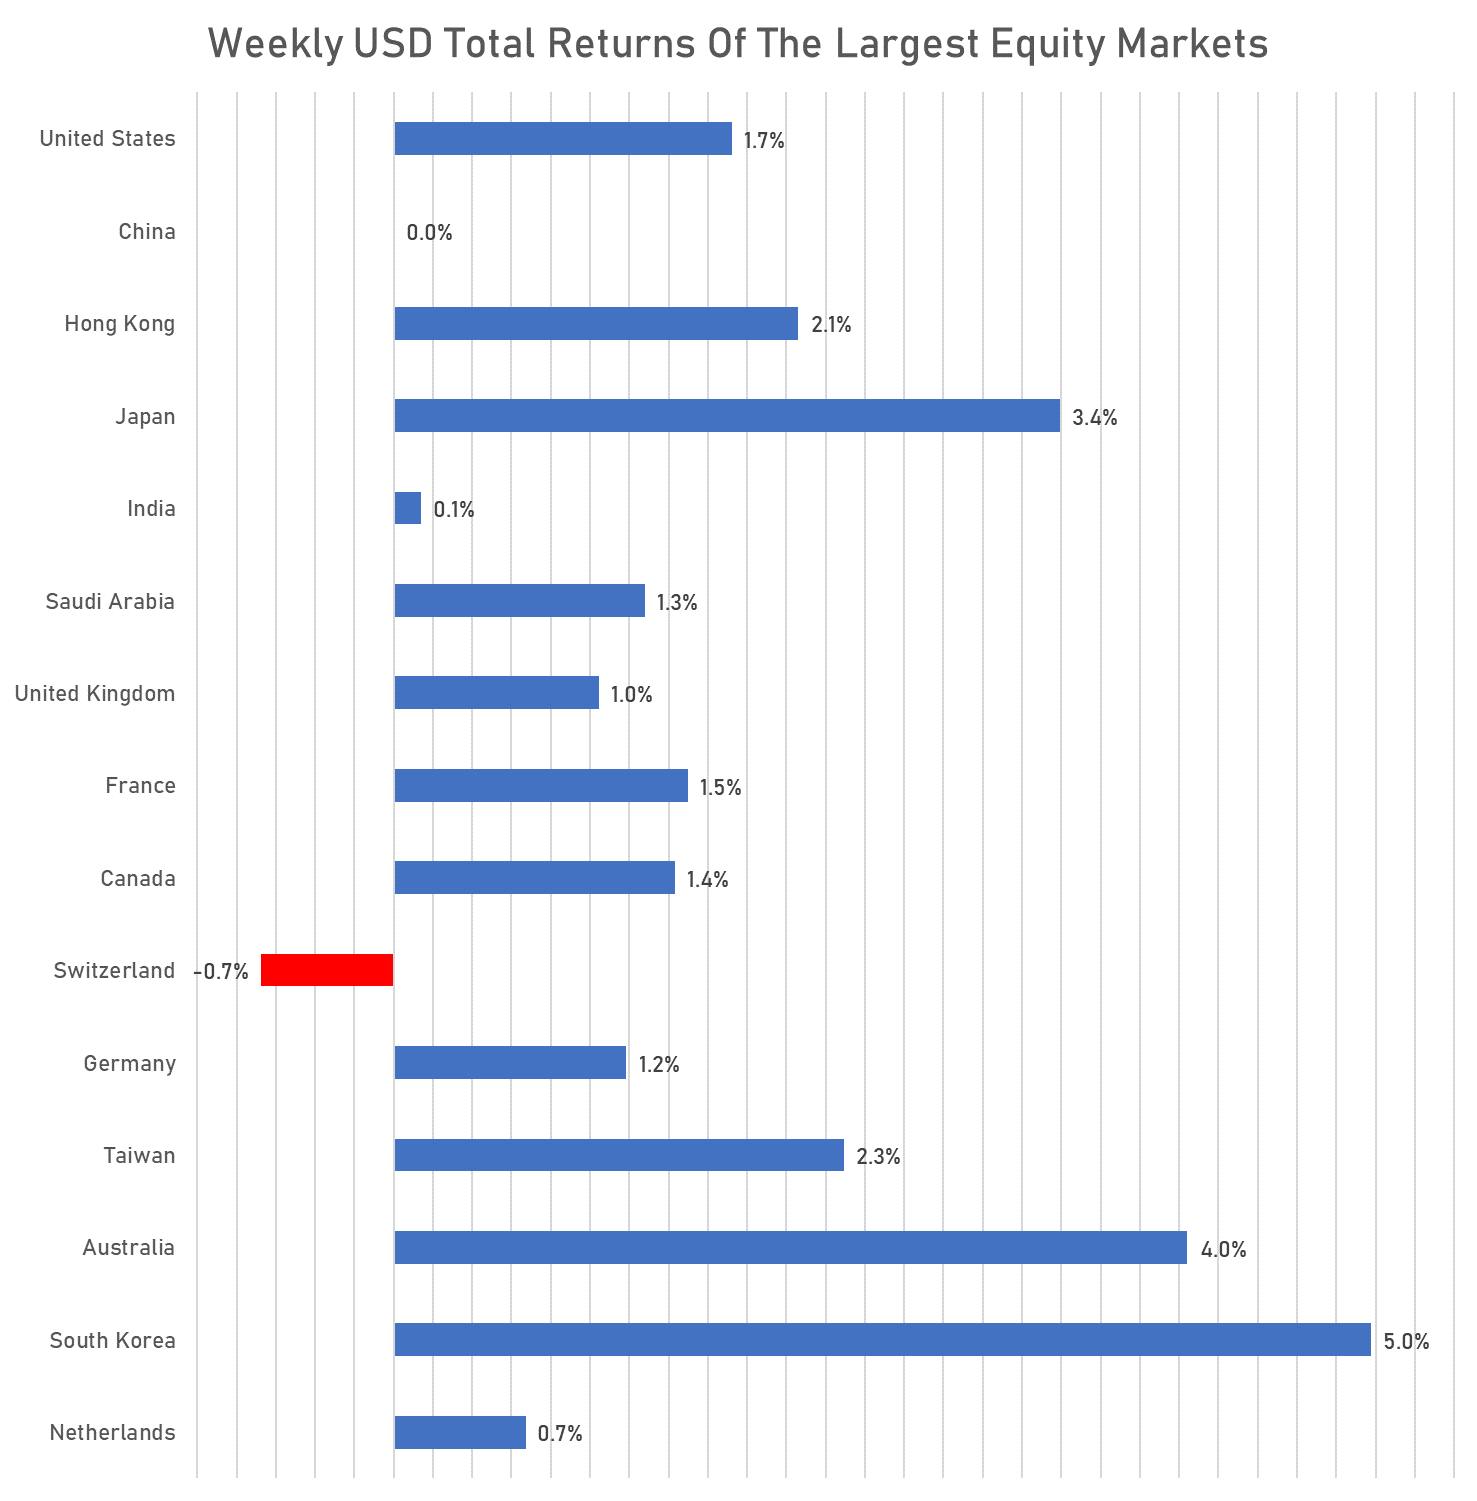
WEEKLY TOTAL RETURNS OF MAJOR GLOBAL EQUITY MARKETS
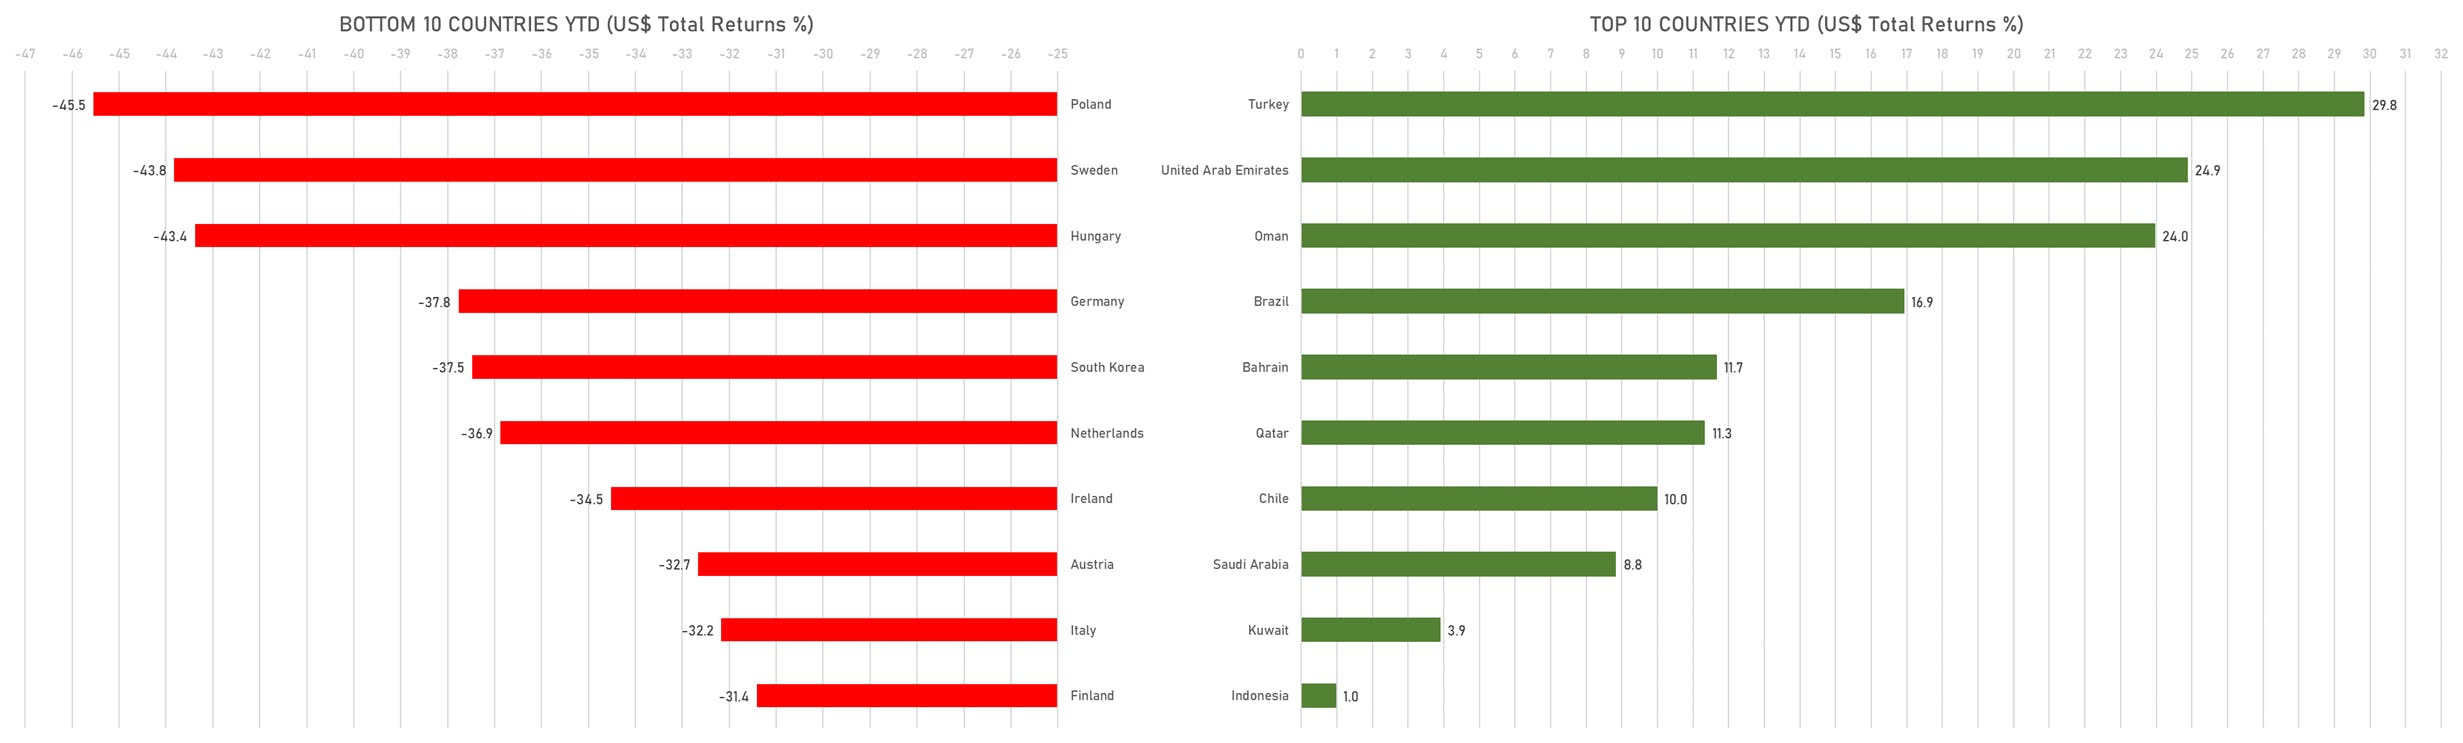
TOP / BOTTOM PERFORMING WORLD MARKETS YTD
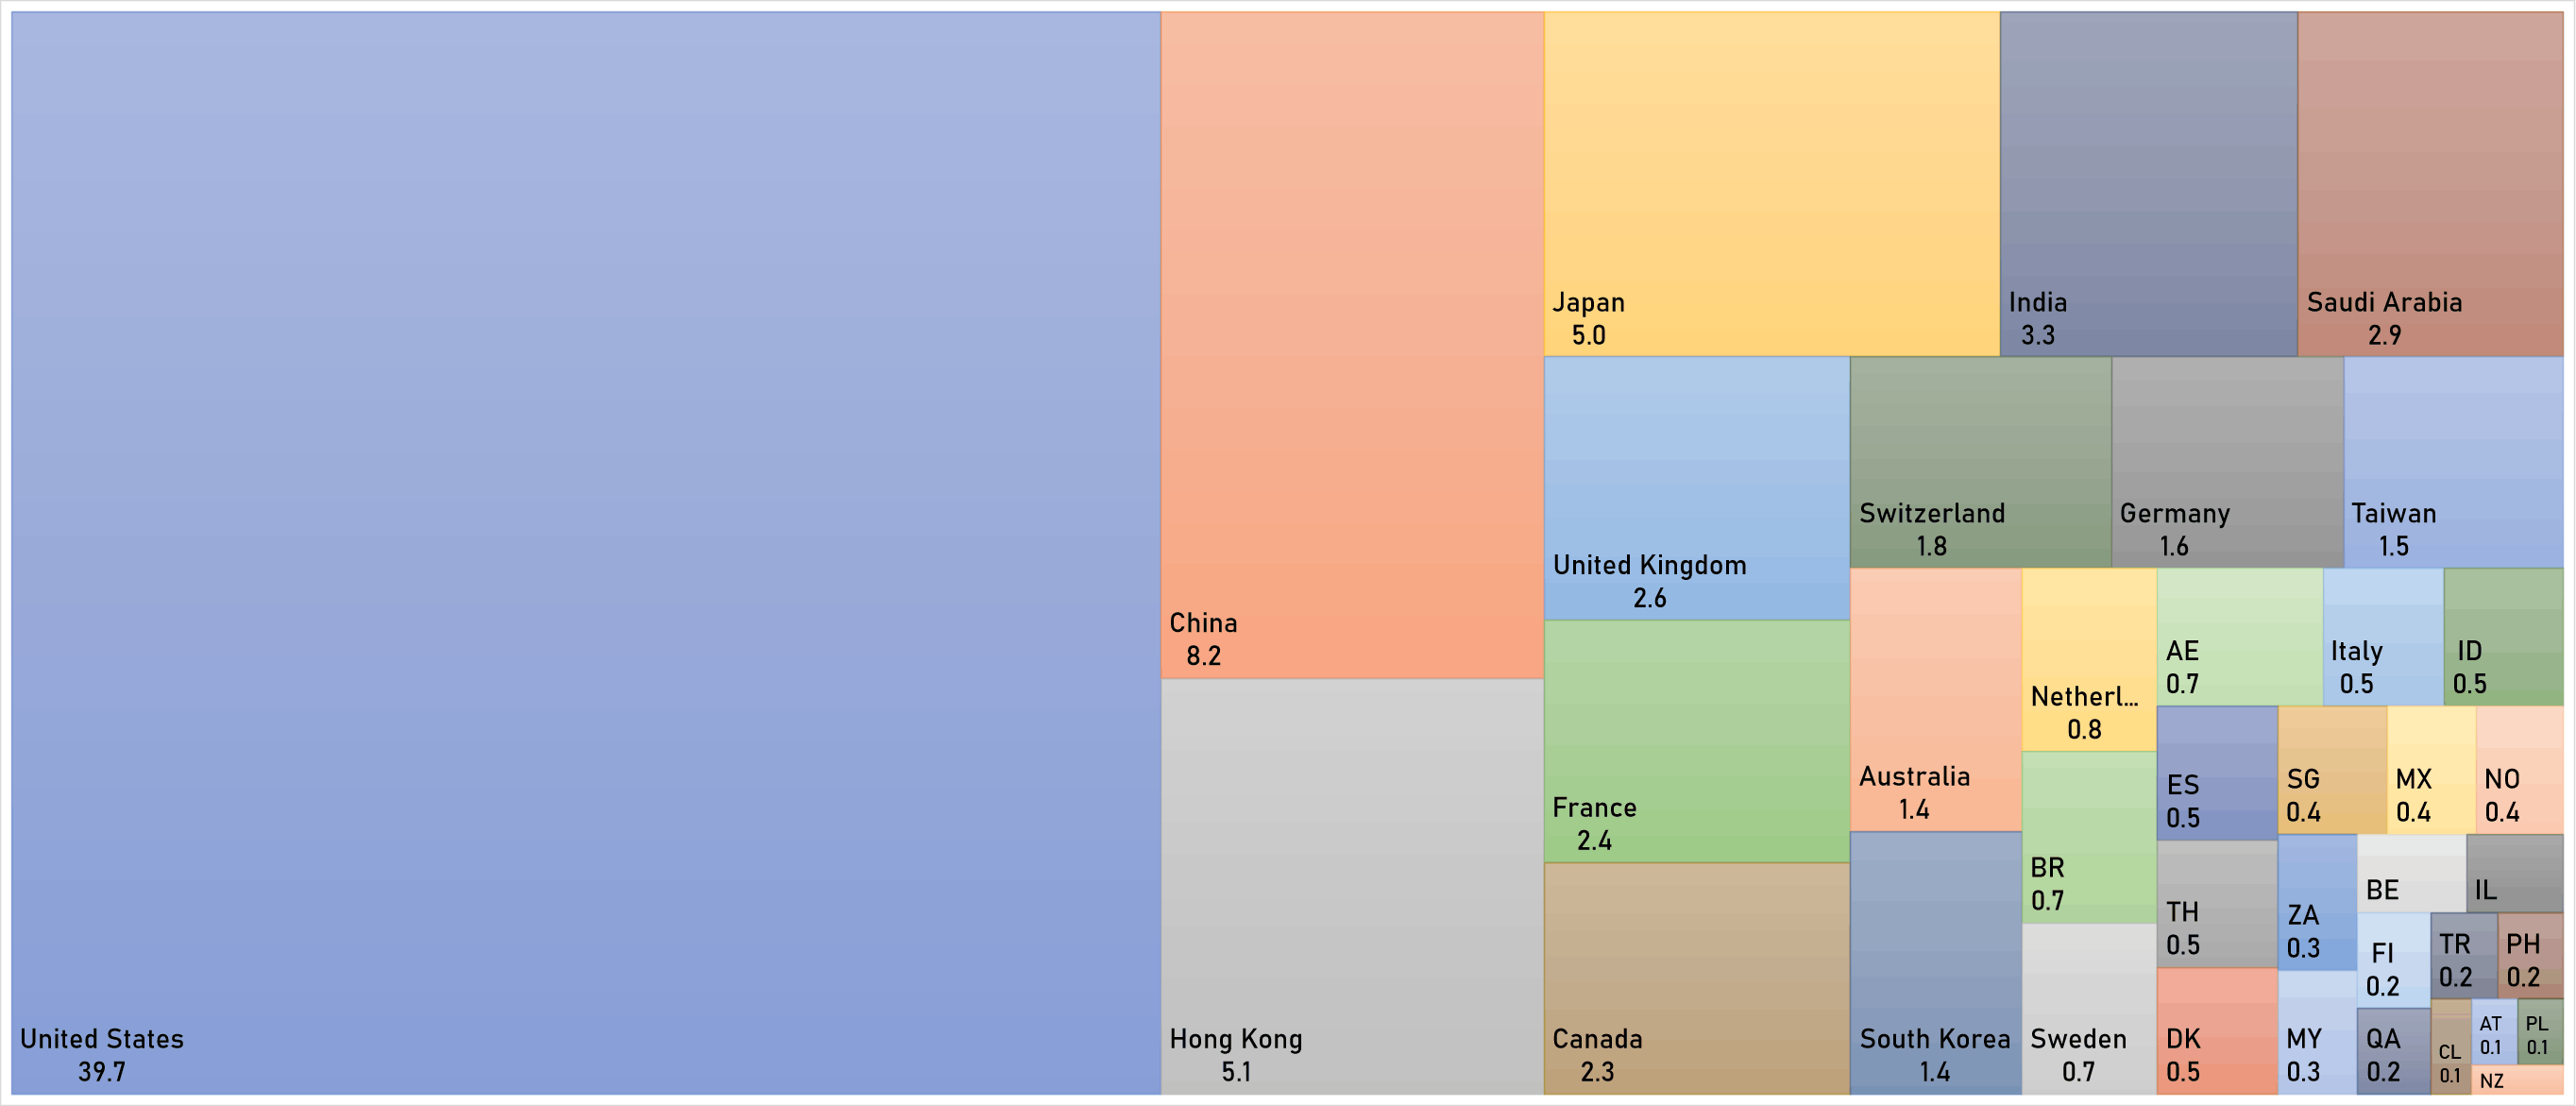
WORLD MARKET CAPITALIZATION (US$ Trillion)