Equities
Light Directional Positioning, Combined With A Lot Of Hedging, Drive Unintuitive Moves In US Equities This Week
The broad selloff today came with a drop in implied volatility, indicating that portfolio managers took advantage of lower prices to cash in on their hedges
Published ET
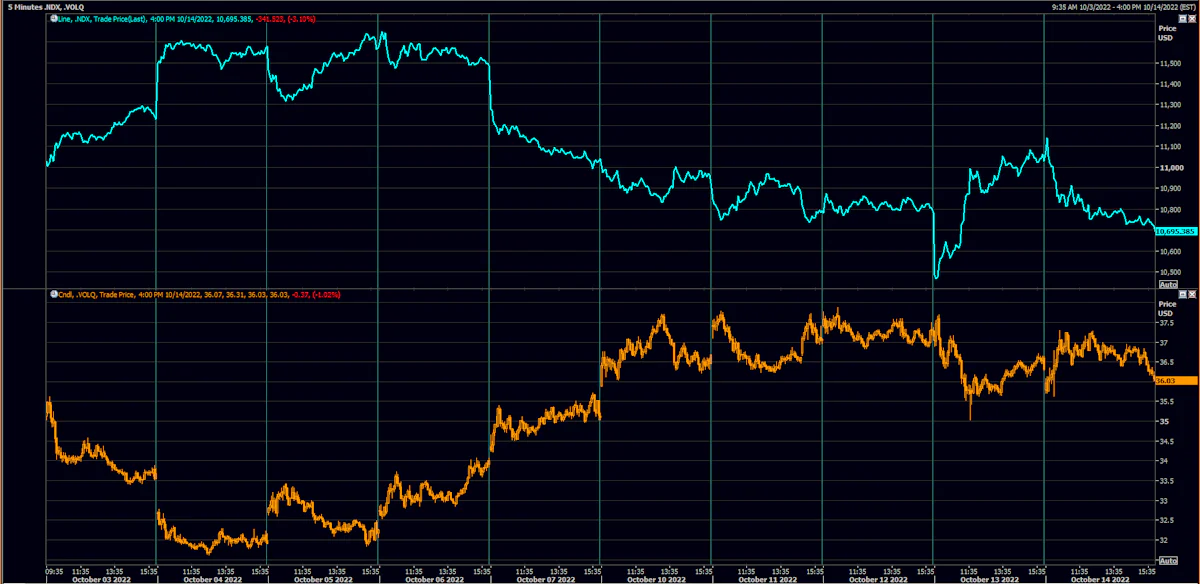
Nasdaq 100 Index and Nasdaq Implied Volatility Index | Source: Refinitiv
DAILY SUMMARY
- Daily performance of US indices: S&P 500 down -2.37%; Nasdaq Composite down -3.08%
- 6.0% of S&P 500 stocks were up today, with 14.3% of stocks above their 200-day moving average (DMA) and 10.9% above their 50-DMA
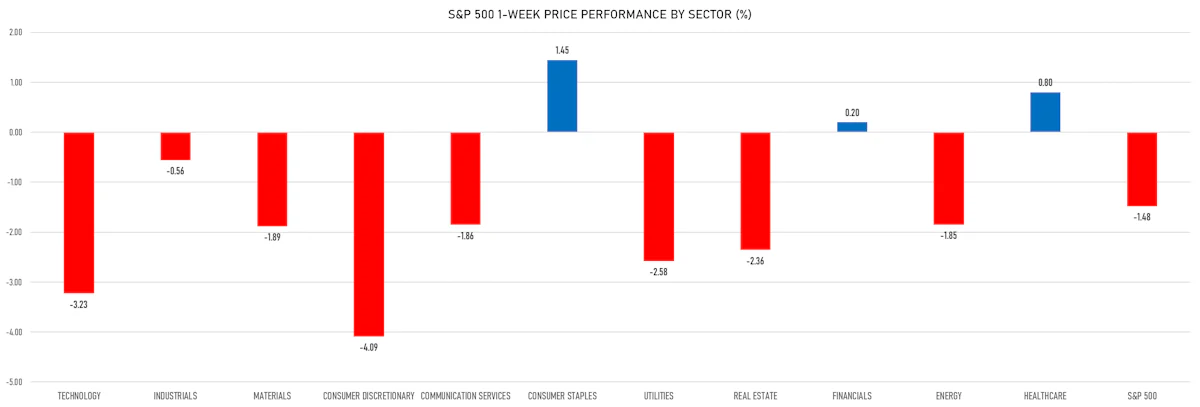
- Top performing sectors in the S&P 500: healthcare down -0.83% and utilities down -1.54%
- Bottom performing sectors in the S&P 500: consumer discretionary down -3.88% and energy down -3.71%
- The number of shares in the S&P 500 traded today was 736m for a total turnover of US$ 63 bn
- The S&P 500 Value Index was down -1.8%, while the S&P 500 Growth Index was down -3.0%; the S&P small caps index was down -2.1% and mid caps were down -1.9%
- The volume on CME's INX (S&P 500 Index) was 2666.7m (3-month z-score: 0.7); the 3-month average volume is 2351.4m and the 12-month range is 1340.2 - 4692.3m
- Daily performance of international indices: Europe Stoxx 600 up 0.56%; UK FTSE 100 up 0.12%; Hang Seng SH-SZ-HK 300 Index up 1.96%; Japan's TOPIX 500 up 2.37%
VOLATILITY TODAY
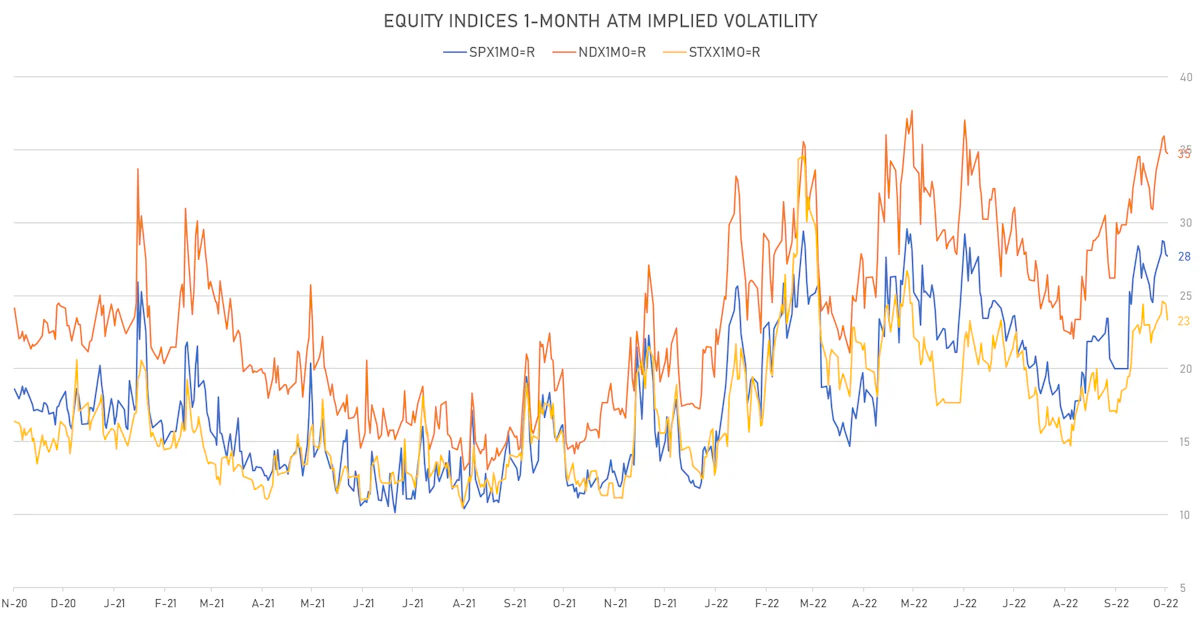
- 1-month at-the-money implied volatility on the S&P 500 at 27.7%, down from 27.8%
- 1-month at-the-money implied volatility on the STOXX Europe 600 at 23.5%, down from 24.3%
TOP S&P 500 PERFORMERS THIS WEEK
- Moderna Inc (MRNA), up 12.3% to $134.00 / YTD price return: -47.2% / 12-Month Price Range: $ 115.06-376.65 / Short interest (% of float): 4.5%; days to cover: 3.3
- Amgen Inc (AMGN), up 9.7% to $251.34 / YTD price return: +11.7% / 12-Month Price Range: $ 198.74-258.39 / Short interest (% of float): 3.2%; days to cover: 6.3
- Viatris Inc (VTRS), up 9.3% to $9.55 / YTD price return: -29.4% / 12-Month Price Range: $ 8.43-15.60 / Short interest (% of float): 2.4%; days to cover: 2.9
- Walgreens Boots Alliance Inc (WBA), up 8.9% to $33.24 / YTD price return: -36.3% / 12-Month Price Range: $ 30.39-54.96 / Short interest (% of float): 3.3%; days to cover: 3.3
- Campbell Soup Co (CPB), up 8.0% to $50.37 / YTD price return: +15.9% / 12-Month Price Range: $ 39.77-51.94 / Short interest (% of float): 6.9%; days to cover: 4.8
- American Airlines Group Inc (AAL), up 7.6% to $13.11 / YTD price return: -27.0% / 12-Month Price Range: $ 11.66-22.35 / Short interest (% of float): 13.4%; days to cover: 2.8
- US Bancorp (USB), up 6.4% to $42.76 / YTD price return: -23.9% / 12-Month Price Range: $ 38.39-63.57 / Short interest (% of float): 0.6%; days to cover: 1.2
- Delta Air Lines Inc (DAL), up 5.8% to $31.08 / YTD price return: -20.5% / 12-Month Price Range: $ 27.21-46.27 / Short interest (% of float): 2.7%; days to cover: 1.8
- 3M Co (MMM), up 5.7% to $113.63 / YTD price return: -36.0% / 12-Month Price Range: $ 107.09-186.26 / Short interest (% of float): 2.7%; days to cover: 0.9
- Altria Group Inc (MO), up 5.7% to $45.23 / YTD price return: -4.5% / 12-Month Price Range: $ 40.35-57.04 / Short interest (% of float): 1.0%; days to cover: 2.0
BOTTOM S&P 500 PERFORMERS THIS WEEK
- First Republic Bank (FRC), down 17.8% to $112.59 / YTD price return: -45.5% / 12-Month Price Range: $ 112.59-222.85 / Short interest (% of float): 1.5%; days to cover: 2.9 (the stock is currently on the short sale restriction list)
- Las Vegas Sands Corp (LVS), down 17.1% to $35.22 / YTD price return: -6.4% / 12-Month Price Range: $ 28.88-48.26 / Short interest (% of float): 4.6%; days to cover: 2.4
- ETSY Inc (ETSY), down 16.3% to $92.45 / YTD price return: -57.8% / 12-Month Price Range: $ 67.06-307.34 / Short interest (% of float): 9.2%; days to cover: 4.5
- KLA Corp (KLAC), down 16.1% to $263.70 / YTD price return: -38.7% / 12-Month Price Range: $ 250.74-456.98 / Short interest (% of float): 2.1%; days to cover: 1.8
- ServiceNow Inc (NOW), down 14.8% to $341.76 / YTD price return: -47.3% / 12-Month Price Range: $ 337.22-707.31 / Short interest (% of float): 1.6%; days to cover: 2.3
- Monolithic Power Systems Inc (MPWR), down 14.7% to $309.20 / YTD price return: -37.3% / 12-Month Price Range: $ 303.30-579.19 / Short interest (% of float): 4.4%; days to cover: 3.2
- Match Group Inc (MTCH), down 14.1% to $41.46 / YTD price return: -68.7% / 12-Month Price Range: $ 41.46-181.99 / Short interest (% of float): 3.8%; days to cover: 3.3
- Arista Networks Inc (ANET), down 13.8% to $100.37 / YTD price return: -30.2% / 12-Month Price Range: $ 89.13-148.49 / Short interest (% of float): 1.9%; days to cover: 2.4
- Ceridian HCM Holding Inc (CDAY), down 13.1% to $51.85 / YTD price return: -50.4% / 12-Month Price Range: $ 43.23-130.35 / Short interest (% of float): 6.4%; days to cover: 8.9
- Albemarle Corp (ALB), down 12.9% to $237.47 / YTD price return: +1.6% / 12-Month Price Range: $ 169.95-308.17 / Short interest (% of float): 2.1%; days to cover: 1.9
S&P 500 EARNINGS TRACKER
![]()
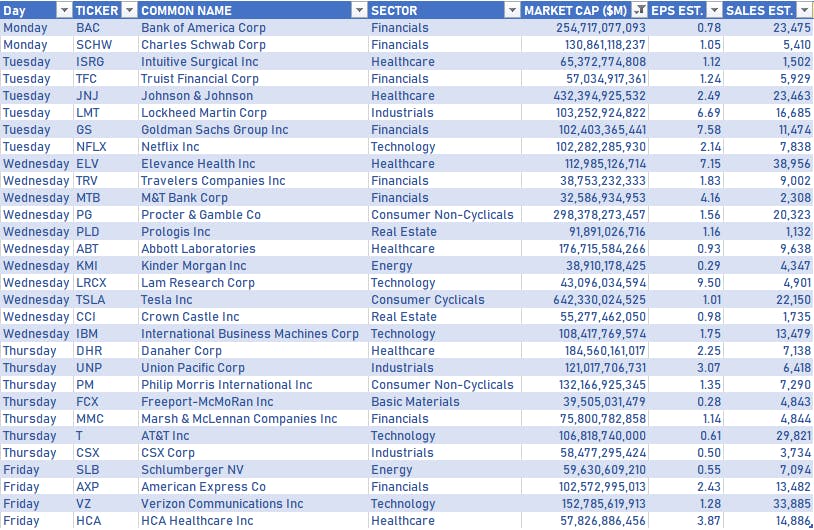
MAJOR COMPANIES REPORTING IN THE WEEK AHEAD
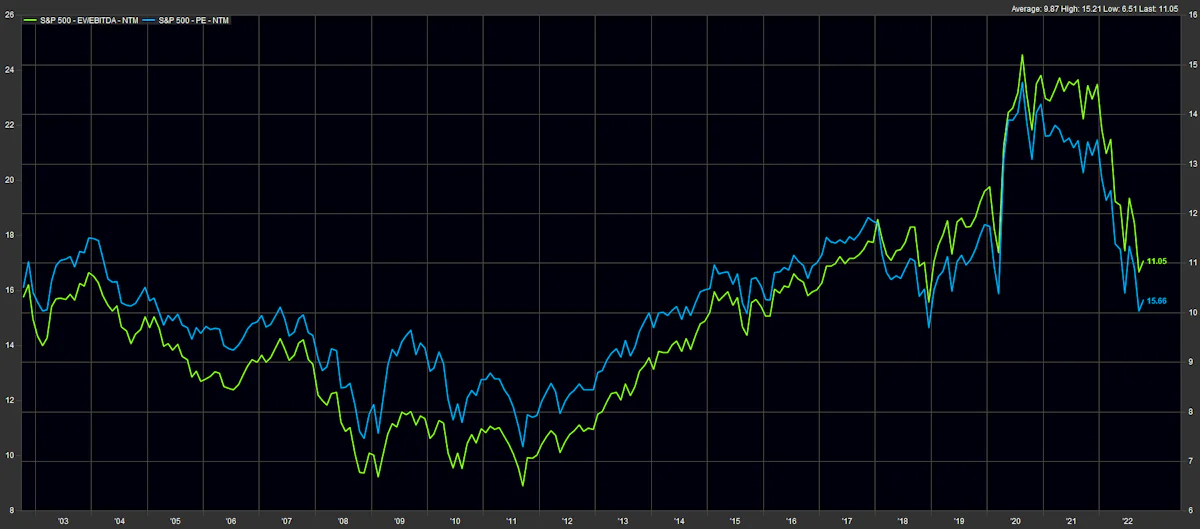
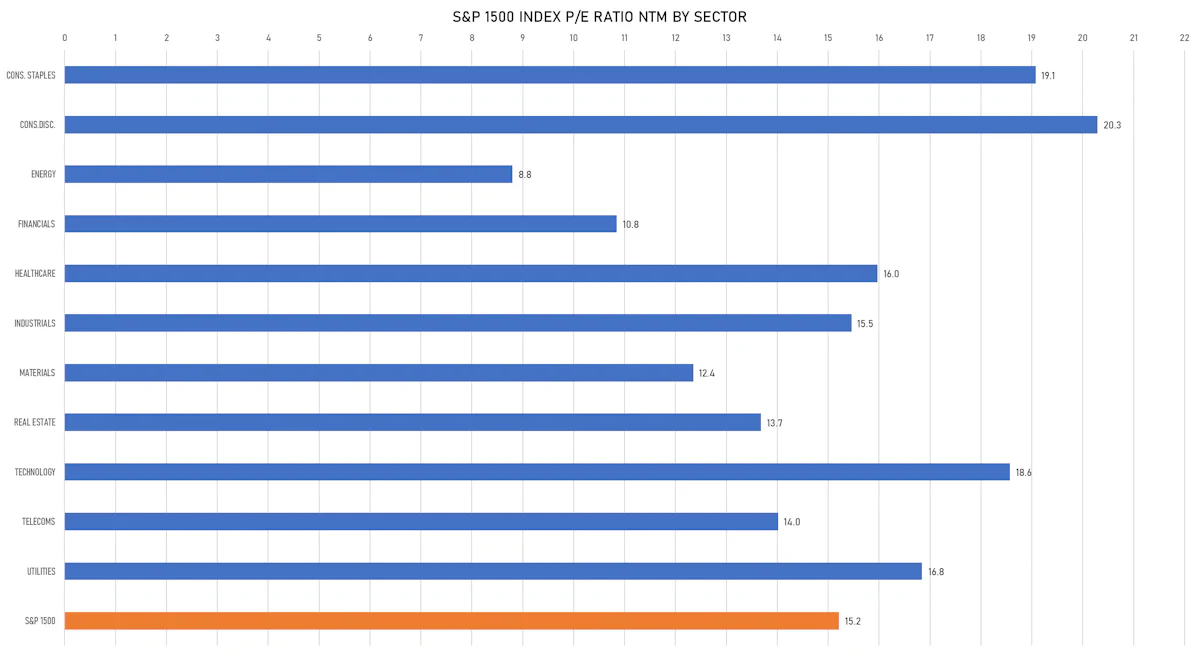
VALUATION MULTIPLES BY SECTORS
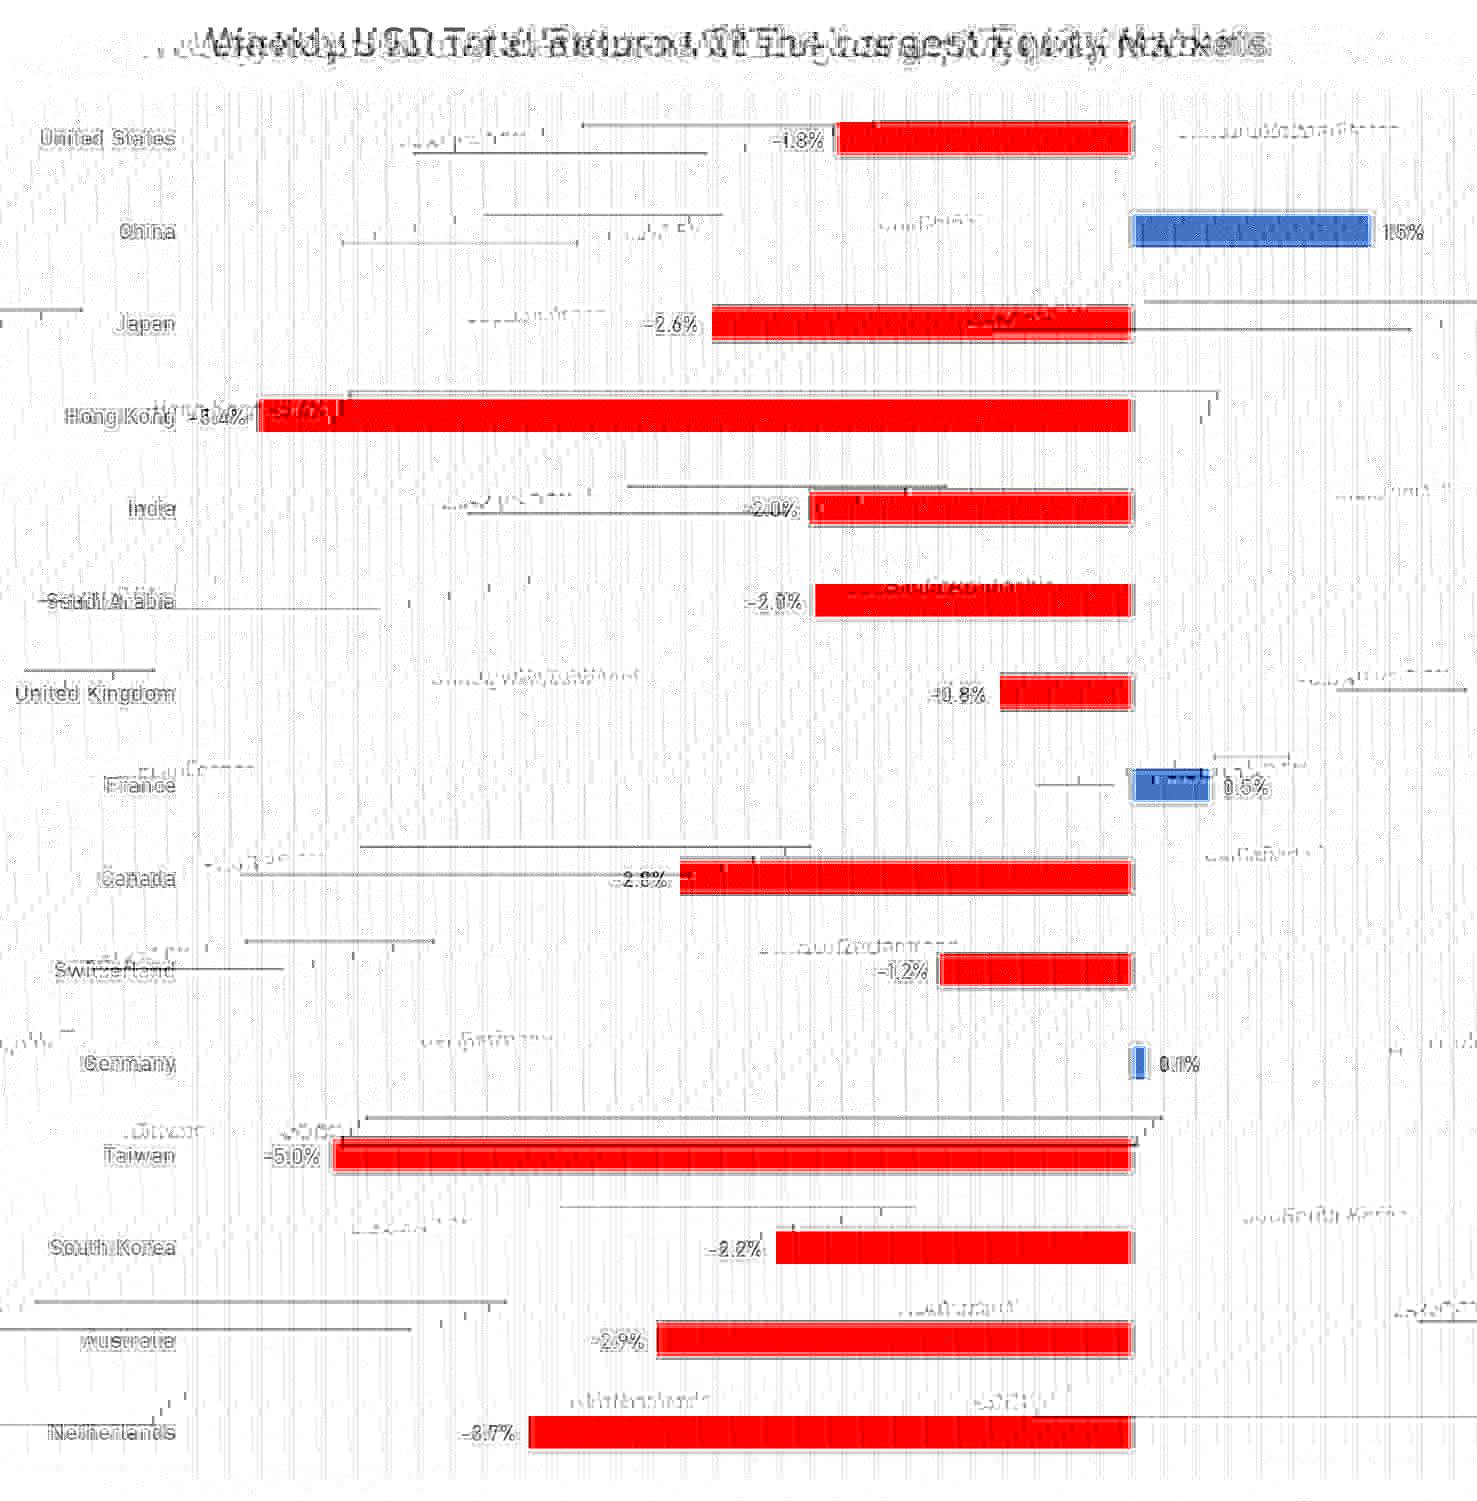
WEEKLY TOTAL RETURNS OF MAJOR GLOBAL EQUITY MARKETS
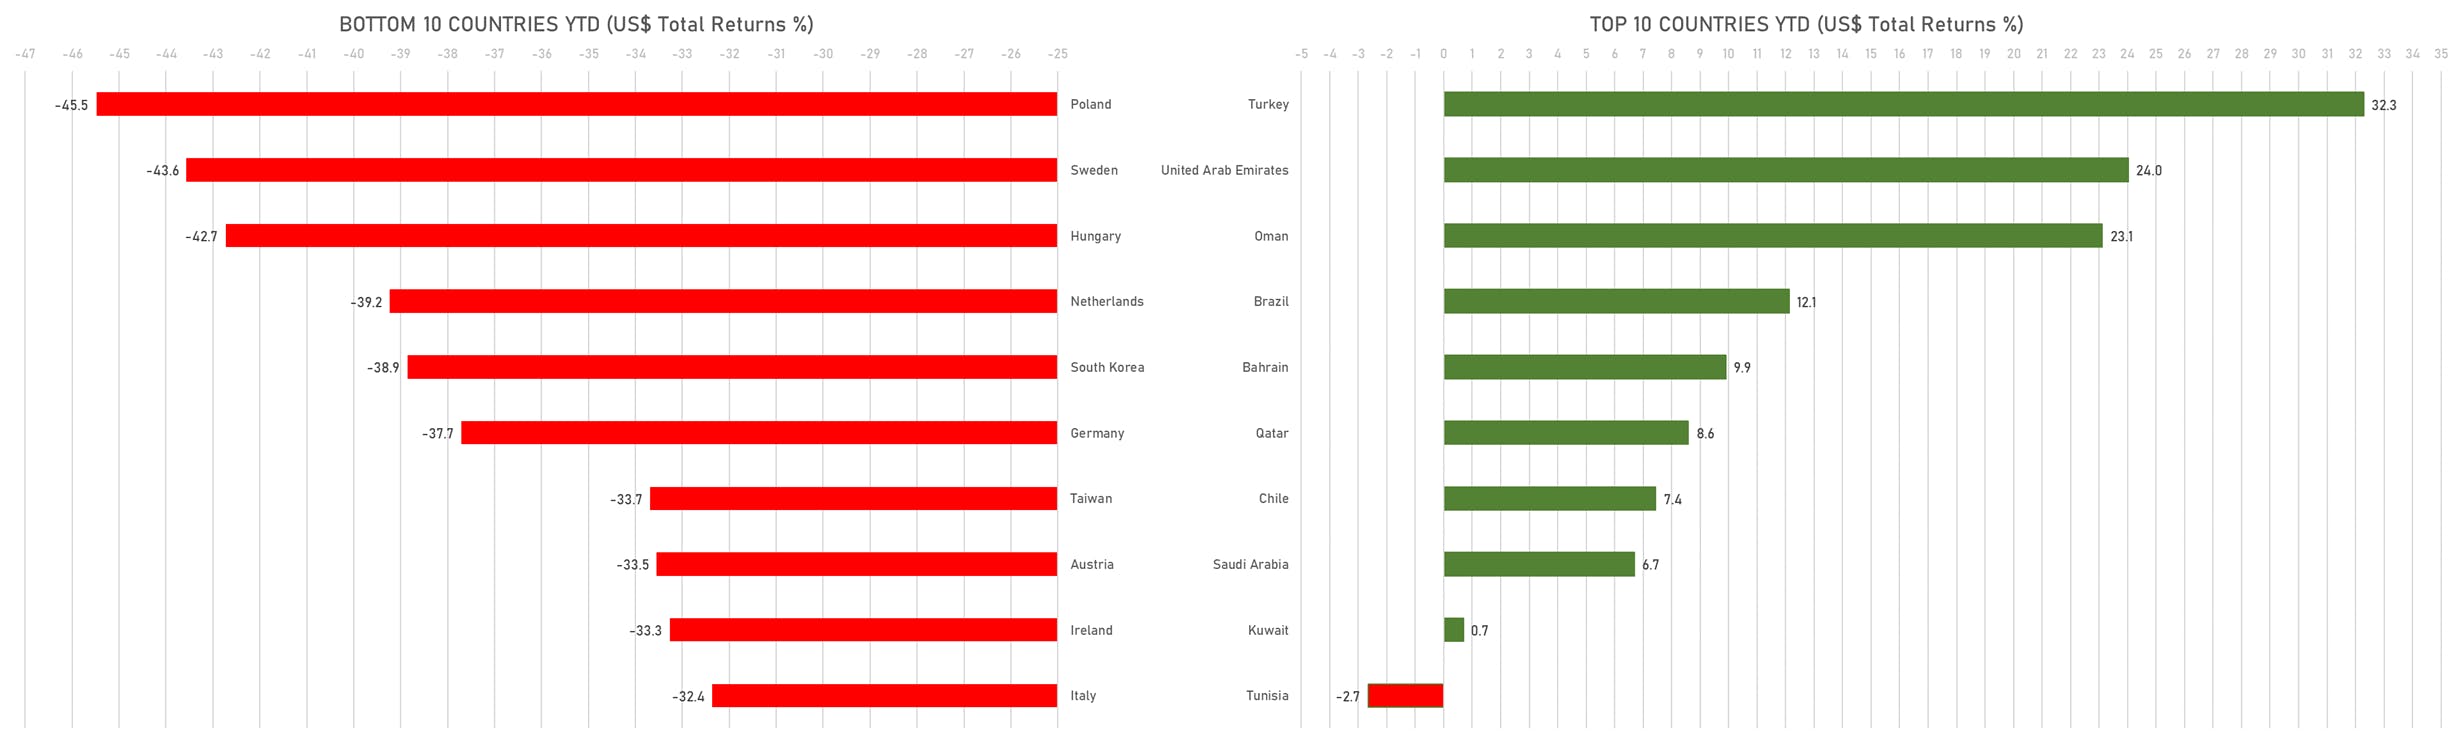
TOP / BOTTOM PERFORMING WORLD MARKETS YTD
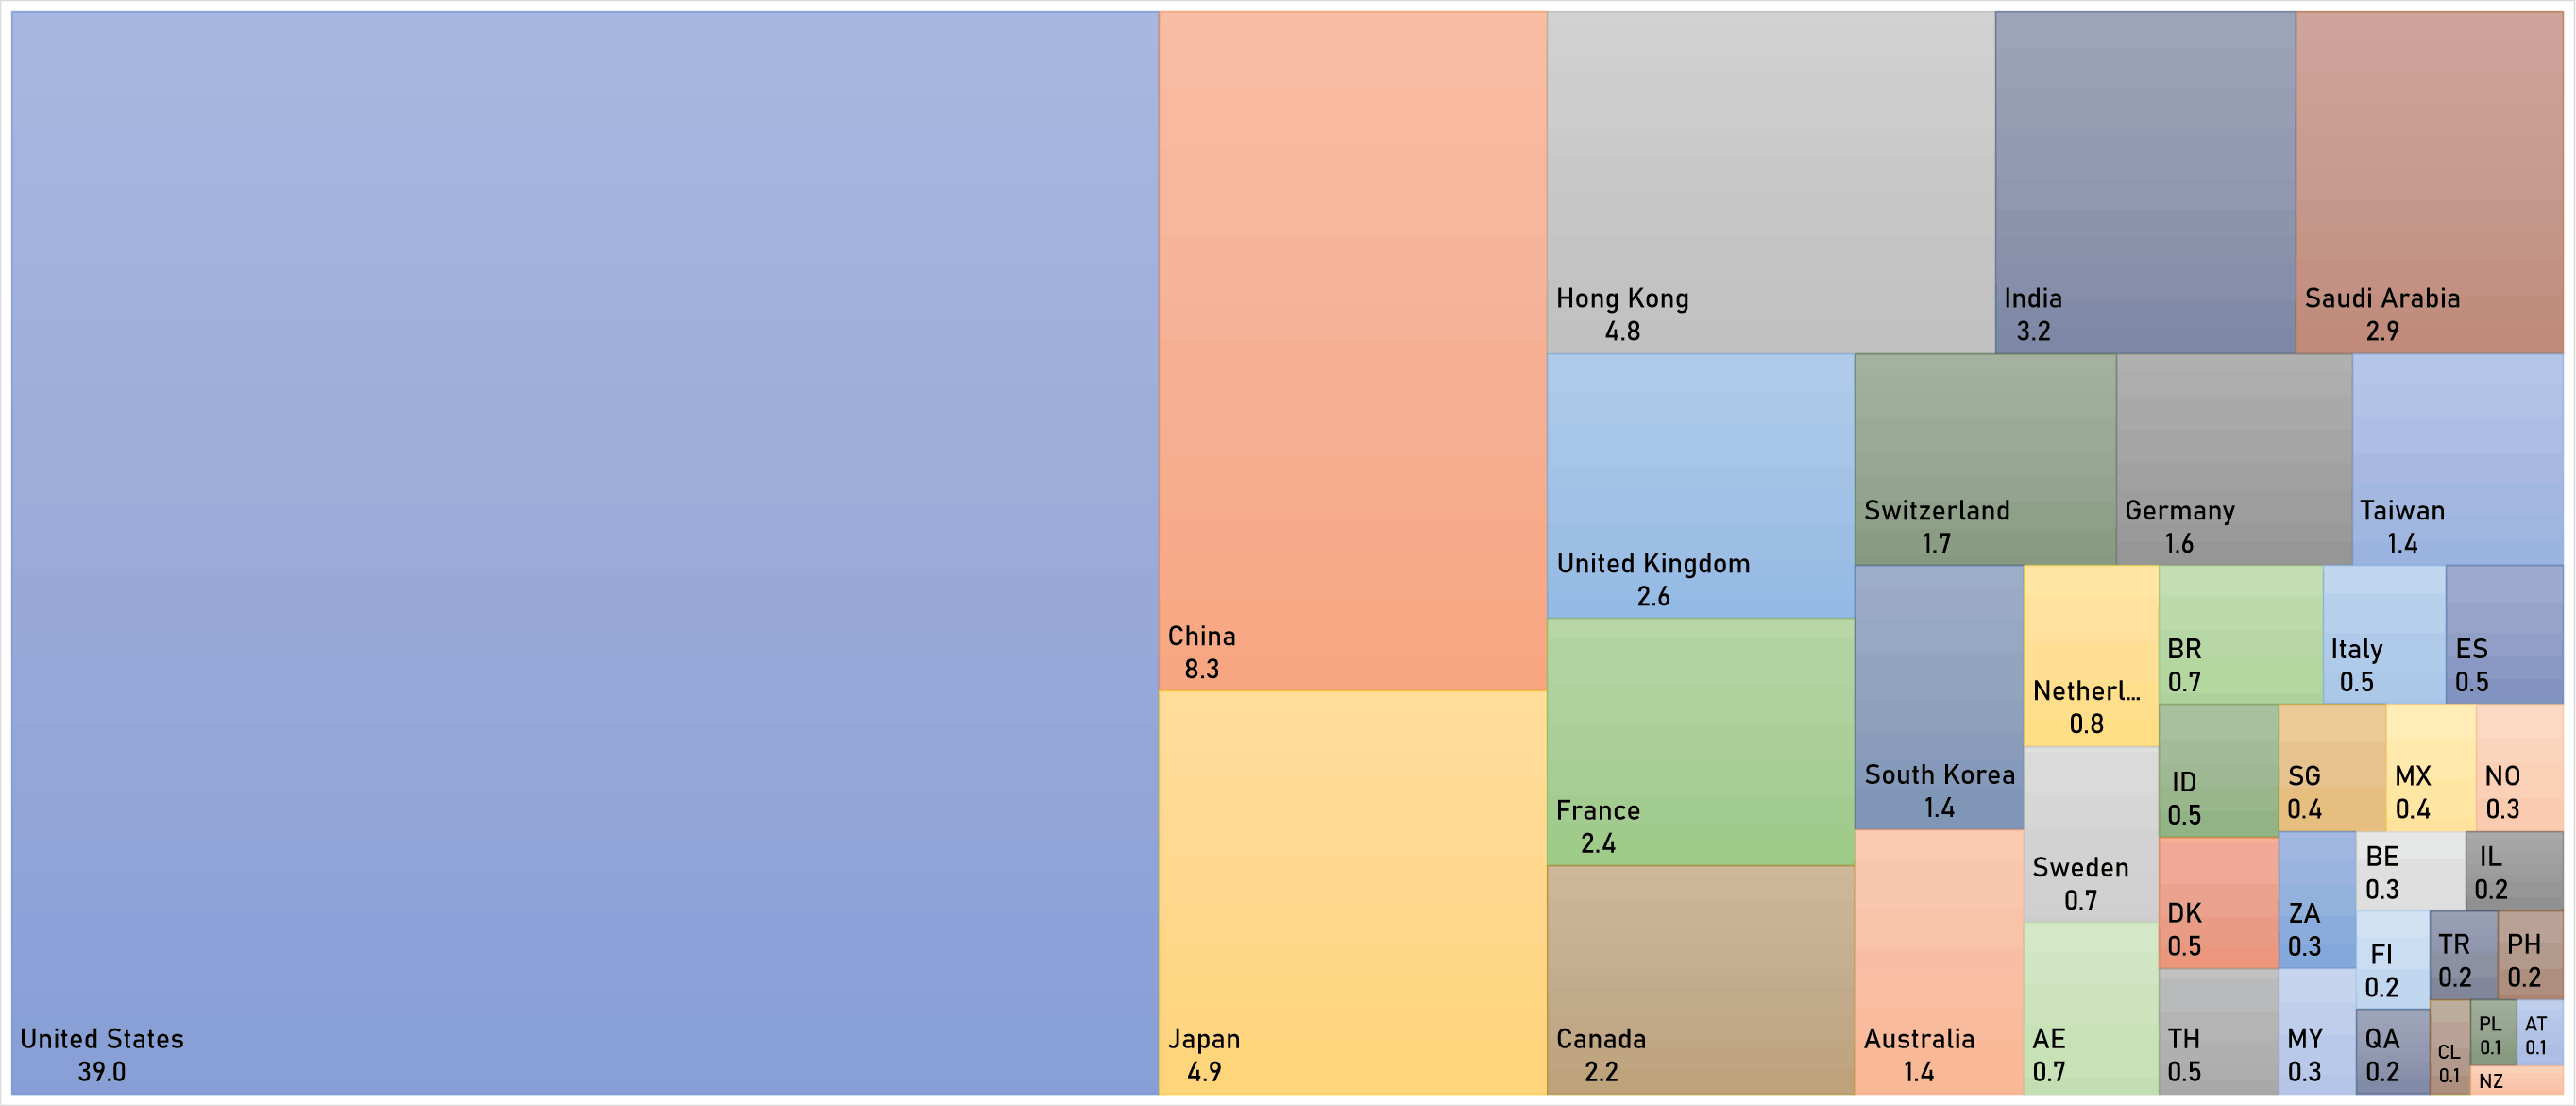
WORLD MARKET CAPITALIZATION (US$ Trillion)