Equities
Broad Rise In Global Equities This Week, With China + HK Still The Most Visible Laggards
As the equity risk premium continues to look too skinny against the rise of real yields, Goldman strategists see the S&P 500 trough around 3,150 in a hard-landing scenario (down 16% from where we stand at pixel time)
Published ET
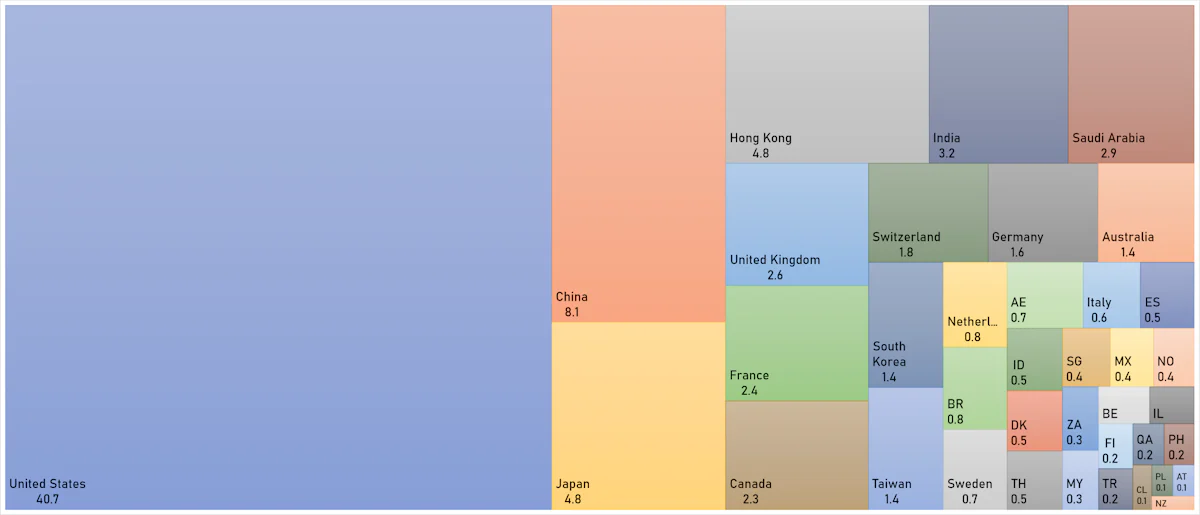
World Market Cap Now At US$89 Trillion, Down From $120tn Last Year | Sources: ϕpost, FactSet data
DAILY SUMMARY
- Daily performance of US indices: S&P 500 up 2.37%; Nasdaq Composite up 2.31%
- 93.6% of S&P 500 stocks were up today, with 21.9% of stocks above their 200-day moving average (DMA) and 28.6% above their 50-DMA
- Top performing sectors in the S&P 500: materials up 3.46% and consumer discretionary up 2.92%
- Bottom performing sectors in the S&P 500: real estate up 0.68% and communication services up 0.85%
- The number of shares in the S&P 500 traded today was 902m for a total turnover of US$ 80 bn
- The S&P 500 Value Index was up 2.3%, while the S&P 500 Growth Index was up 2.5%; the S&P small caps index was up 2.3% and mid caps were up 2.1%
- The volume on CME's INX (S&P 500 Index) was 3,006.1m (3-month z-score: 1.4); the 3-month average volume is 2,377.1m and the 12-month range is 1340.2 - 4,692.3m
- Daily performance of international indices: Europe Stoxx 600 down -0.62%; UK FTSE 100 up 0.37%; Hang Seng SH-SZ-HK 300 Index down -0.36%; Japan's TOPIX 500 down -0.72%
VOLATILITY TODAY
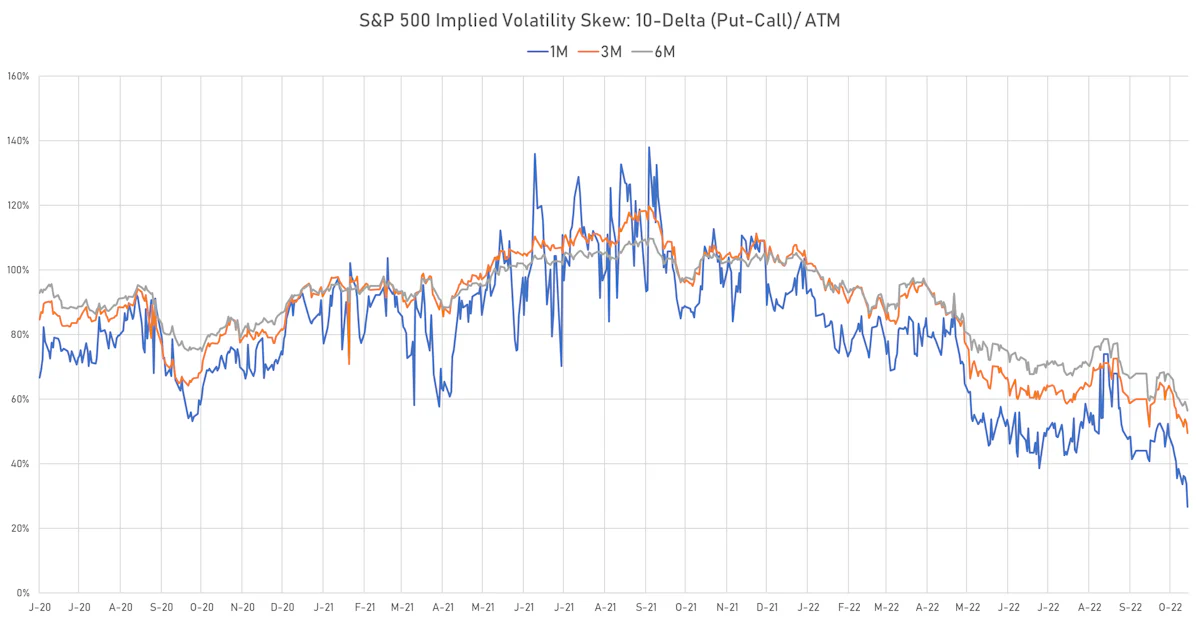
- 1-month at-the-money implied volatility on the S&P 500 unchanged at 26.9%
- 1-month at-the-money implied volatility on the STOXX Europe 600 at 21.3%, up from 20.9%
TOP S&P 500 PERFORMERS THIS WEEK
- Netflix Inc (NFLX), up 25.9% to $289.57 / YTD price return: -51.9% / 12-Month Price Range: $ 162.81-700.50 / Short interest (% of float): 2.5%; days to cover: 1.1
- Schlumberger NV (SLB), up 19.6% to $50.41 / YTD price return: +68.3% / 12-Month Price Range: $ 27.66-50.41 / Short interest (% of float): 2.0%; days to cover: 2.4
- Intuitive Surgical Inc (ISRG), up 19.4% to $218.49 / YTD price return: -39.2% / 12-Month Price Range: $ 180.34-369.69 / Short interest (% of float): 1.0%; days to cover: 2.0
- Lam Research Corp (LRCX), up 17.3% to $369.29 / YTD price return: -48.6% / 12-Month Price Range: $ 299.63-731.47 / Short interest (% of float): 1.6%; days to cover: 1.7
- Lockheed Martin Corp (LMT), up 16.7% to $454.61 / YTD price return: +27.9% / 12-Month Price Range: $ 324.50-479.97 / Short interest (% of float): 0.9%; days to cover: 2.1
- Baker Hughes Co (BKR), up 16.4% to $26.67 / YTD price return: +10.8% / 12-Month Price Range: $ 20.42-39.78 / Short interest (% of float): 3.9%; days to cover: 3.8
- Freeport-McMoRan Inc (FCX), up 15.9% to $32.03 / YTD price return: -23.2% / 12-Month Price Range: $ 24.81-51.99 / Short interest (% of float): 2.1%; days to cover: 1.7
- Halliburton Co (HAL), up 15.2% to $33.88 / YTD price return: +48.1% / 12-Month Price Range: $ 20.78-43.99 / Short interest (% of float): 2.1%; days to cover: 1.9
- Carnival Corp (CCL), up 15.0% to $8.20 / YTD price return: -59.2% / 12-Month Price Range: $ 6.12-25.29 / Short interest (% of float): 10.5%; days to cover: 2.0
- Norwegian Cruise Line Holdings Ltd (NCLH), up 14.6% to $14.93 / YTD price return: -28.0% / 12-Month Price Range: $ 10.31-29.44 / Short interest (% of float): 8.7%; days to cover: 1.8
BOTTOM S&P 500 PERFORMERS THIS WEEK
- SVB Financial Group (SIVB), down 27.6% to $230.03 / YTD price return: -66.1% / 12-Month Price Range: $ 230.03-763.22 / Short interest (% of float): 4.2%; days to cover: 4.8 (the stock is currently on the short sale restriction list)
- Generac Holdings Inc (GNRC), down 20.1% to $109.48 / YTD price return: -68.9% / 12-Month Price Range: $ 106.09-522.66 / Short interest (% of float): 8.8%; days to cover: 3.8
- M&T Bank Corp (MTB), down 12.8% to $161.77 / YTD price return: +5.3% / 12-Month Price Range: $ 141.62-193.42 / Short interest (% of float): 1.6%; days to cover: 2.9
- Comerica Inc (CMA), down 9.4% to $65.34 / YTD price return: -24.9% / 12-Month Price Range: $ 64.45-102.05 / Short interest (% of float): 2.7%; days to cover: 3.0
- Allstate Corp (ALL), down 9.3% to $120.08 / YTD price return: +2.1% / 12-Month Price Range: $ 106.12-144.46 / Short interest (% of float): 1.9%; days to cover: 3.0 (the stock is currently on the short sale restriction list)
- EQT Corp (EQT), down 7.9% to $37.88 / YTD price return: +73.7% / 12-Month Price Range: $ 17.97-51.95 / Short interest (% of float): 6.8%; days to cover: 2.3
- Carmax Inc (KMX), down 7.5% to $55.69 / YTD price return: -57.2% / 12-Month Price Range: $ 55.69-155.97 / Short interest (% of float): 8.2%; days to cover: 6.3
- Fox Corp (FOXA), down 6.7% to $29.43 / YTD price return: -20.2% / 12-Month Price Range: $ 28.28-44.94 / Short interest (% of float): 3.5%; days to cover: 4.2
- Catalent Inc (CTLT), down 6.2% to $67.63 / YTD price return: -47.2% / 12-Month Price Range: $ 67.63-140.11 / Short interest (% of float): 2.3%; days to cover: 2.6
- West Pharmaceutical Services Inc (WST), down 5.9% to $232.88 / YTD price return: -50.3% / 12-Month Price Range: $ 230.95-473.91 / Short interest (% of float): 1.3%; days to cover: 2.3
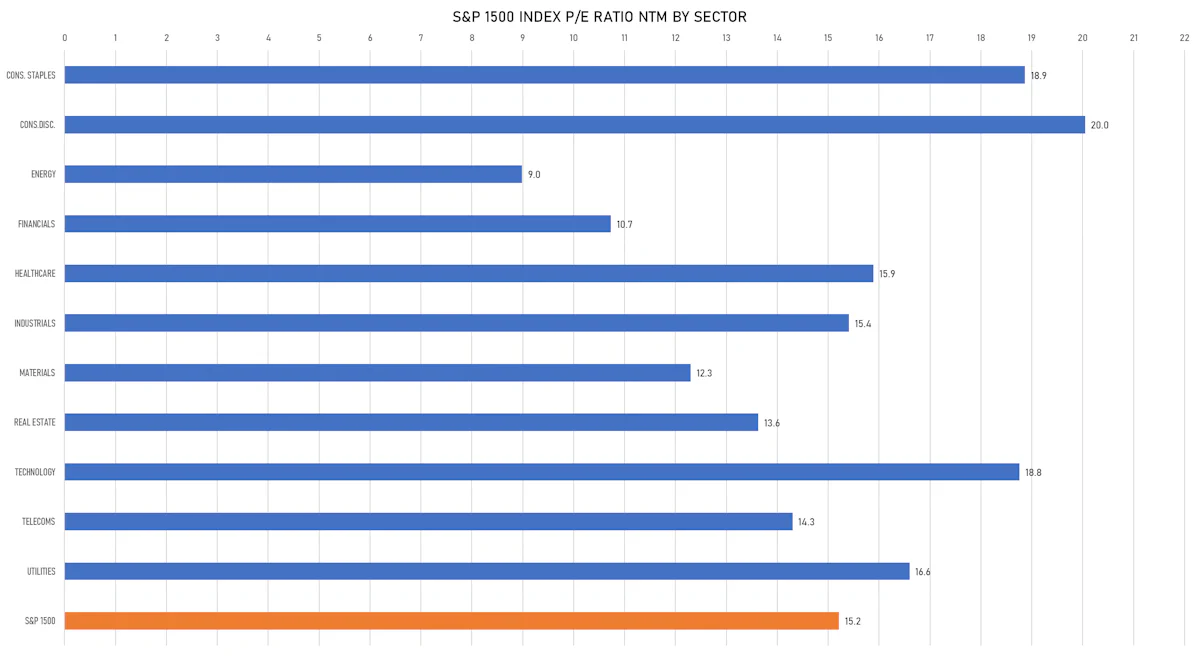
VALUATION MULTIPLES BY SECTORS
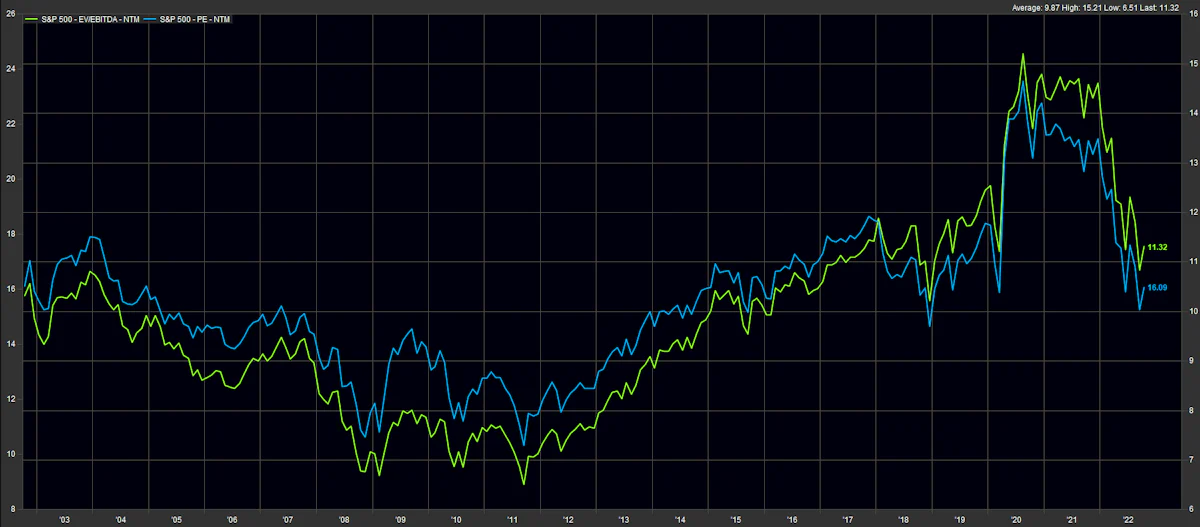
S&P 500 EARNINGS TRACKER
![]()
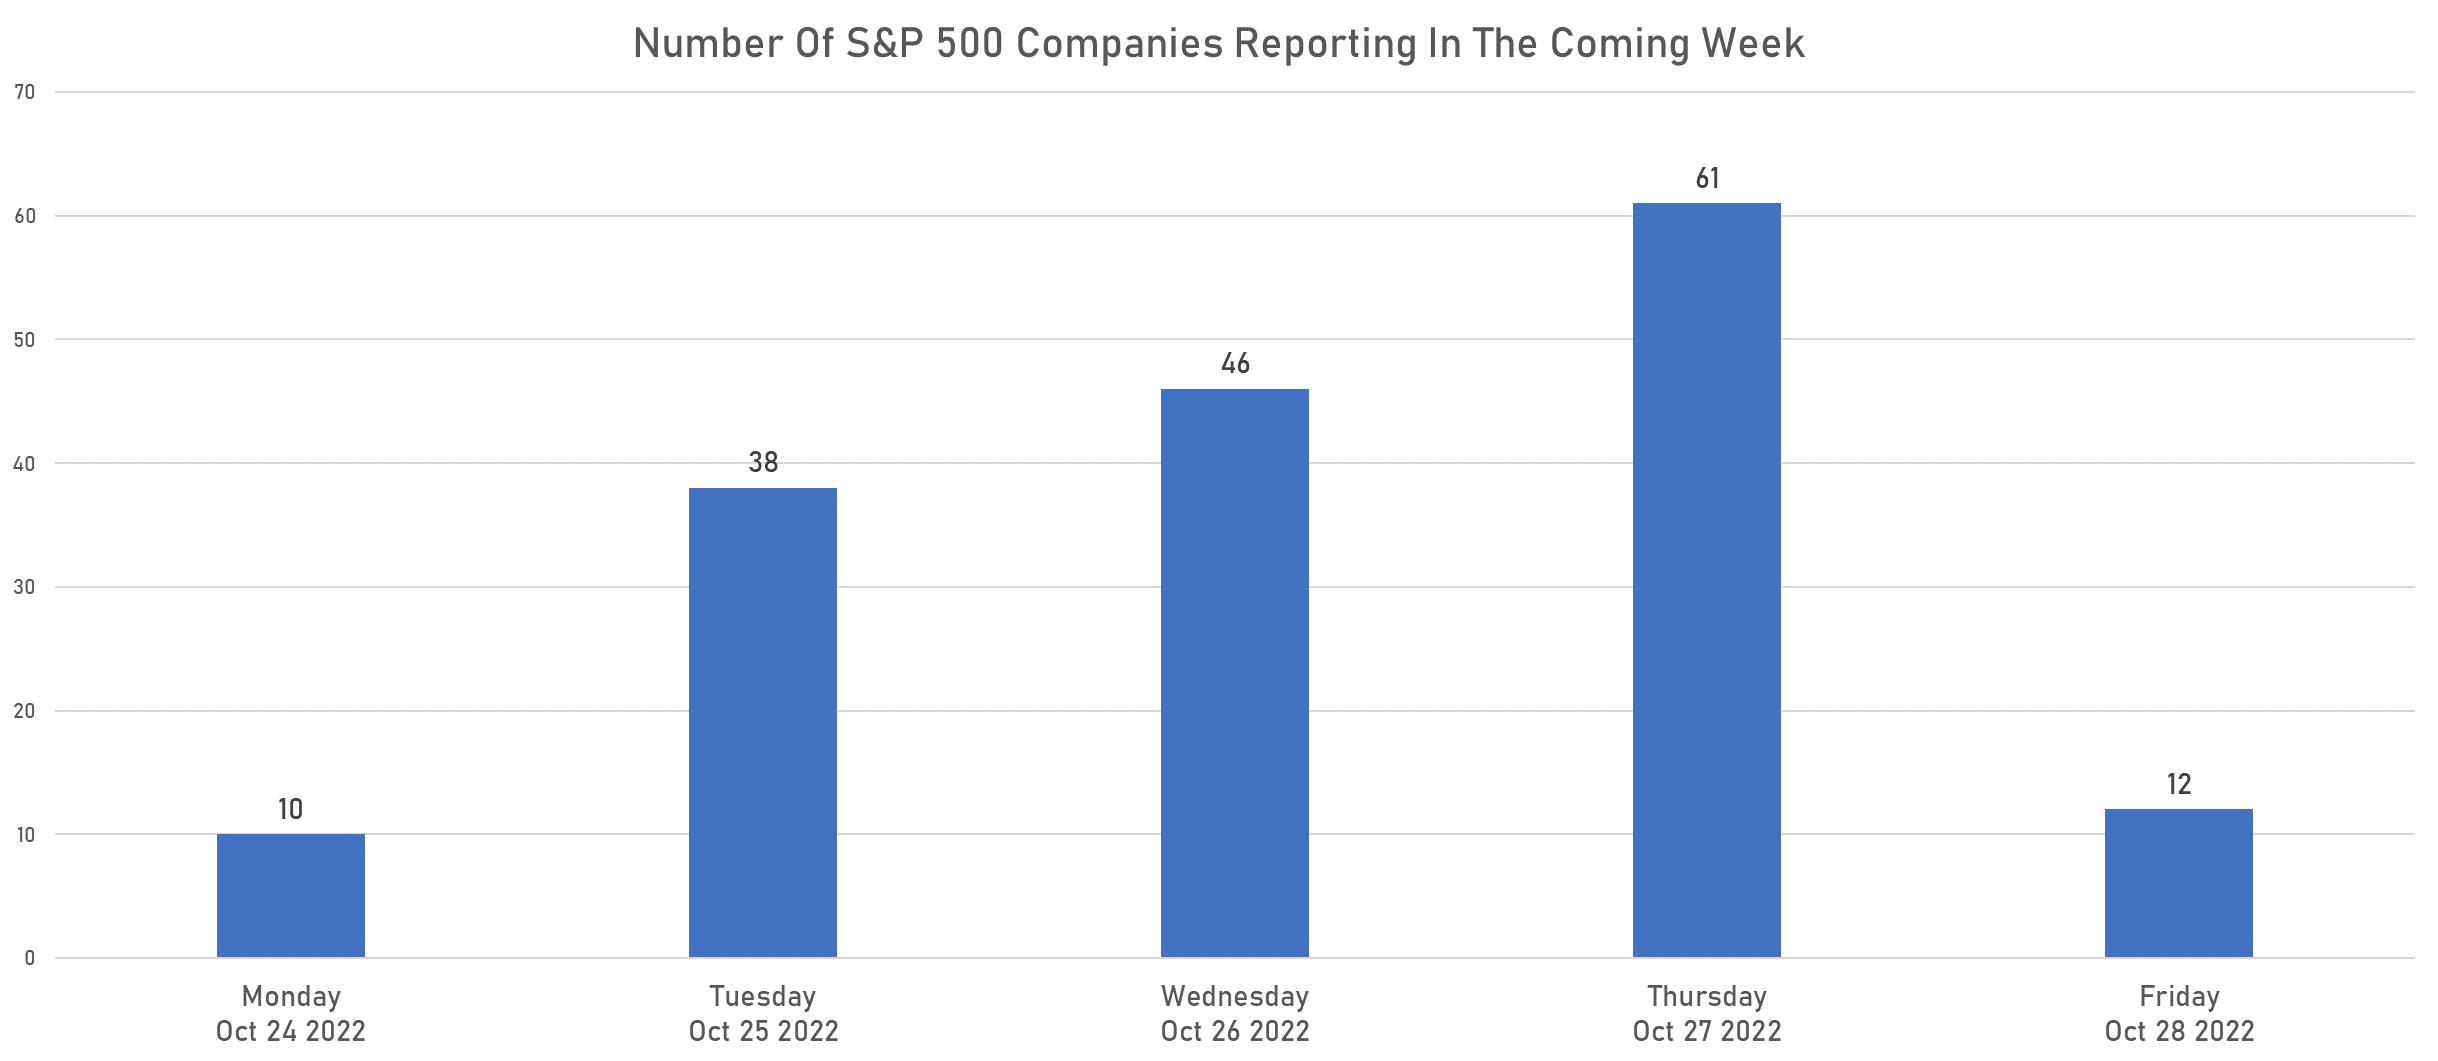
BUSY WEEK AHEAD, WITH 1/3 OF S&P 500 COMPANIES REPORTING
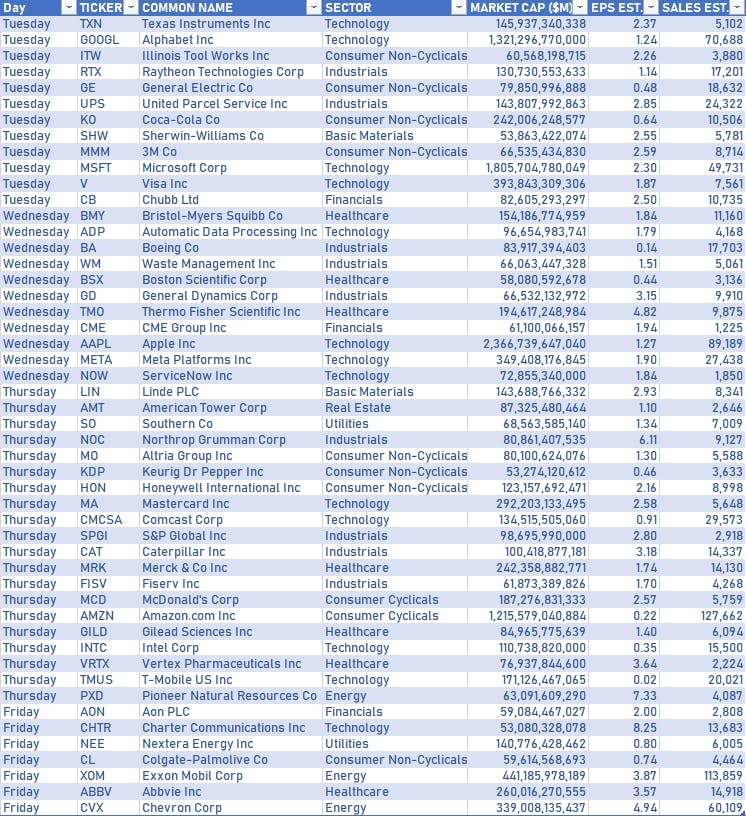
TOP COMPANIES REPORTING NEXT WEEK
WEEKLY TOTAL RETURNS OF MAJOR GLOBAL EQUITY MARKETS
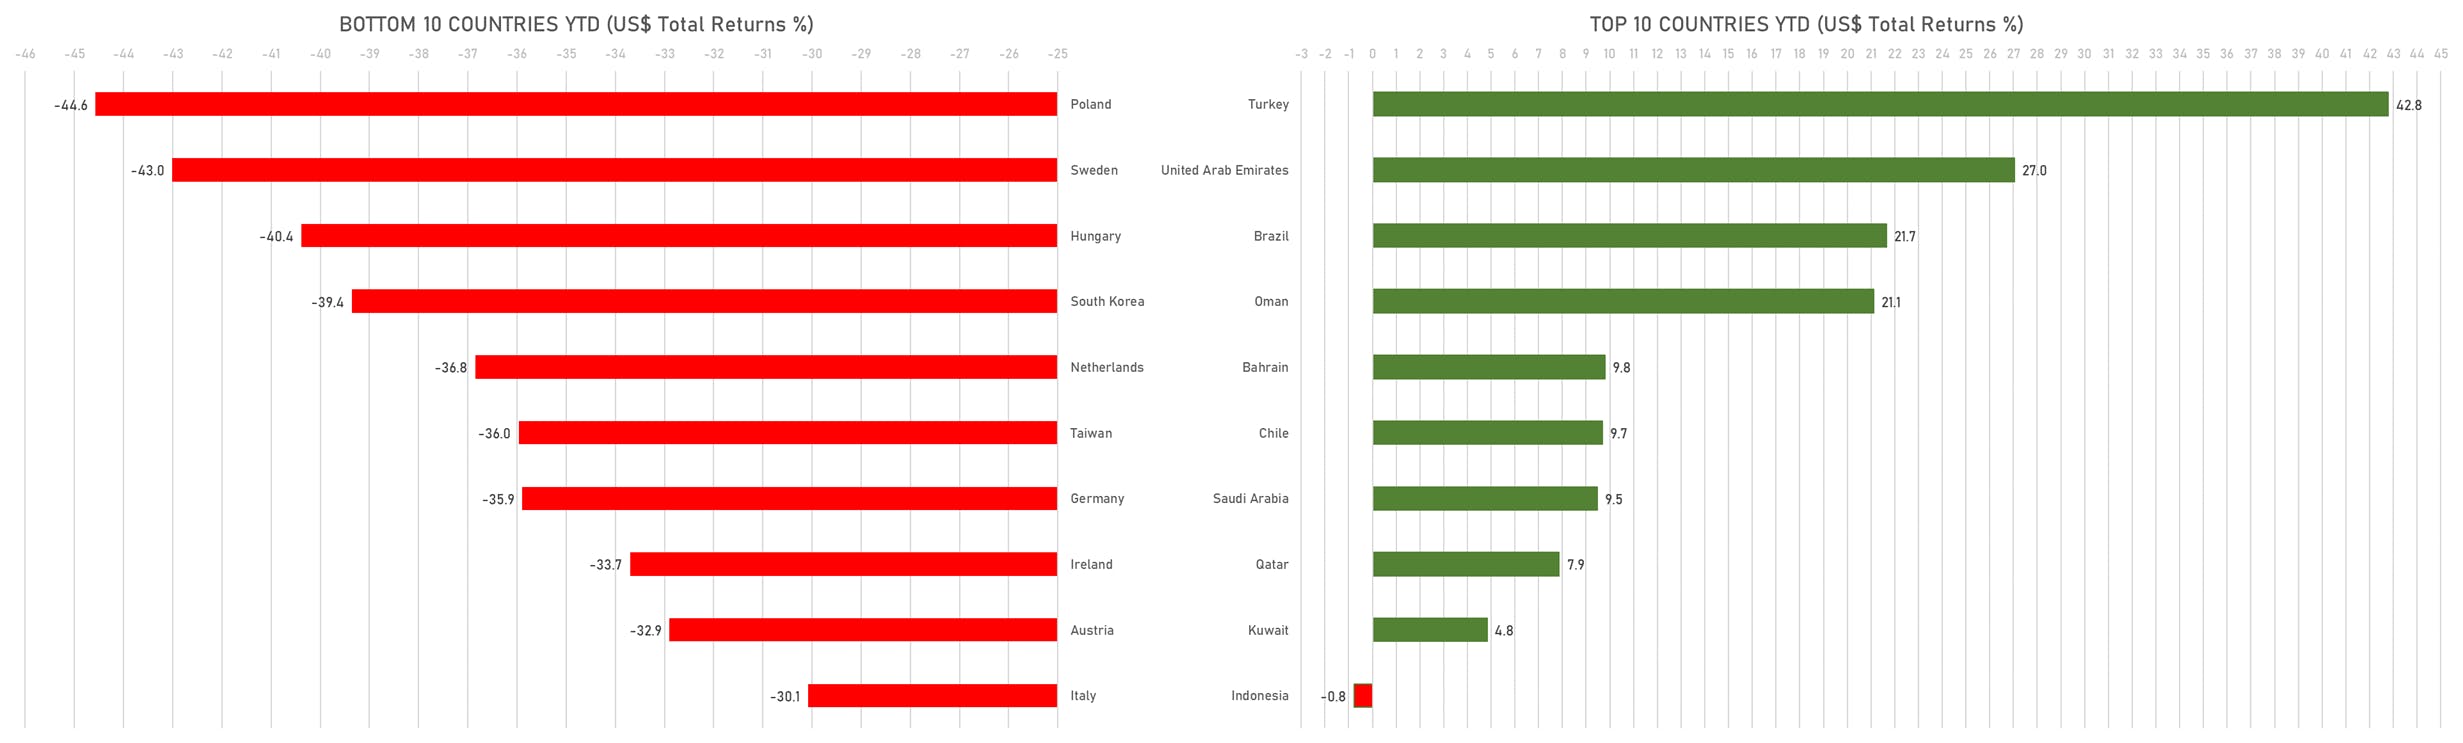
TOP / BOTTOM PERFORMING WORLD MARKETS YTD