Equities
Solid Bounce In US Equities Despite Mediocre Earnings, As Fed Scores Own Goal Hinting At Policy Slowdown
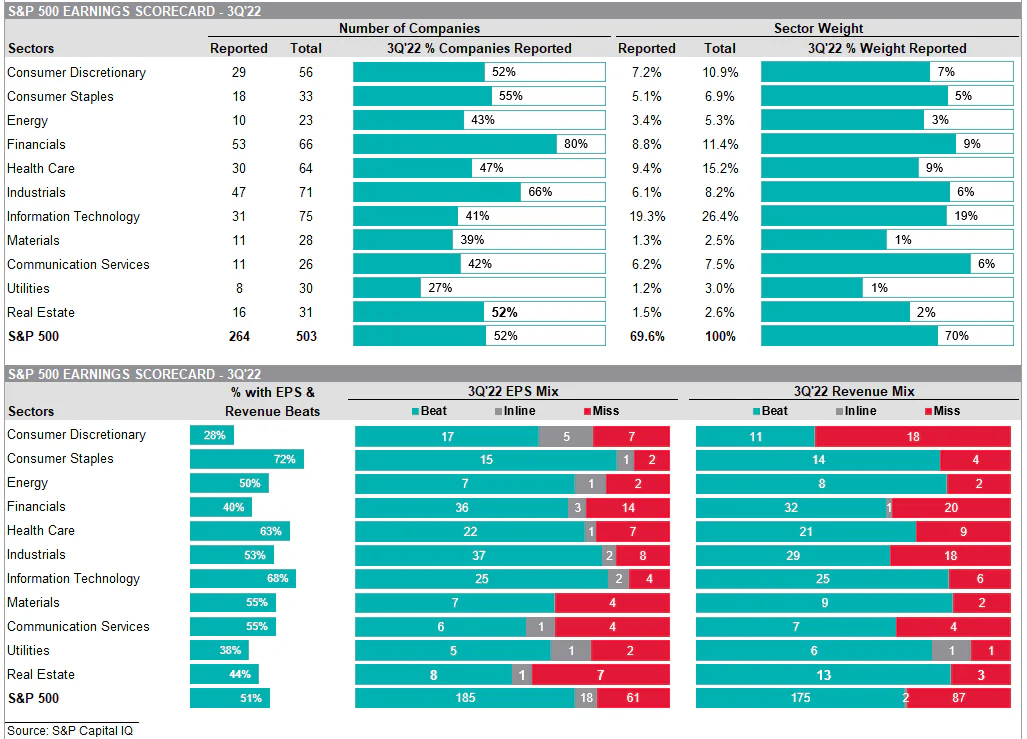
With a little over half of S&P 500 companies having now reported their 3Q22 earnings, the results have been broadly disappointing, tracking well below weak expectations (2.2% EPS growth realized vs 3% expected)
Published ET
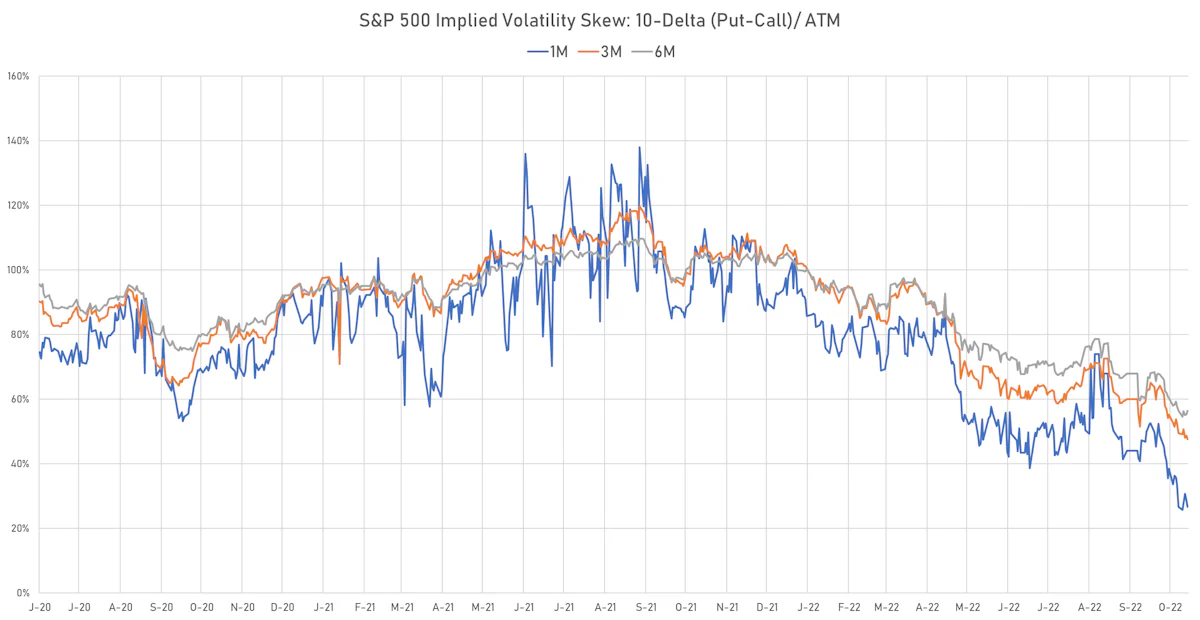
S&P 500 Implied Volatility Short-Term Skew At Very Low Level | Sources: ϕpost, Refinitiv data
DAILY SUMMARY
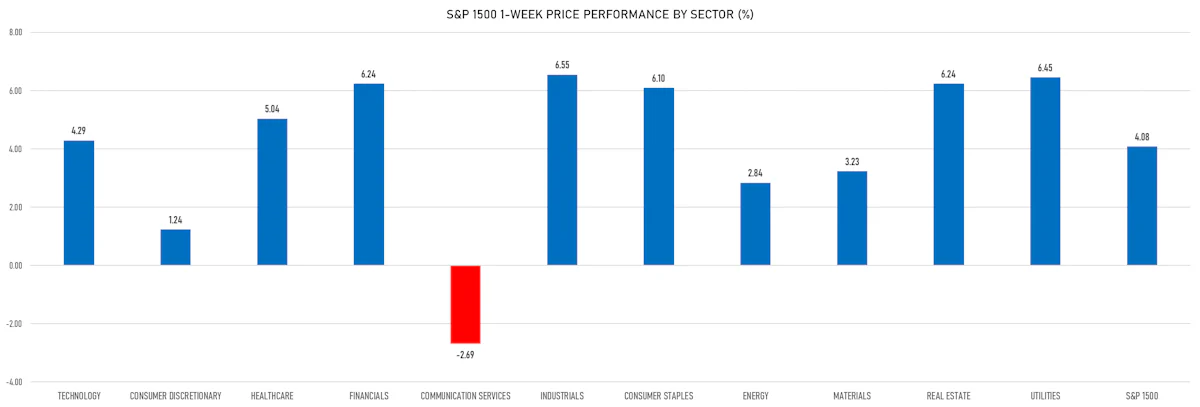
- Daily performance of US indices: S&P 500 up 2.46%; Nasdaq Composite up 2.87%; Wilshire 5000 up 1.17%
- 90.5% of S&P 500 stocks were up today, with 36.2% of stocks above their 200-day moving average (DMA) and 62.2% above their 50-DMA
- Top performing sectors in the S&P 500: technology up 4.52% and communication services up 2.98%
- Bottom performing sectors in the S&P 500: consumer discretionary down -0.30% and energy up 0.66%
- The number of shares in the S&P 500 traded today was 744m for a total turnover of US$ 71 bn
- The S&P 500 Value Index was up 2.2%, while the S&P 500 Growth Index was up 2.7%; the S&P small caps index was up 2.1% and mid caps were up 1.9%
- The volume on CME's INX (S&P 500 Index) was 2901.5m (3-month z-score: 1.1); the 3-month average volume is 2411.6m and the 12-month range is 1340.2 - 4692.3m
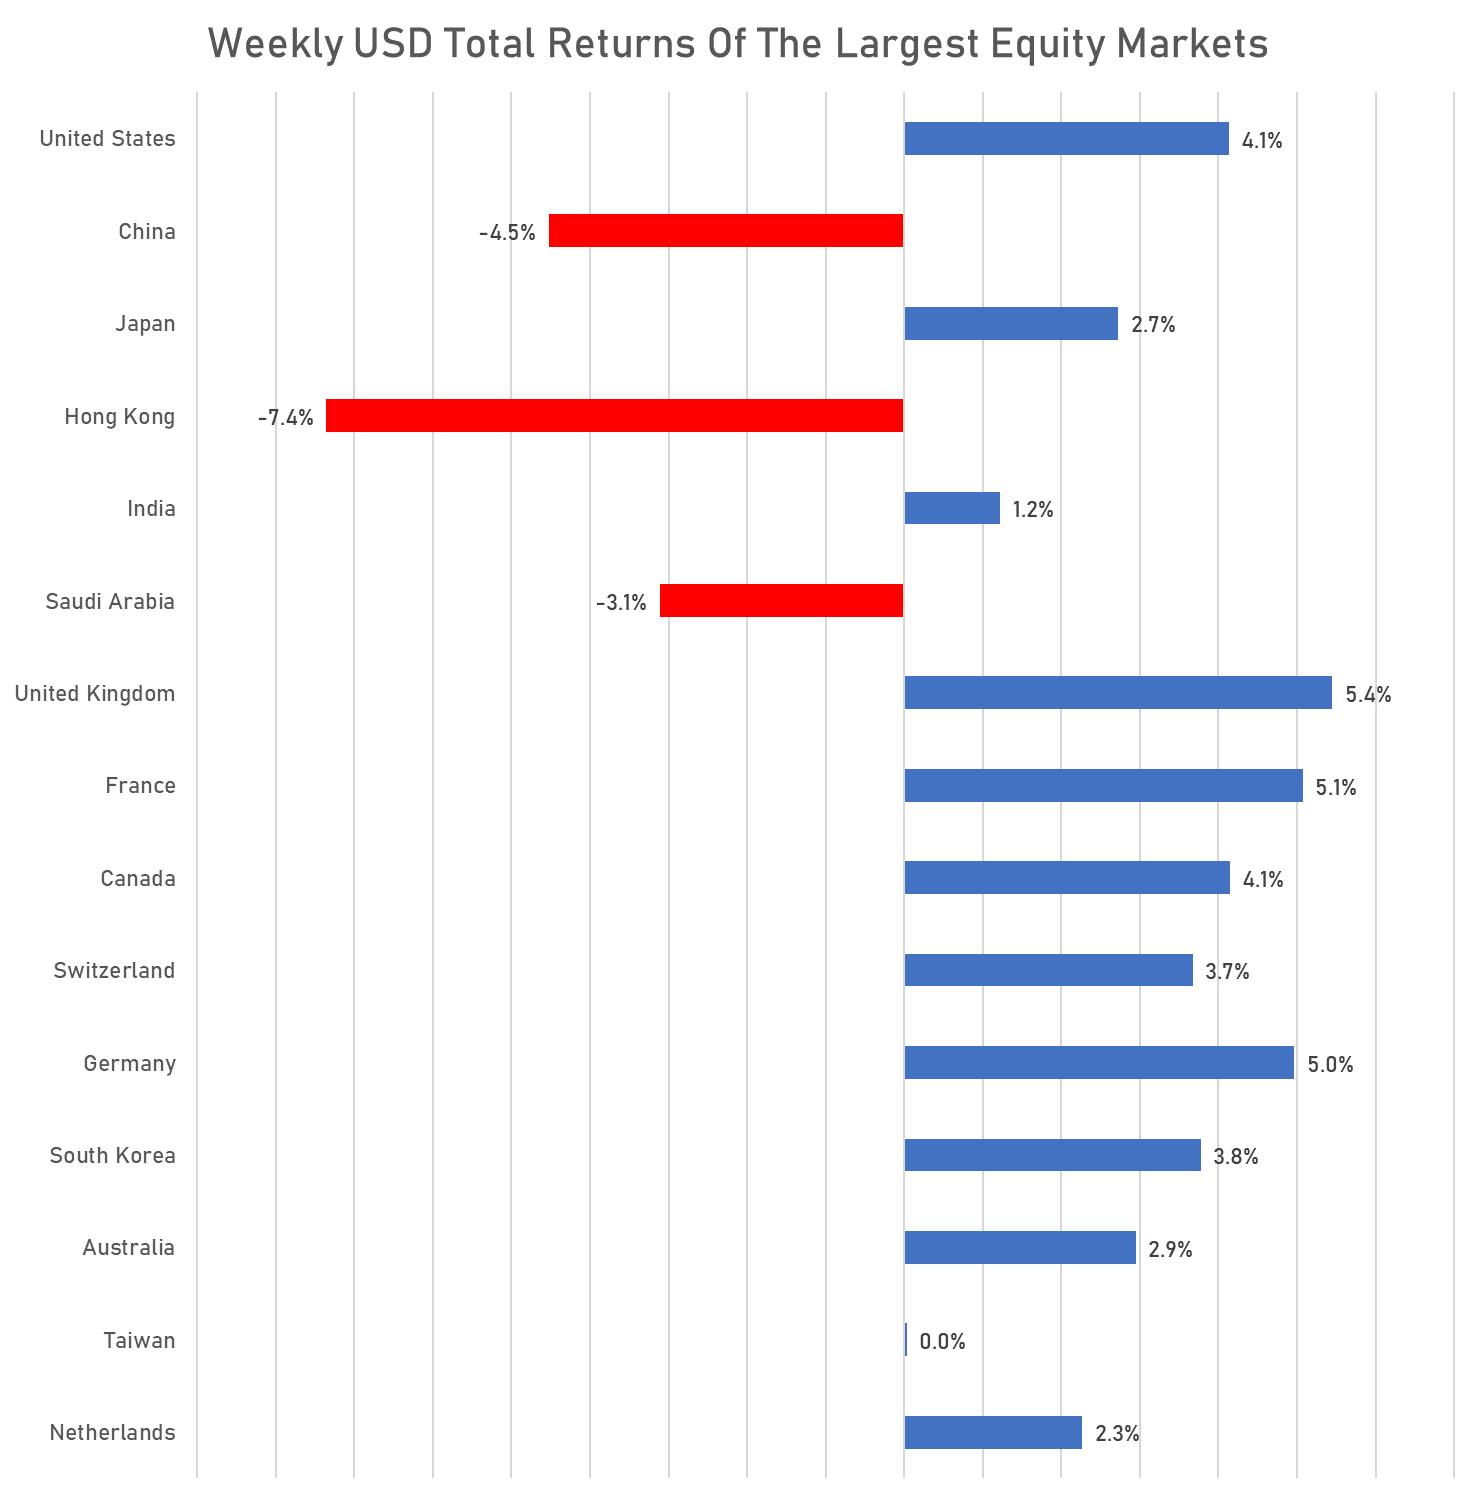
- Daily performance of international indices: Europe Stoxx 600 up 0.14%; UK FTSE 100 down -0.37%; Hang Seng SH-SZ-HK 300 Index down -3.05%; Japan's TOPIX 500 down -0.34%
- Chinese equities fell hard after recent political changes, and the Japanese equity market has overtaken Hong Kong in total market cap (now in third position behind the US and China Mainland)
VOLATILITY TODAY
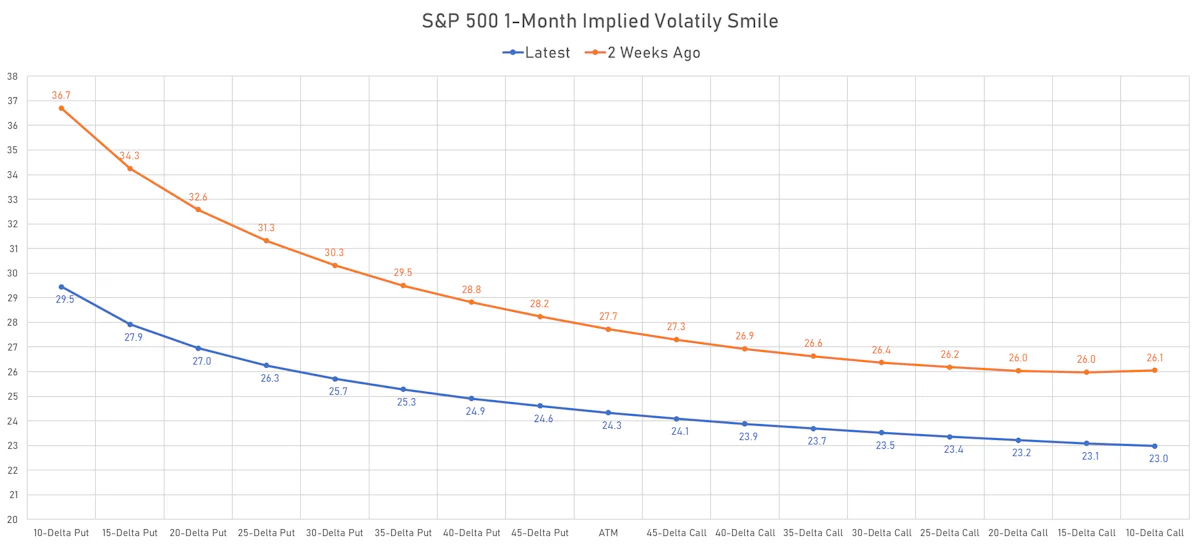
- 1-month at-the-money implied volatility on the S&P 500 at 24.3%, down from 25.6%
- 1-month at-the-money implied volatility on the STOXX Europe 600 at 19.6%, down from 20.6%
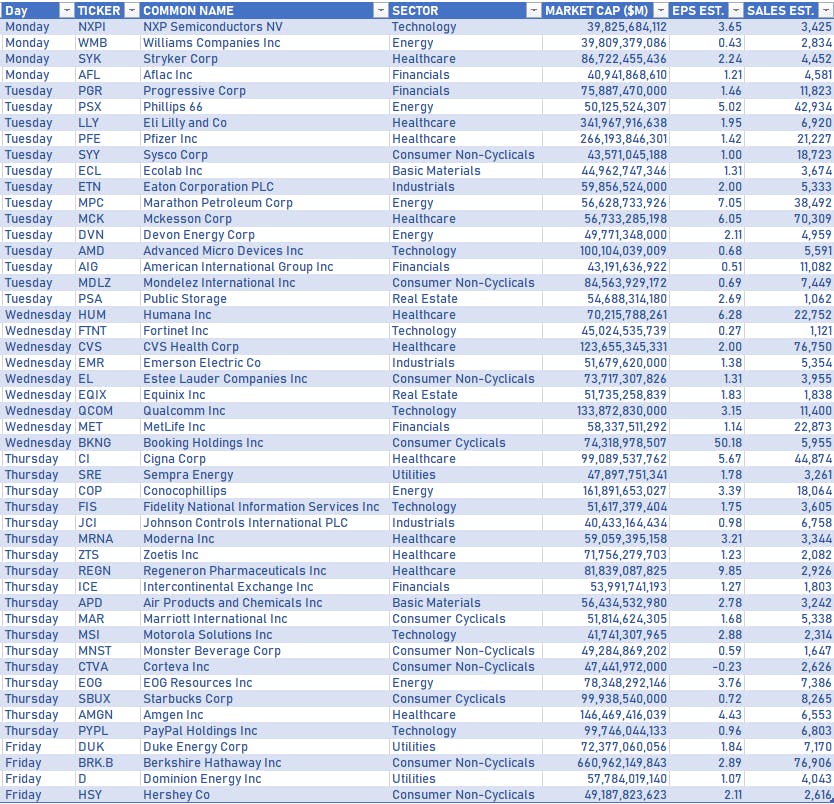
TOP S&P 500 COMPANIES REPORTING IN THE WEEK AHEAD
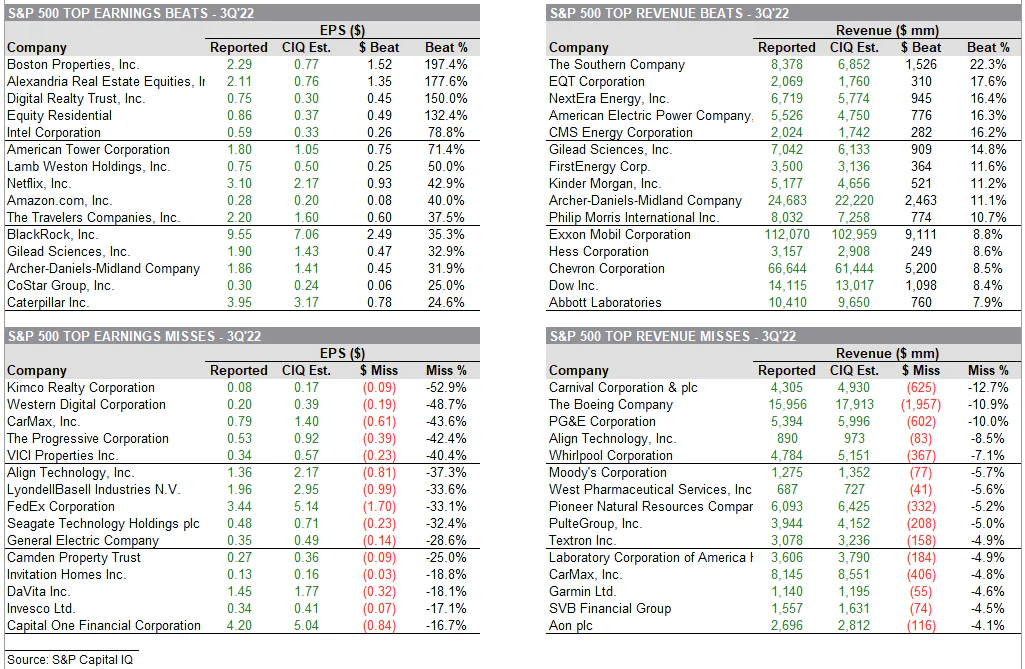
CURRENT US EARNINGS DASHBOARD
TOP S&P 500 PERFORMERS THIS WEEK
- Universal Health Services Inc (UHS), up 30.0% to $117.02 / YTD price return: -9.7% / 12-Month Price Range: $ 82.52-158.24 / Short interest (% of float): 5.4%; days to cover: 5.2
- Dexcom Inc (DXCM), up 26.3% to $120.87 / YTD price return: -10.0% / 12-Month Price Range: $ 66.94-164.63 / Short interest (% of float): 3.6%; days to cover: 5.1
- Enphase Energy Inc (ENPH), up 21.1% to $305.25 / YTD price return: +66.9% / 12-Month Price Range: $ 113.49-324.78 / Short interest (% of float): 3.3%; days to cover: 1.1
- MSCI Inc (MSCI), up 18.1% to $474.27 / YTD price return: -22.6% / 12-Month Price Range: $ 376.60-679.85 / Short interest (% of float): 0.8%; days to cover: 1.4
- Raymond James Financial Inc (RJF), up 18.0% to $119.24 / YTD price return: +18.7% / 12-Month Price Range: $ 84.89-119.24 / Short interest (% of float): 1.4%; days to cover: 2.6
- Moderna Inc (MRNA), up 17.7% to $150.97 / YTD price return: -40.6% / 12-Month Price Range: $ 115.06-376.65 / Short interest (% of float): 4.6%; days to cover: 3.2
- Gilead Sciences Inc (GILD), up 16.9% to $79.27 / YTD price return: +9.2% / 12-Month Price Range: $ 57.17-79.27 / Short interest (% of float): 1.3%; days to cover: 2.0
- IQVIA Holdings Inc (IQV), up 16.9% to $208.16 / YTD price return: -26.2% / 12-Month Price Range: $ 165.85-284.98 / Short interest (% of float): 1.1%; days to cover: 1.8
- Ameriprise Financial Inc (AMP), up 16.8% to $312.17 / YTD price return: +3.4% / 12-Month Price Range: $ 219.99-332.36 / Short interest (% of float): 1.0%; days to cover: 1.9
- ServiceNow Inc (NOW), up 16.6% to $420.40 / YTD price return: -35.2% / 12-Month Price Range: $ 337.22-707.31 / Short interest (% of float): 1.7%; days to cover: 1.9
BOTTOM S&P 500 PERFORMERS THIS WEEK
- Meta Platforms Inc (META), down 23.7% to $99.20 / YTD price return: -70.5% / 12-Month Price Range: $ 96.39-353.82 / Short interest (% of float): 1.2%; days to cover: 0.8
- DaVita Inc (DVA), down 21.6% to $70.54 / YTD price return: -38.0% / 12-Month Price Range: $ 70.54-124.80 / Short interest (% of float): 4.2%; days to cover: 5.8 (the stock is currently on the short sale restriction list)
- Edwards Lifesciences Corp (EW), down 16.4% to $70.87 / YTD price return: -45.3% / 12-Month Price Range: $ 70.87-131.67 / Short interest (% of float): 1.2%; days to cover: 2.8 (the stock is currently on the short sale restriction list)
- Amazon.com Inc (AMZN), down 13.3% to $103.41 / YTD price return: -38.0% / 12-Month Price Range: $ 101.35-188.07 / Short interest (% of float): 0.8%; days to cover: 1.3 (the stock is currently on the short sale restriction list)
- Align Technology Inc (ALGN), down 9.2% to $188.62 / YTD price return: -71.3% / 12-Month Price Range: $ 176.01-712.70 / Short interest (% of float): 3.2%; days to cover: 2.6
- Assurant Inc (AIZ), down 8.3% to $134.69 / YTD price return: -13.6% / 12-Month Price Range: $ 131.22-194.11 / Short interest (% of float): 2.6%; days to cover: 3.7
- Seagate Technology Holdings PLC (STX), down 7.6% to $51.45 / YTD price return: -54.5% / 12-Month Price Range: $ 49.62-117.63 / Short interest (% of float): 5.6%; days to cover: 4.4
- Bio Rad Laboratories Inc (BIO), down 6.3% to $354.30 / YTD price return: -53.1% / 12-Month Price Range: $ 354.30-798.36 / Short interest (% of float): 1.2%; days to cover: 1.3
- Las Vegas Sands Corp (LVS), down 5.1% to $37.09 / YTD price return: -1.5% / 12-Month Price Range: $ 28.88-48.26 / Short interest (% of float): 4.8%; days to cover: 2.0
- LyondellBasell Industries NV (LYB), down 5.1% to $77.99 / YTD price return: -11.4% / 12-Month Price Range: $ 71.50-112.53 / Short interest (% of float): 2.6%; days to cover: 2.5
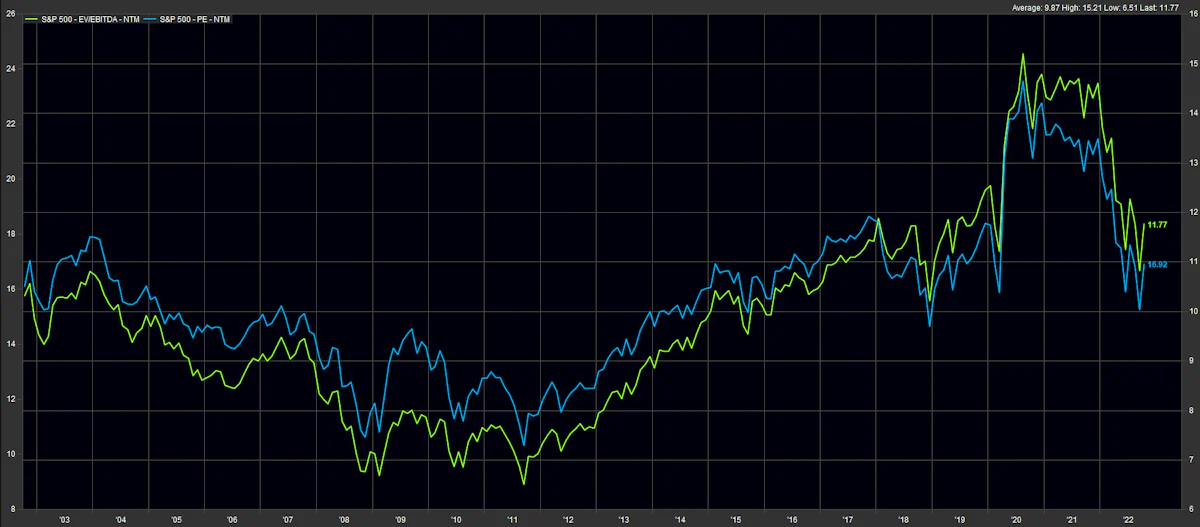
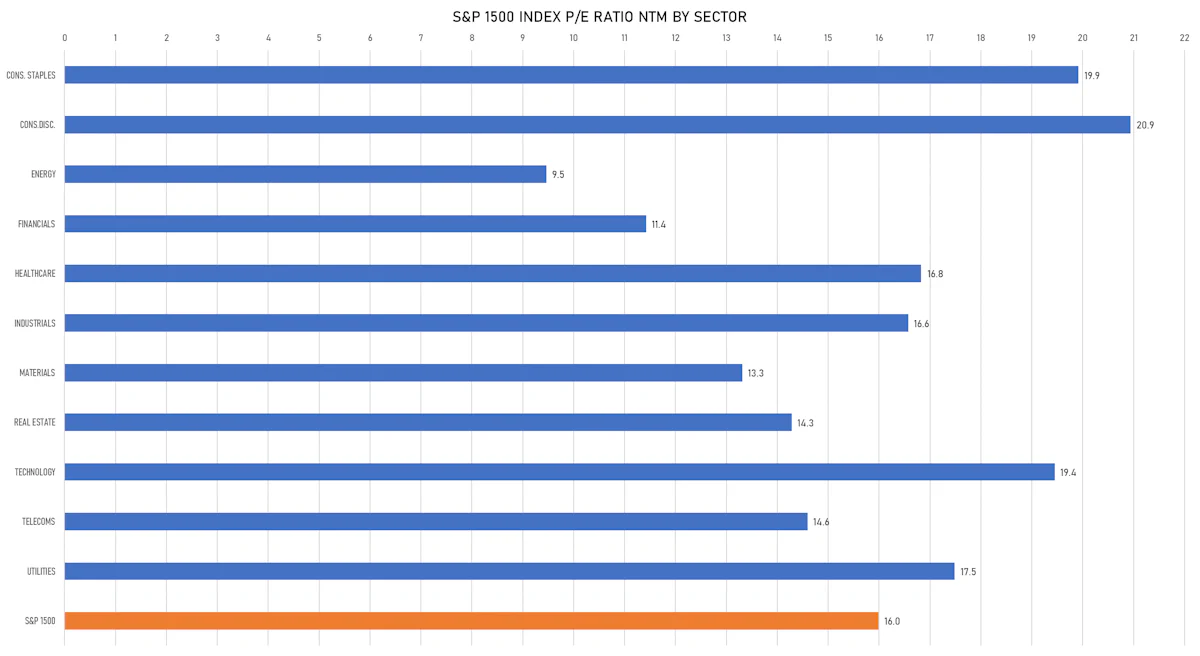
VALUATION MULTIPLES BY SECTORS
WEEKLY TOTAL RETURNS OF MAJOR GLOBAL EQUITY MARKETS
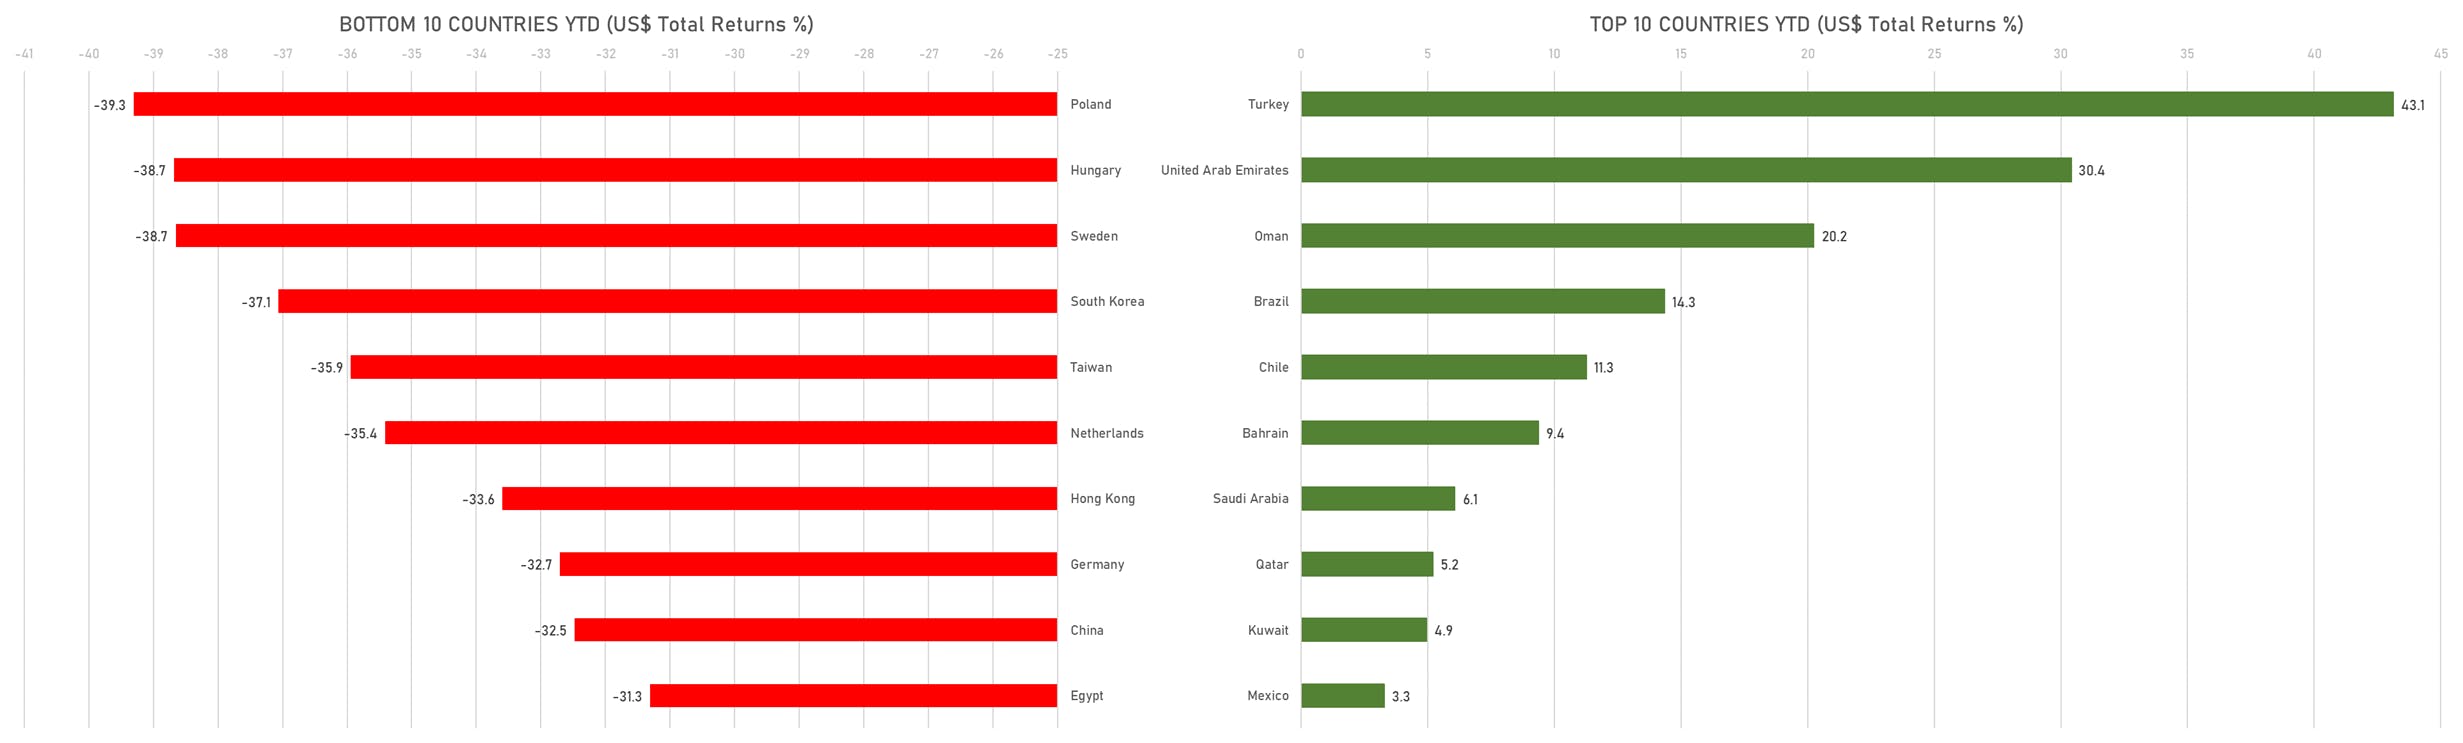
TOP / BOTTOM PERFORMING WORLD MARKETS YTD
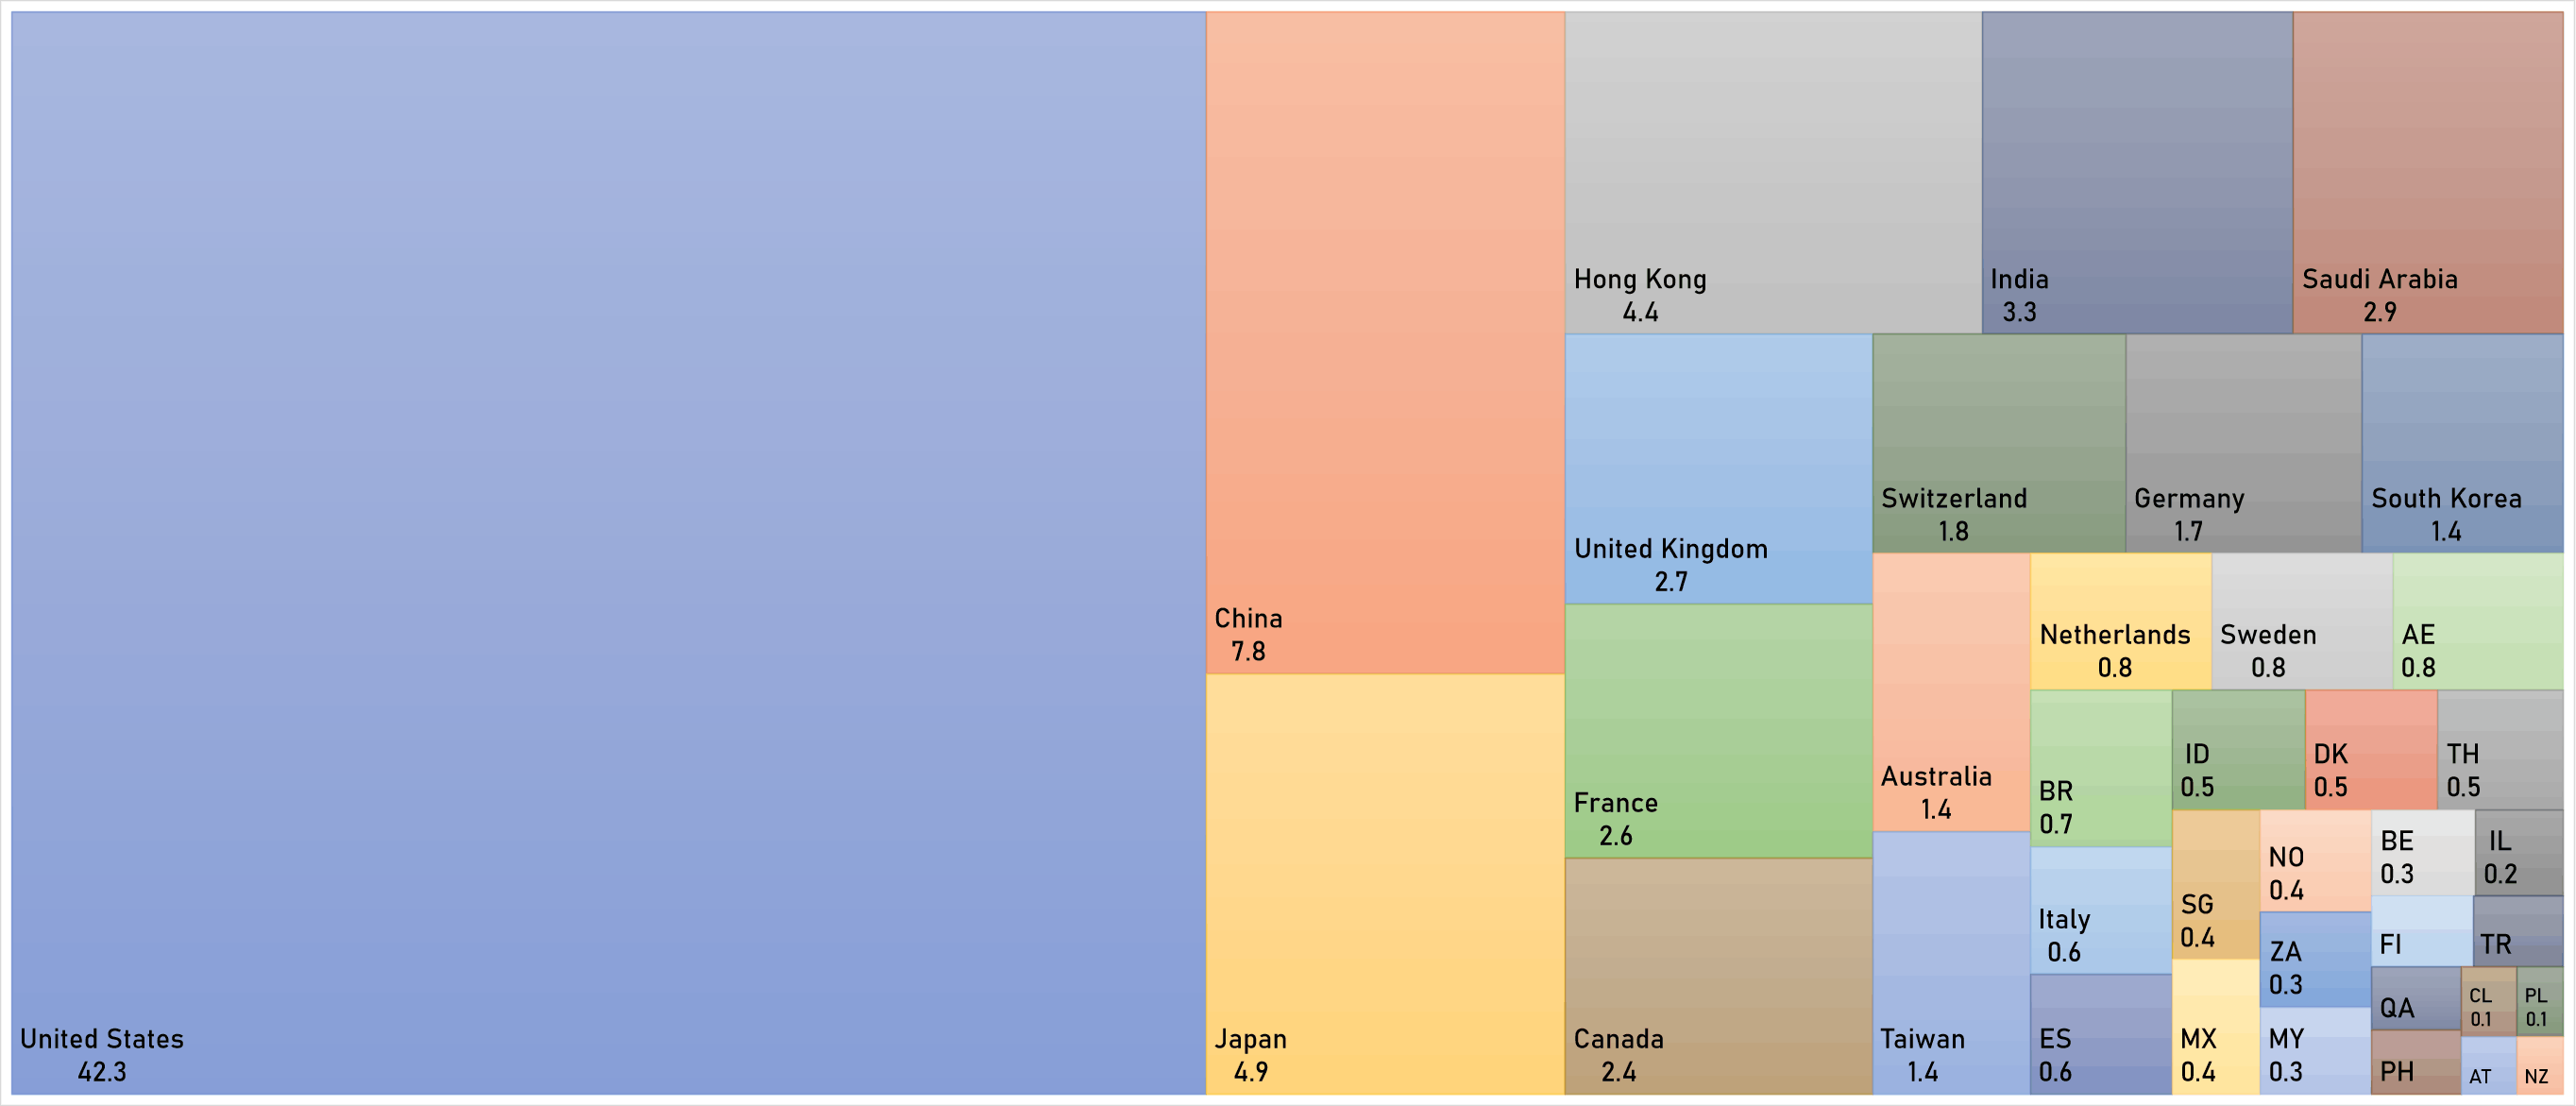
WORLD MARKET CAPITALIZATION (US$ Trillion)