Equities
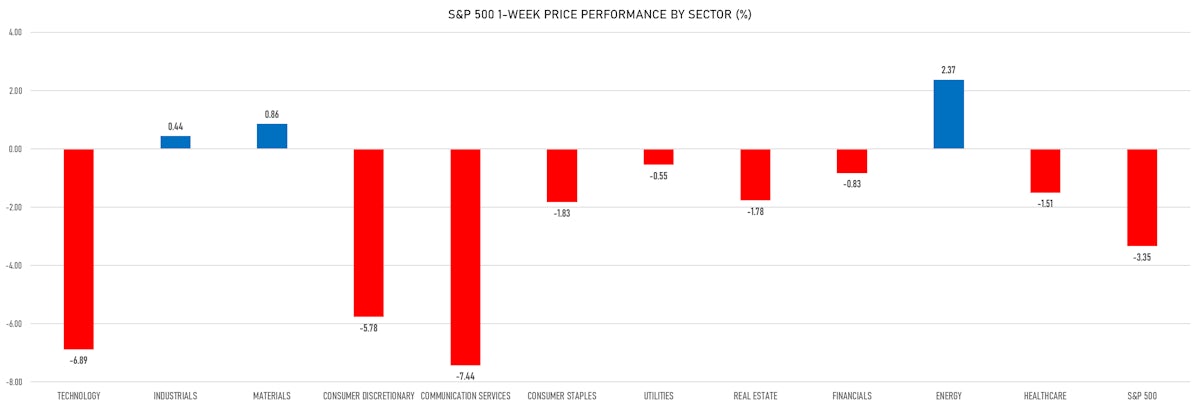
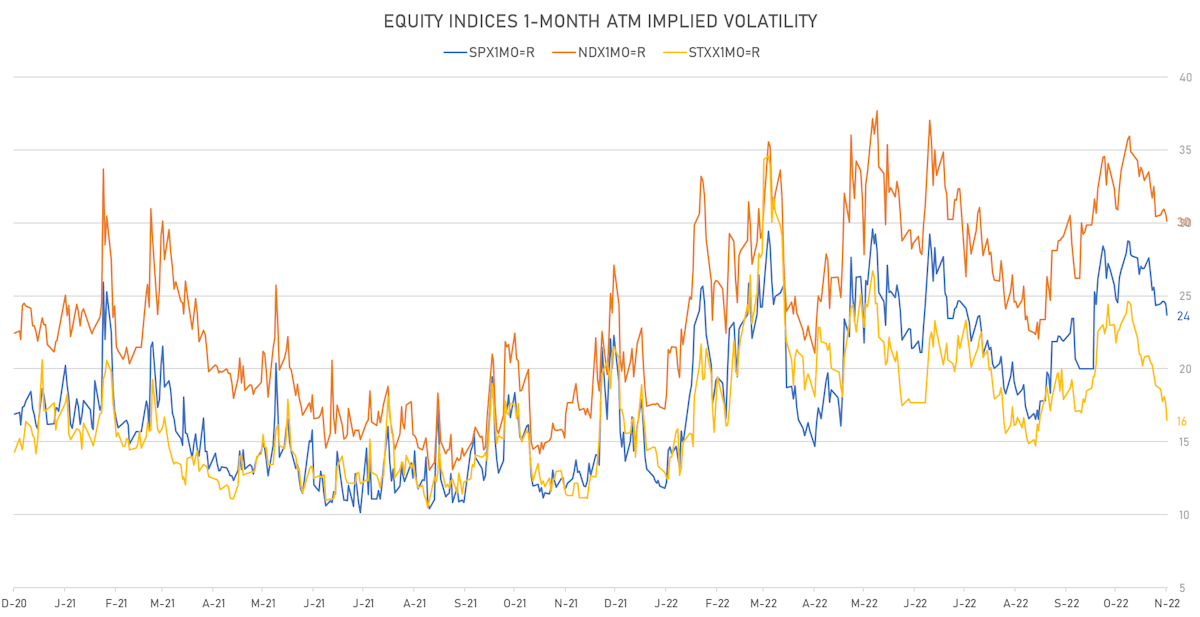
US Equities Dropped This Week Along With Implied Volatility, An Illustration Of A Nervous Market With Low Convictions, Light Positioning
Optimism about China's reopening drove speculative enthusiasm through the Mainland and HK markets this week, with the most depressed sectors (internet stocks) leading the way
Published ET
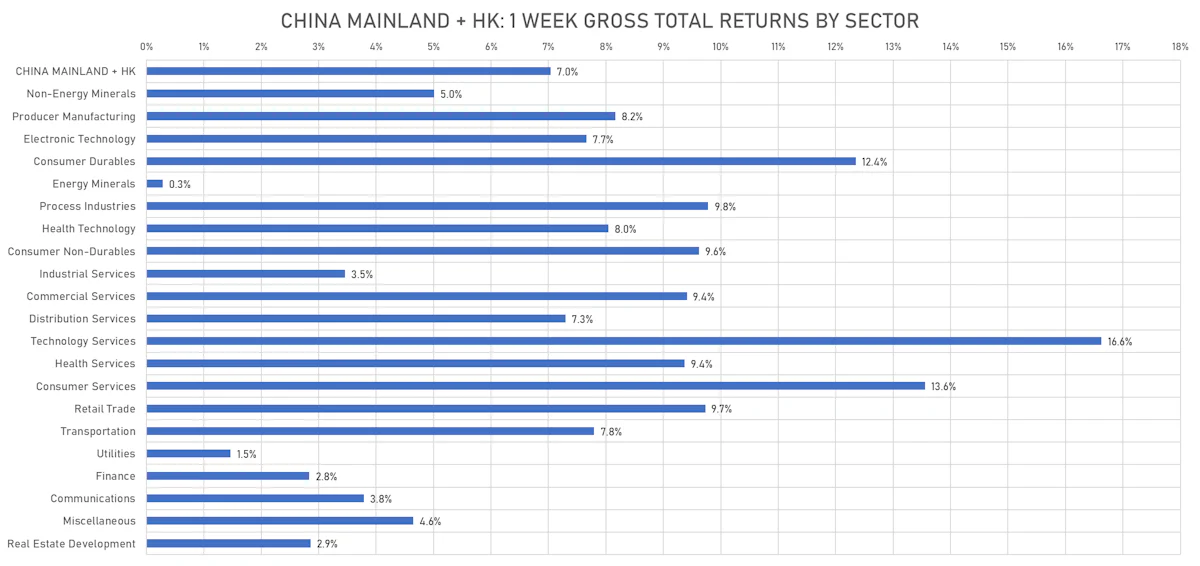
China Mainland + HK Gross Total Returns (USD) By Sector | Sources: ϕpost, FactSet data
DAILY SUMMARY
- Daily performance of US indices: S&P 500 up 1.36%; Nasdaq Composite up 1.28%; Wilshire 5000 up 1.73%
- 80.1% of S&P 500 stocks were up today, with 34.4% of stocks above their 200-day moving average (DMA) and 56.9% above their 50-DMA
- Top performing sectors in the S&P 500: materials up 3.41% and financials up 1.87%
- Bottom performing sectors in the S&P 500: utilities up 0.57% and utilities up 0.57%
- The number of shares in the S&P 500 traded today was 762m for a total turnover of US$ 70 bn
- The S&P 500 Value Index was up 1.3%, while the S&P 500 Growth Index was up 1.4%; the S&P small caps index was up 1.7% and mid caps were up 1.9%
- The volume on CME's INX (S&P 500 Index) was 3025.9m (3-month z-score: 1.2); the 3-month average volume is 2460.8m and the 12-month range is 1340.2 - 4692.3m
- Daily performance of international indices: Europe Stoxx 600 up 1.81%; UK FTSE 100 up 2.03%; Hang Seng SH-SZ-HK 300 Index up 4.22%; Japan's TOPIX 500 down -1.31%
VOLATILITY TODAY
- 1-month at-the-money implied volatility on the S&P 500 at 23.7%, down from 24.4%
- 1-month at-the-money implied volatility on the STOXX Europe 600 at 17.5%, down from 18.6%
S&P 500 EARNINGS DASHBOARD
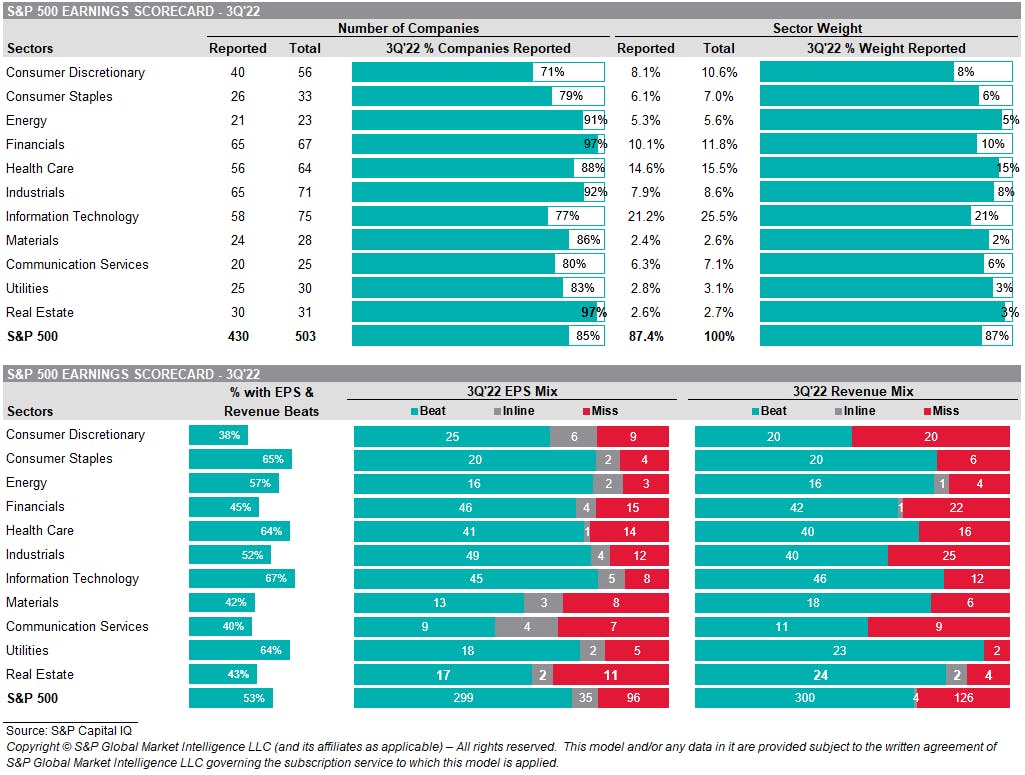
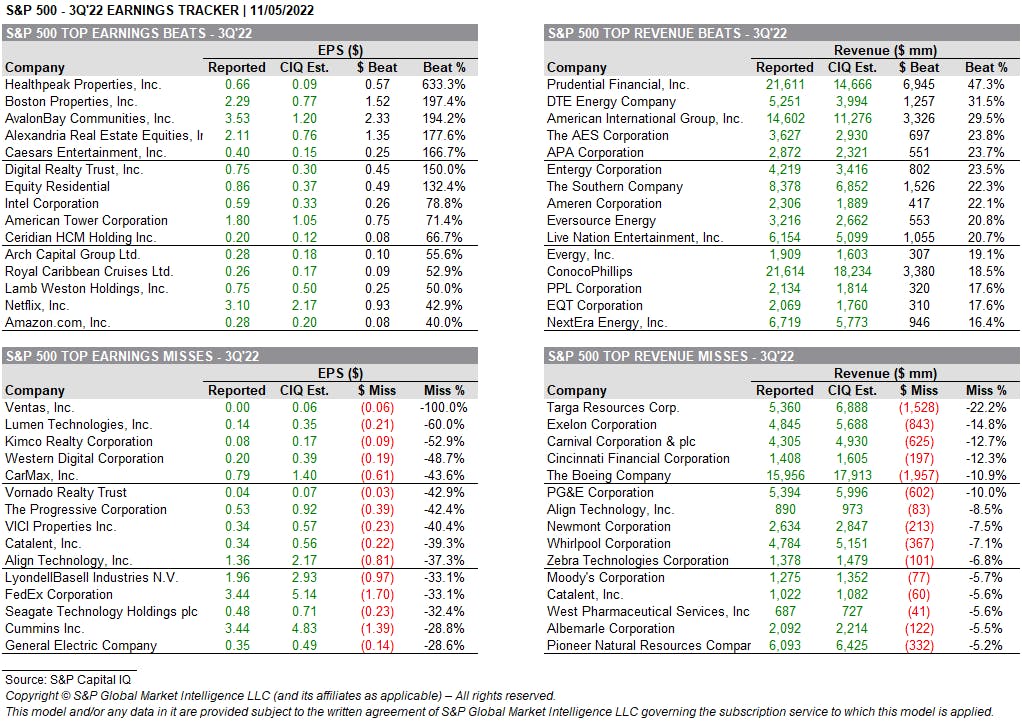
BEATS & MISSES IN 3Q22 EARNINGS
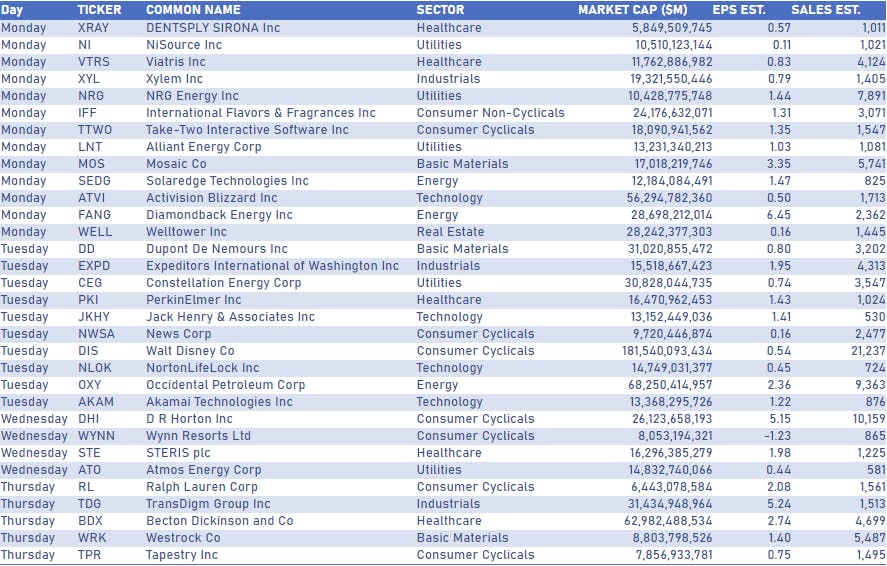
TOP US COMPANIES REPORTING NEXT WEEK
TOP S&P 500 PERFORMERS THIS WEEK
- ABIOMED Inc (ABMD), up 44.9% to $373.99 / YTD price return: +4.1% / 12-Month Price Range: $ 220.03-381.48 / Short interest (% of float): 4.5%; days to cover: 6.4
- Wynn Resorts Ltd (WYNN), up 21.5% to $70.81 / YTD price return: -16.7% / 12-Month Price Range: $ 50.22-98.99 / Short interest (% of float): 6.9%; days to cover: 1.6
- Hologic Inc (HOLX), up 12.4% to $75.23 / YTD price return: -1.7% / 12-Month Price Range: $ 59.78-80.49 / Short interest (% of float): 3.2%; days to cover: 4.7
- Boeing Co (BA), up 11.2% to $160.01 / YTD price return: -20.5% / 12-Month Price Range: $ 113.03-233.94 / Short interest (% of float): 1.5%; days to cover: 1.3
- Freeport-McMoRan Inc (FCX), up 9.3% to $35.19 / YTD price return: -15.7% / 12-Month Price Range: $ 24.81-51.99 / Short interest (% of float): 2.3%; days to cover: 2.0
- Johnson Controls International PLC (JCI), up 8.7% to $63.81 / YTD price return: -21.5% / 12-Month Price Range: $ 45.53-81.77 / Short interest (% of float): 1.1%; days to cover: 2.0
- Air Products and Chemicals Inc (APD), up 8.5% to $276.06 / YTD price return: -9.3% / 12-Month Price Range: $ 216.24-316.38 / Short interest (% of float): 1.0%; days to cover: 2.4
- Las Vegas Sands Corp (LVS), up 8.5% to $40.24 / YTD price return: +6.9% / 12-Month Price Range: $ 28.88-48.26 / Short interest (% of float): 4.8%; days to cover: 2.0
- Arista Networks Inc (ANET), up 7.9% to $131.07 / YTD price return: -8.8% / 12-Month Price Range: $ 89.13-148.49 / Short interest (% of float): 2.0%; days to cover: 2.3
- Aptiv PLC (APTV), up 7.8% to $97.63 / YTD price return: -40.8% / 12-Month Price Range: $ 77.97-180.70 / Short interest (% of float): 1.6%; days to cover: 2.3
BOTTOM S&P 500 PERFORMERS THIS WEEK
- Lincoln National Corp (LNC), down 36.3% to $34.42 / YTD price return: -49.6% / 12-Month Price Range: $ 34.42-76.40 / Short interest (% of float): 2.1%; days to cover: 1.8 (the stock is currently on the short sale restriction list)
- Catalent Inc (CTLT), down 35.5% to $42.45 / YTD price return: -66.7% / 12-Month Price Range: $ 41.66-136.22 / Short interest (% of float): 2.5%; days to cover: 2.8
- Fidelity National Information Services Inc (FIS), down 29.1% to $60.17 / YTD price return: -44.9% / 12-Month Price Range: $ 56.53-122.00 / Short interest (% of float): 1.3%; days to cover: 1.4 (the stock is currently on the short sale restriction list)
- Global Payments Inc (GPN), down 22.2% to $97.45 / YTD price return: -27.9% / 12-Month Price Range: $ 94.00-153.74 / Short interest (% of float): 2.7%; days to cover: 3.1 (the stock is currently on the short sale restriction list)
- Zebra Technologies Corp (ZBRA), down 19.9% to $230.56 / YTD price return: -61.3% / 12-Month Price Range: $ 227.23-614.99 / Short interest (% of float): 1.8%; days to cover: 2.3
- Warner Bros Discovery Inc (WBD), down 19.5% to $10.43 / YTD price return: -55.7% / 12-Month Price Range: $ 10.43-31.55 / Short interest (% of float): 3.7%; days to cover: 3.7 (the stock is currently on the short sale restriction list)
- Lumen Technologies Inc (LUMN), down 19.3% to $5.92 / YTD price return: -52.8% / 12-Month Price Range: $ 5.78-14.49 / Short interest (% of float): 16.1%; days to cover: 8.3 (the stock is currently on the short sale restriction list)
- Paramount Global (PARA), down 18.1% to $15.57 / YTD price return: -48.4% / 12-Month Price Range: $ 15.57-39.21 / Short interest (% of float): 11.8%; days to cover: 6.3
- Fortinet Inc (FTNT), down 17.5% to $47.10 / YTD price return: -34.5% / 12-Month Price Range: $ 42.69-74.11 / Short interest (% of float): 1.4%; days to cover: 1.8
- Cognizant Technology Solutions Corp (CTSH), down 16.5% to $52.63 / YTD price return: -40.7% / 12-Month Price Range: $ 51.33-93.45 / Short interest (% of float): 1.6%
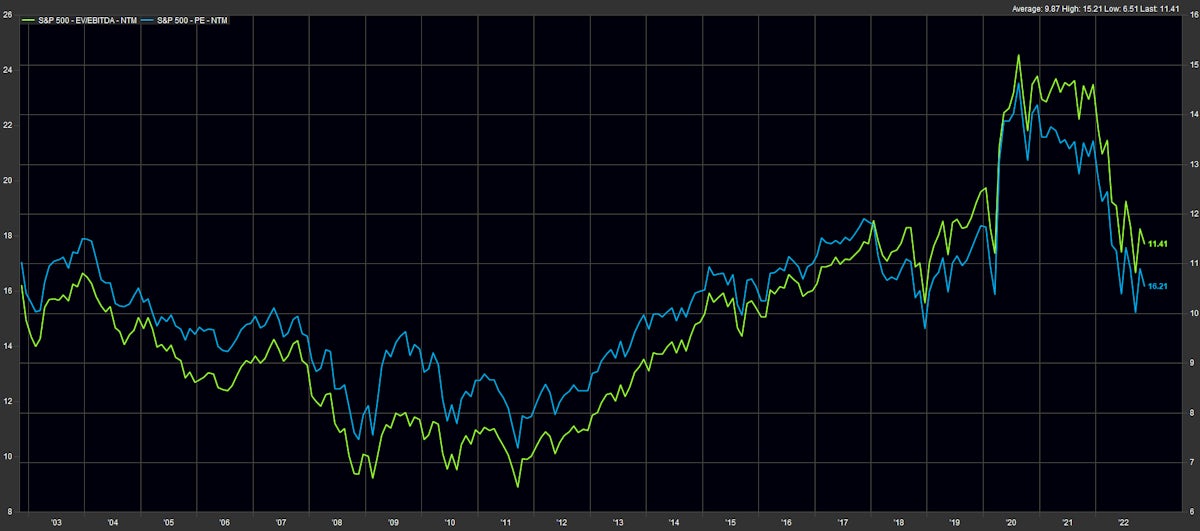
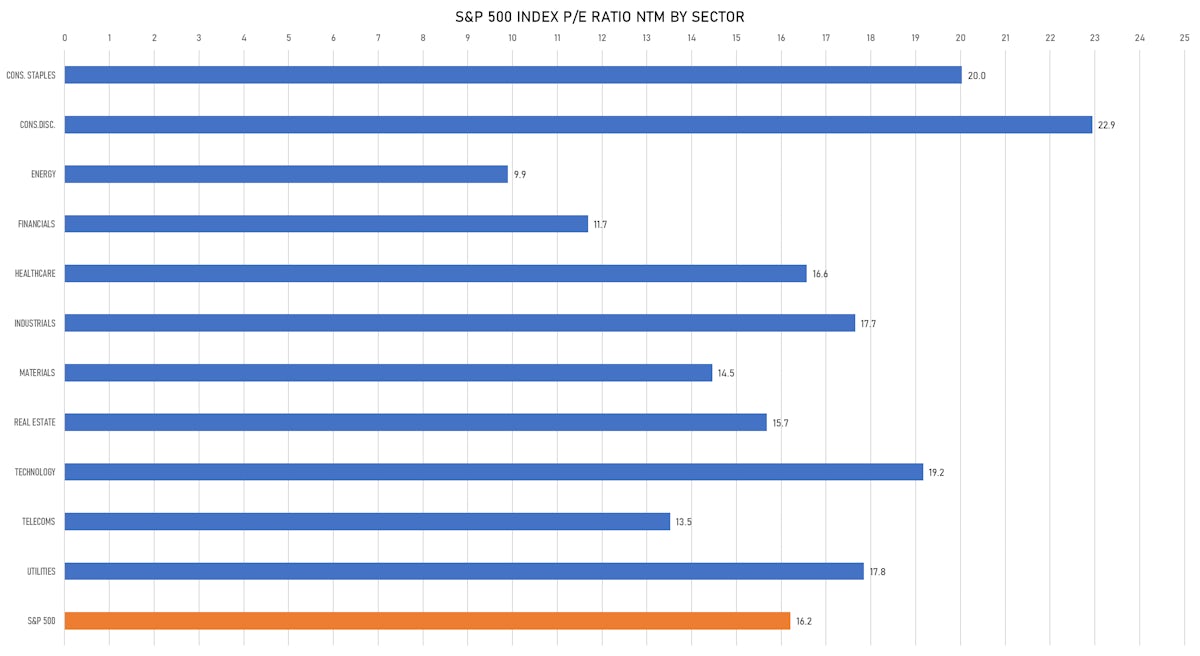
VALUATION MULTIPLES BY SECTORS
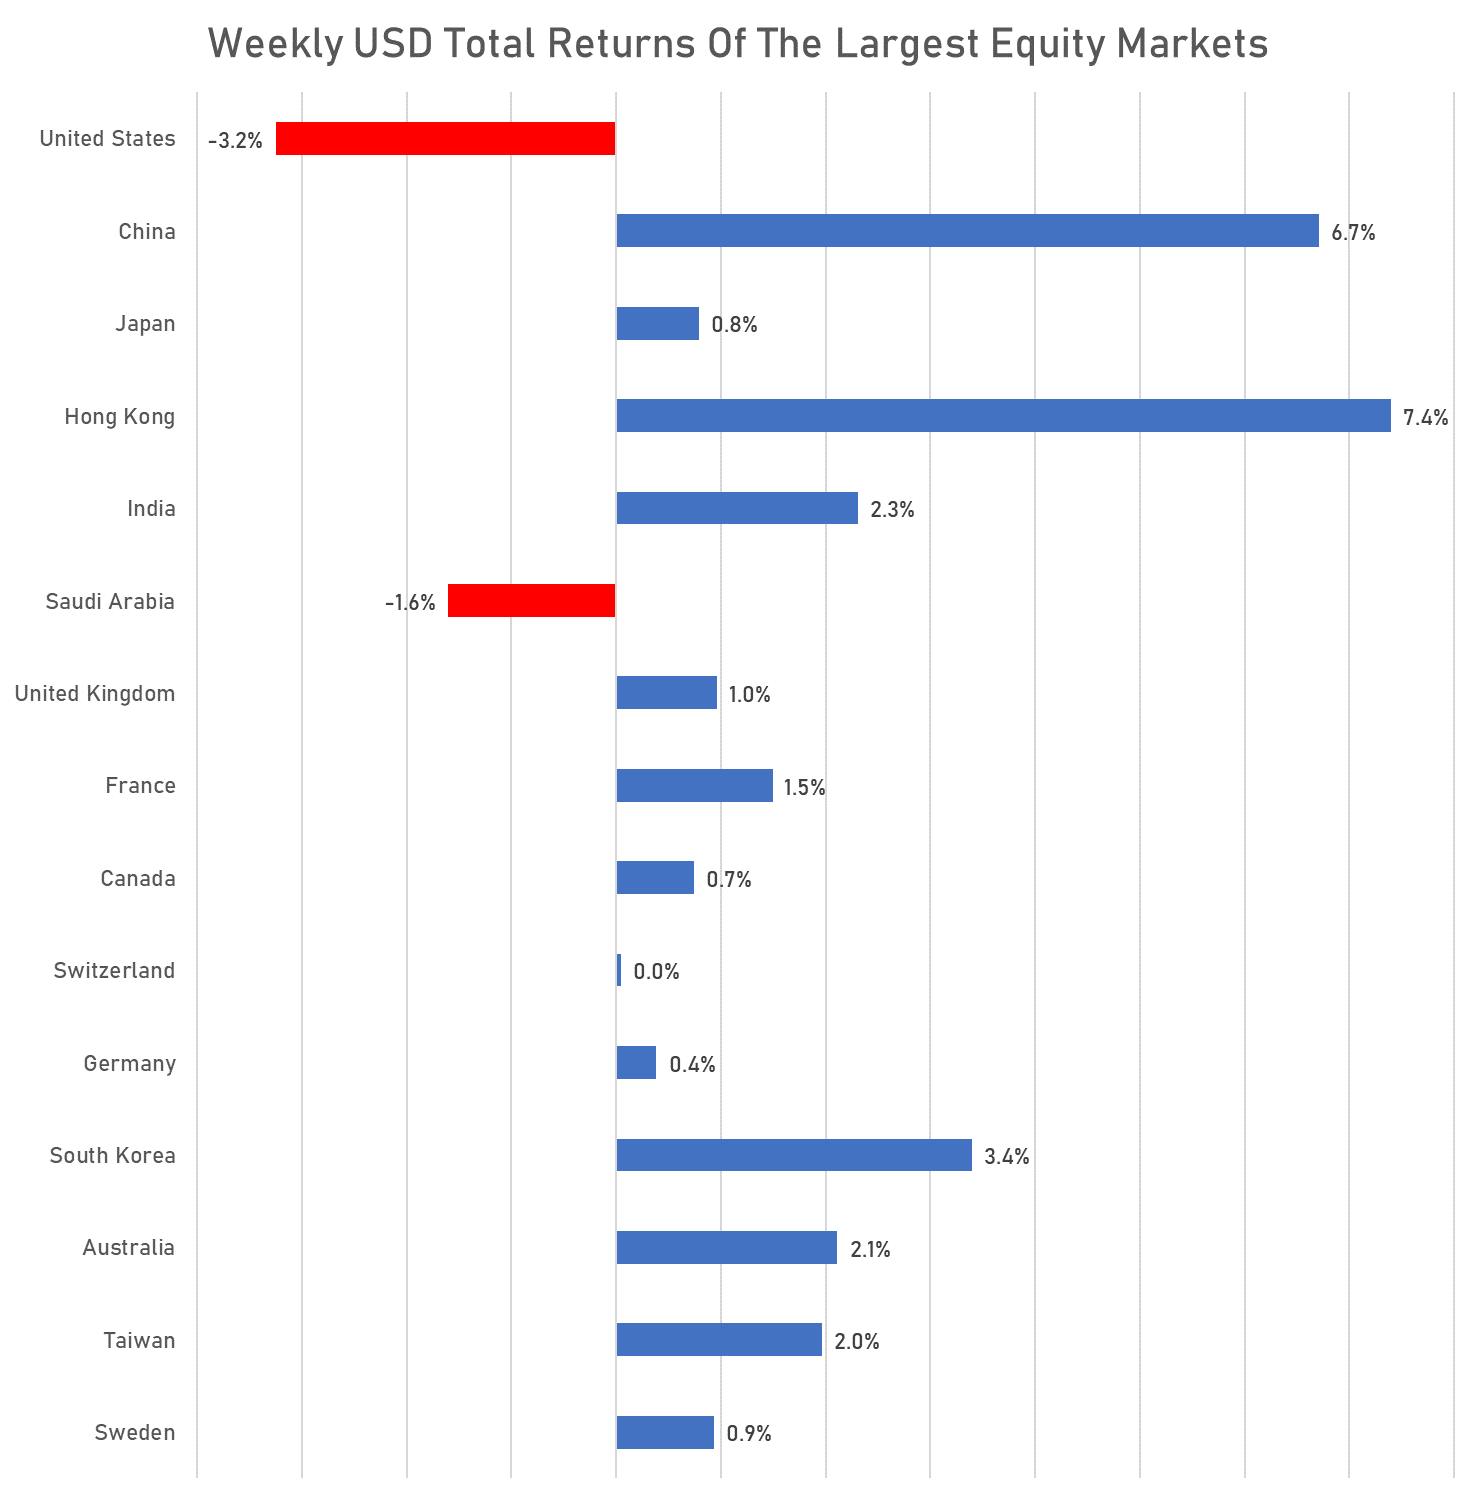
WEEKLY TOTAL RETURNS OF MAJOR GLOBAL EQUITY MARKETS
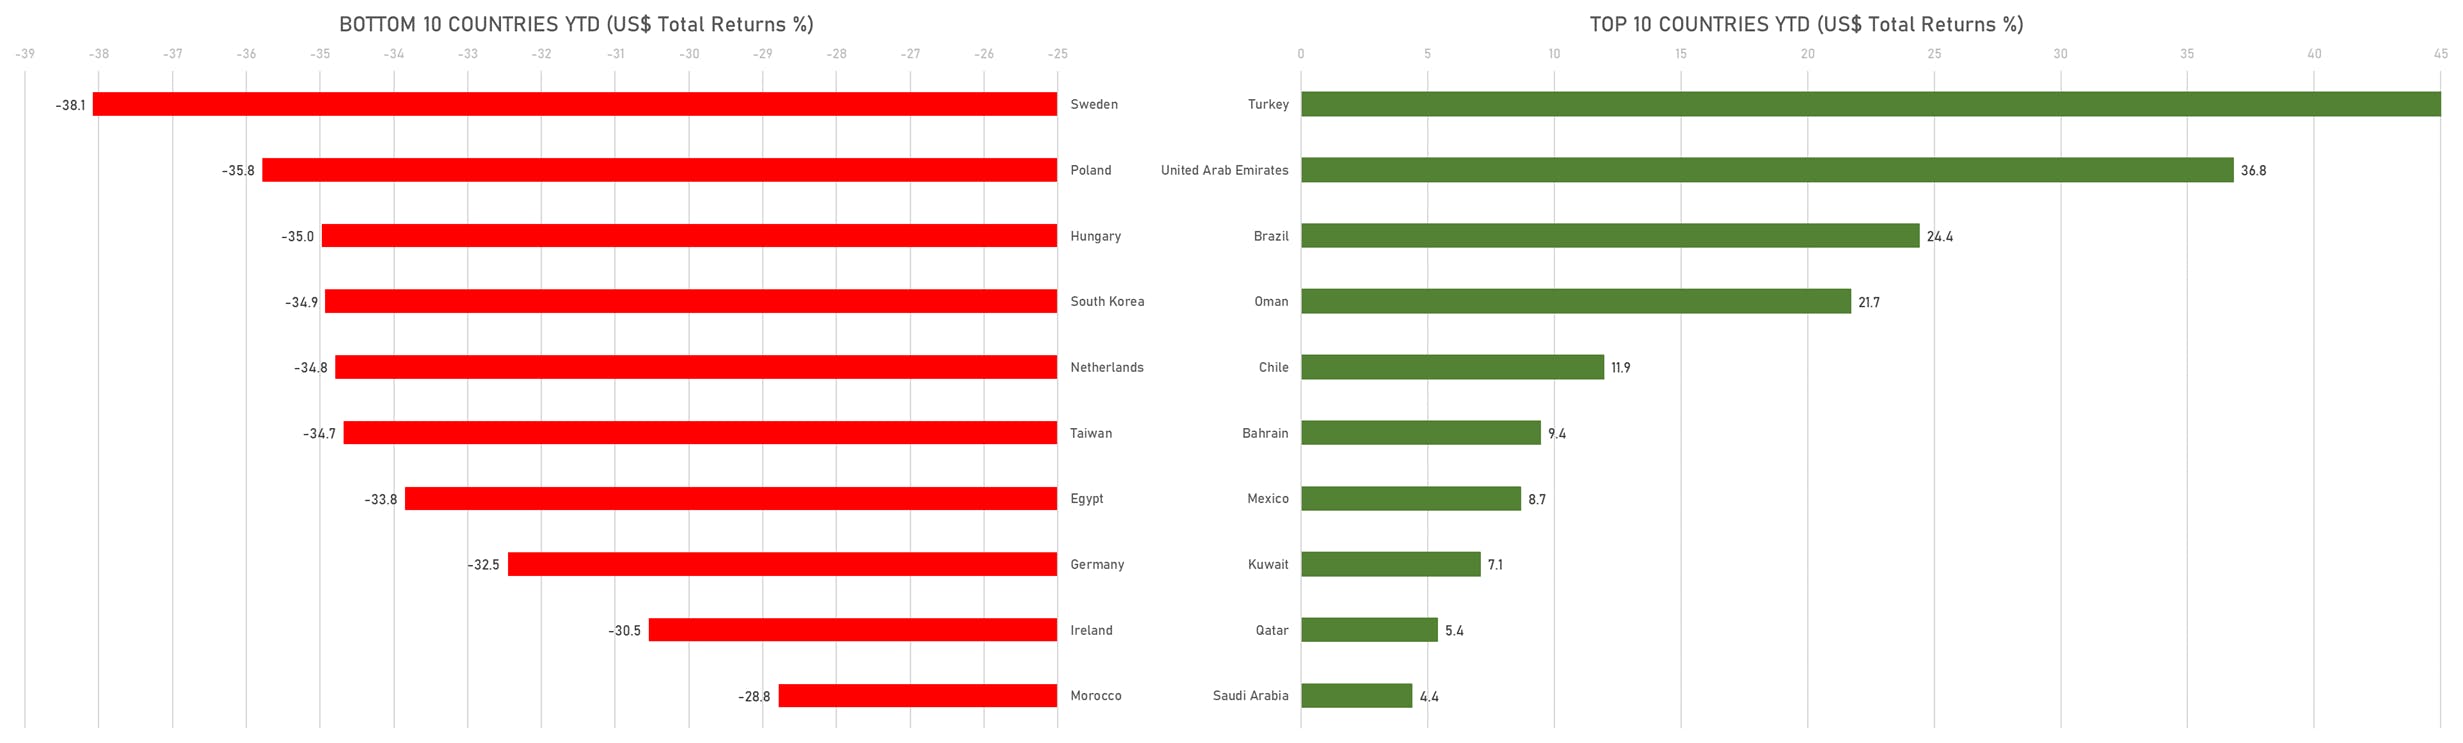
TOP / BOTTOM PERFORMING WORLD MARKETS YTD
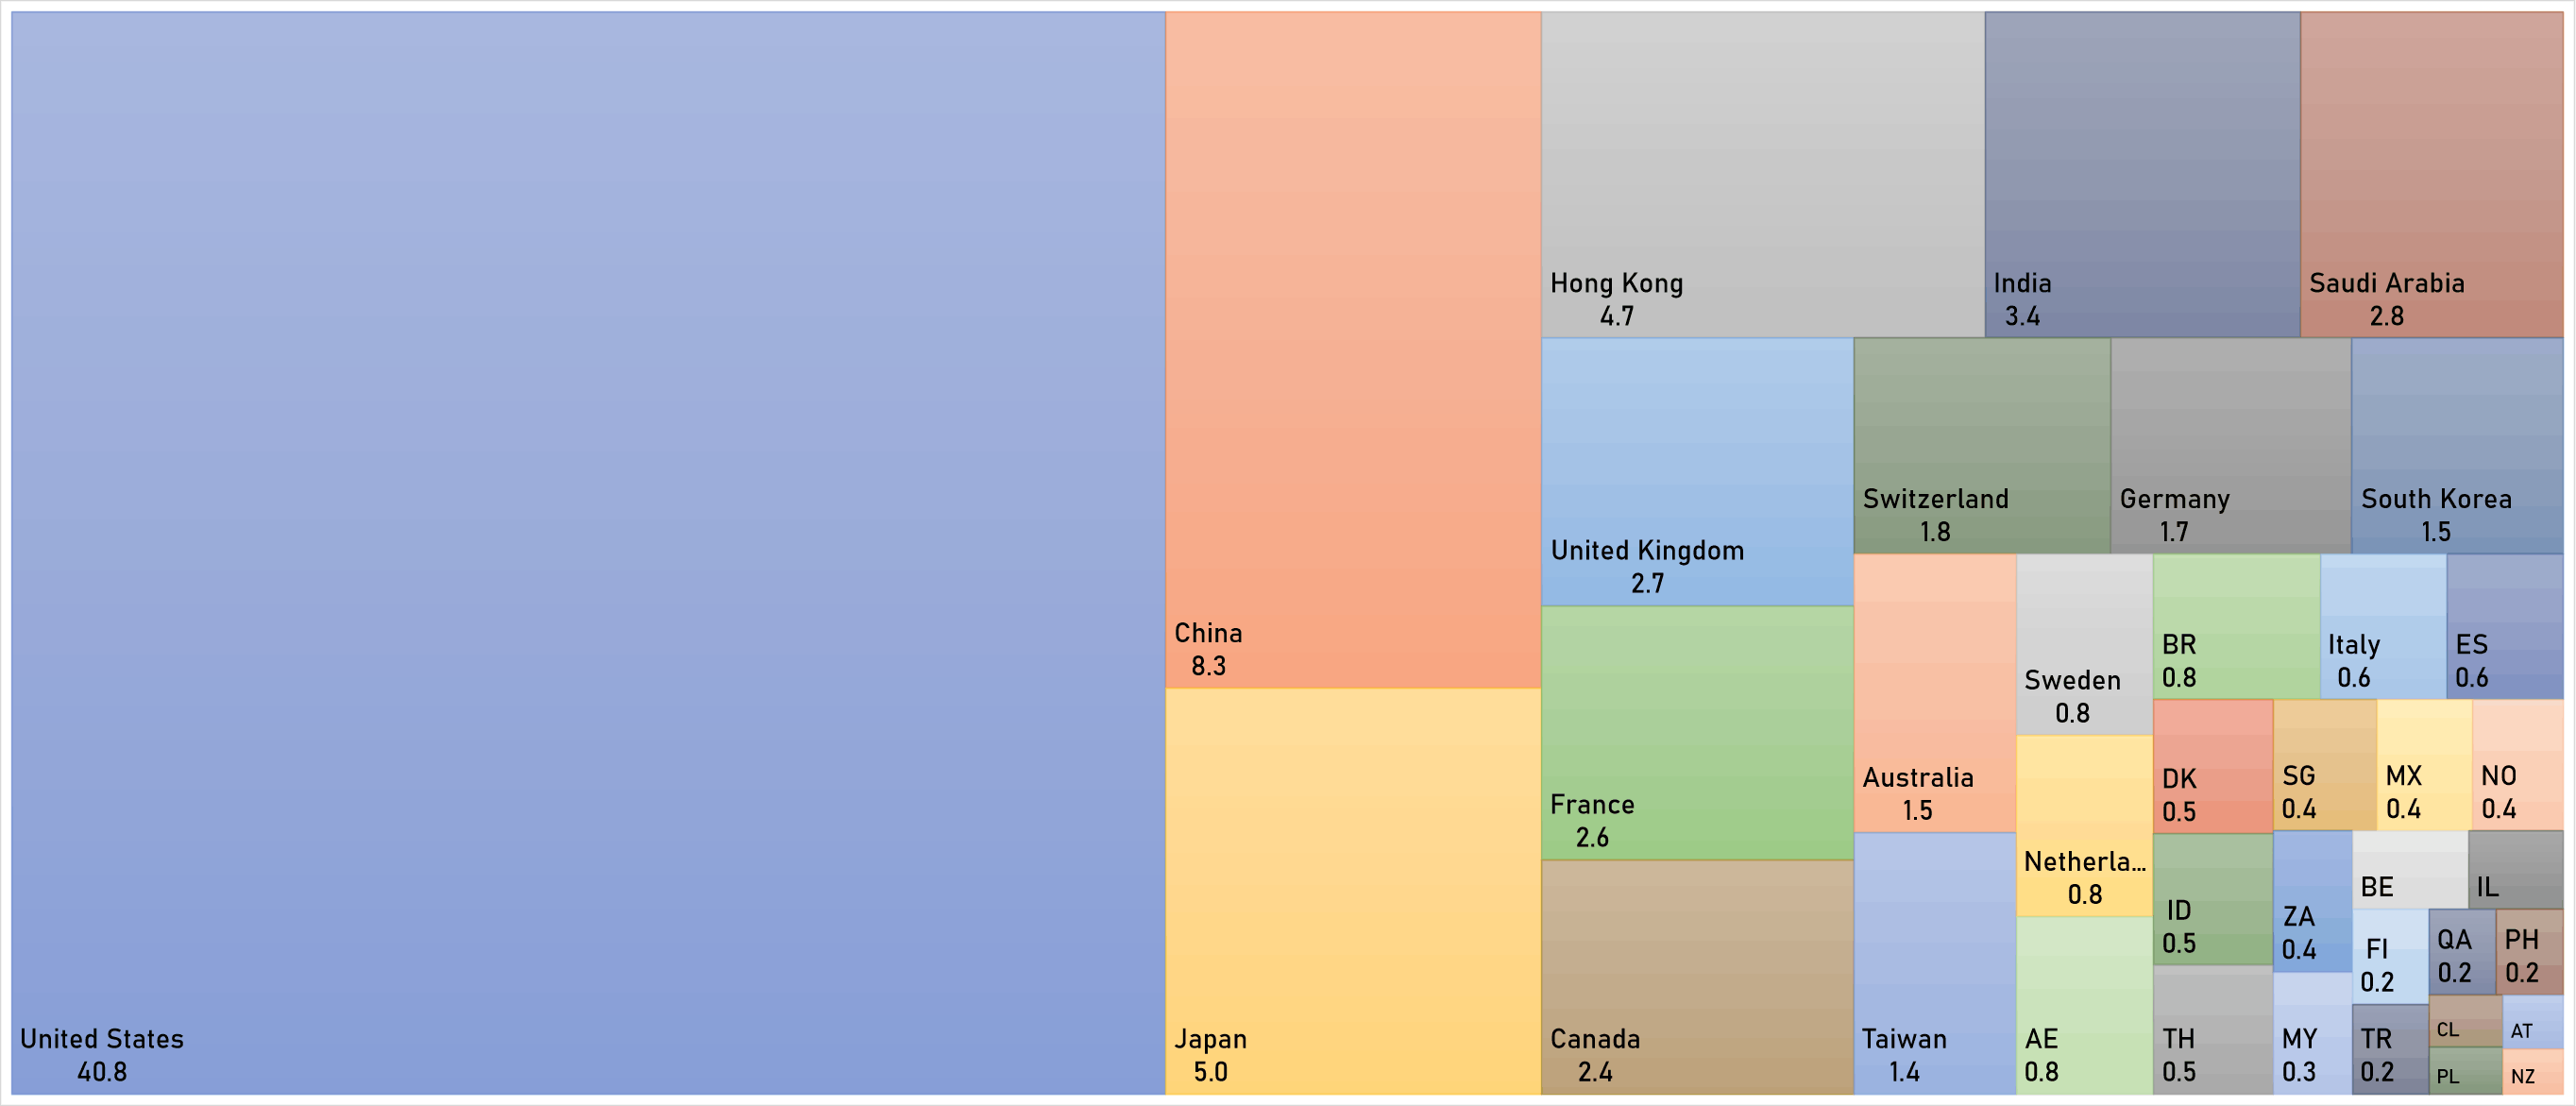
WORLD MARKET CAPITALIZATION (US$ Trillion)