Equities
Tremendous Rise In US Equities As CPI Print Brings Hopes Of A Soft Landing, Shorter Hiking Cycle
Chinese equities continued their rebound this week, largely driven by a fear of missing out, as most observers point out that the most likely time for a change of covid policies will be after the two sessions in March 2023
Published ET
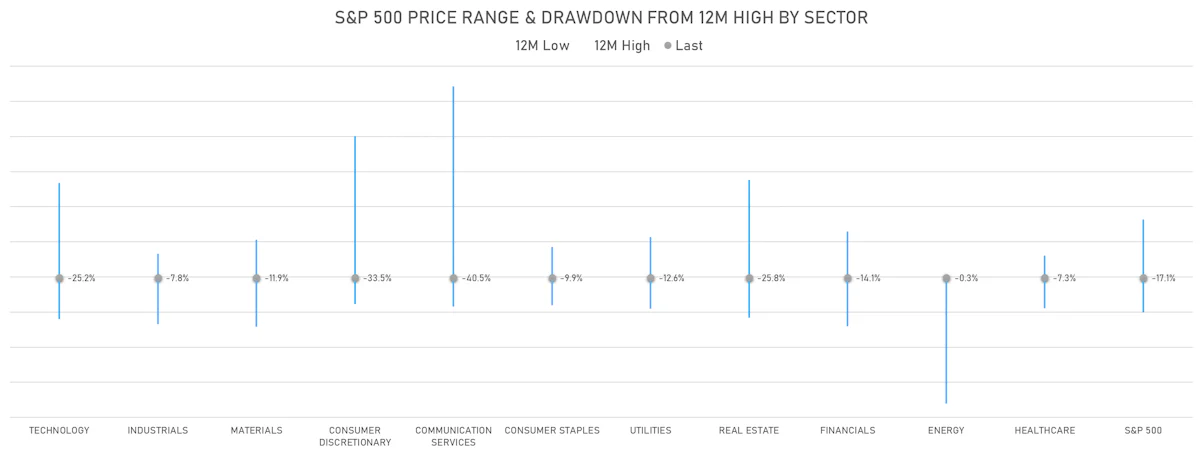
S&P 500 Current 12M Drawdowns By Sector | Sources: ϕpost, Refinitiv data
DAILY SUMMARY
- Daily performance of US indices: S&P 500 up 0.92%; Nasdaq Composite up 1.88%; Wilshire 5000 up 1.81%
- 62.8% of S&P 500 stocks were up today, with 52.7% of stocks above their 200-day moving average (DMA) and 81.5% above their 50-DMA
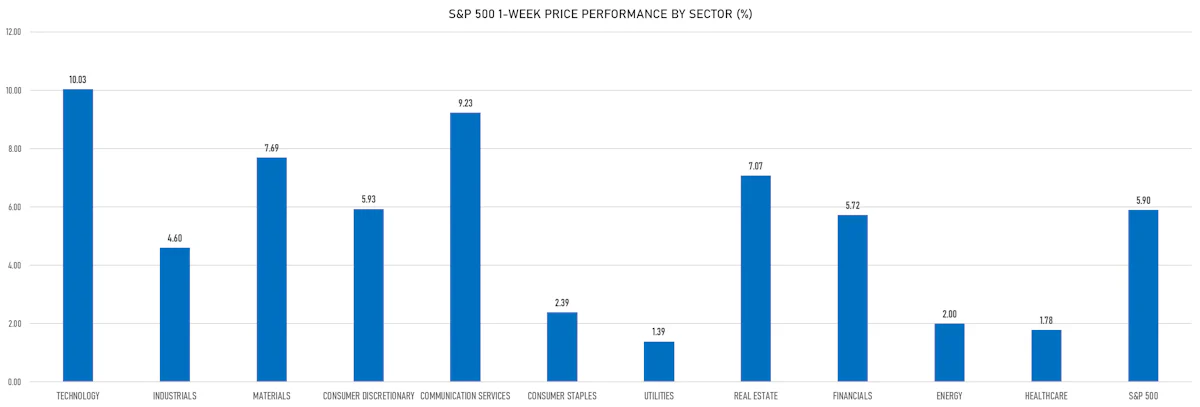
- Top performing sectors in the S&P 500: energy up 3.06% and communication services up 2.48%
- Bottom performing sectors in the S&P 500: healthcare down -1.28% and utilities down -1.14%
- The number of shares in the S&P 500 traded today was 761m for a total turnover of US$ 75 bn
- The S&P 500 Value Index was up 0.3%, while the S&P 500 Growth Index was up 1.6%; the S&P small caps index was up 0.4% and mid caps were up 0.4%
- The volume on CME's INX (S&P 500 Index) was 3032.9m (3-month z-score: 1.1); the 3-month average volume is 2518.5m and the 12-month range is 1340.2 - 4692.3m
- Daily performance of international indices: Europe Stoxx 600 up 0.09%; UK FTSE 100 down -0.78%; Hang Seng SH-SZ-HK 300 Index up 4.50%; Japan's TOPIX 500 up 2.22%
VOLATILITY TODAY
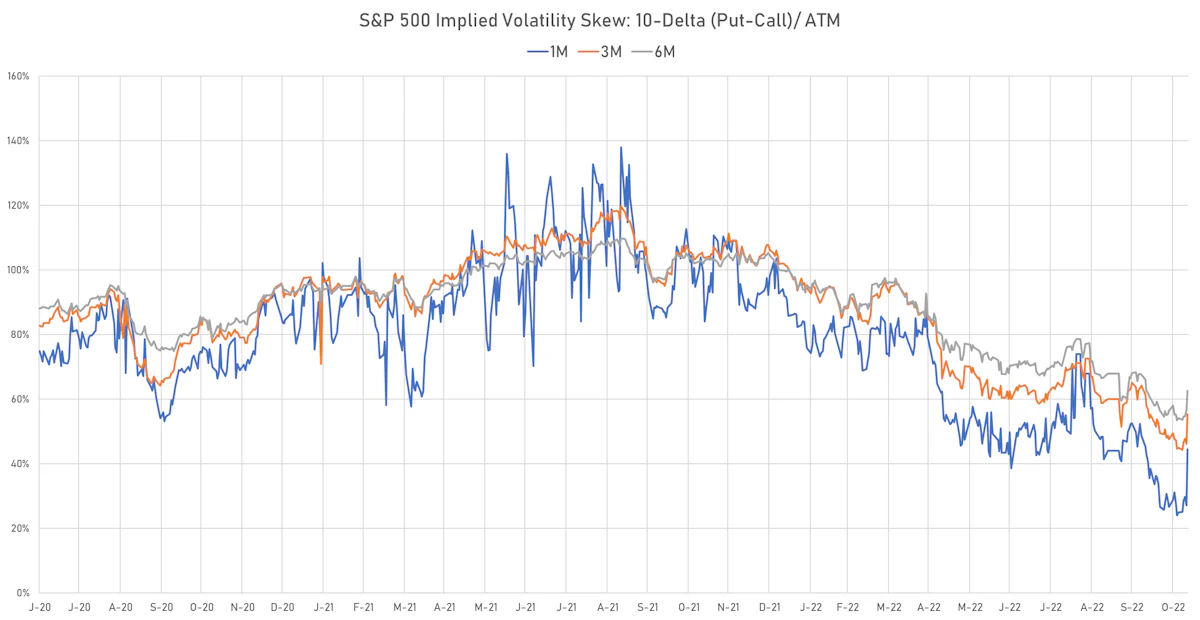
- 1-month at-the-money implied volatility on the S&P 500 at 21.3%, down from 22.7%
- 1-month at-the-money implied volatility on the STOXX Europe 600 at 16.3%, down from 16.3%
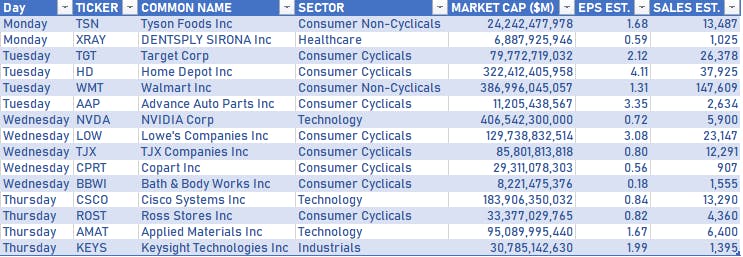
TOP US EARNINGS IN THE WEEK AHEAD
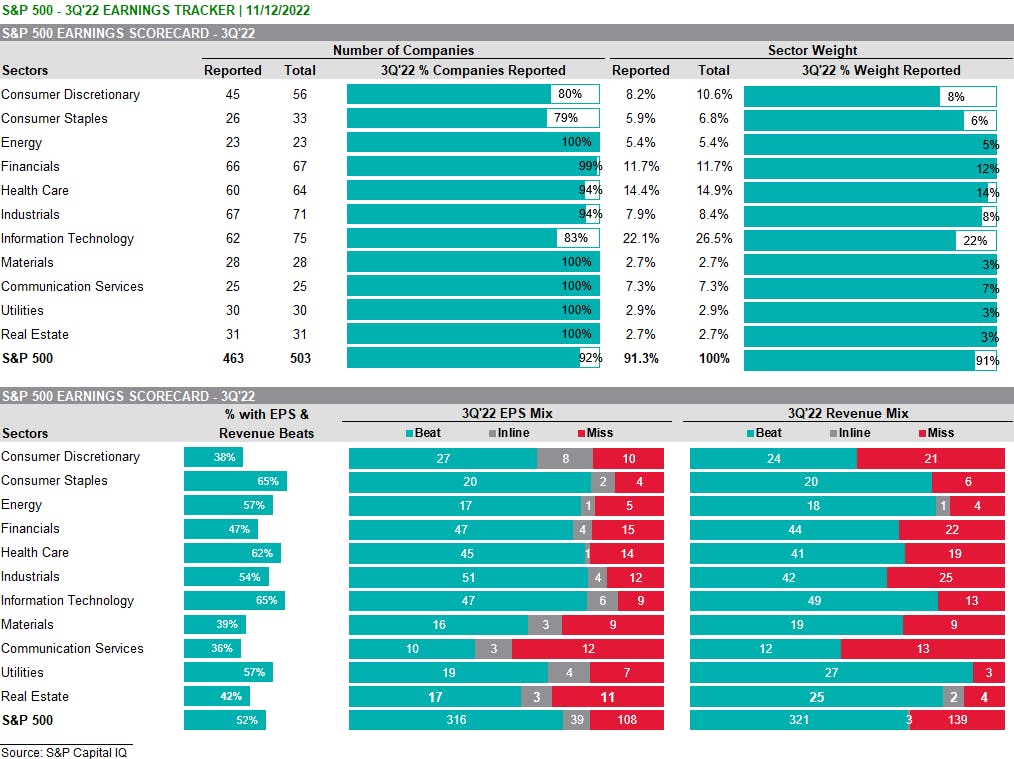
3Q22 US EARNINGS DASHBOARD
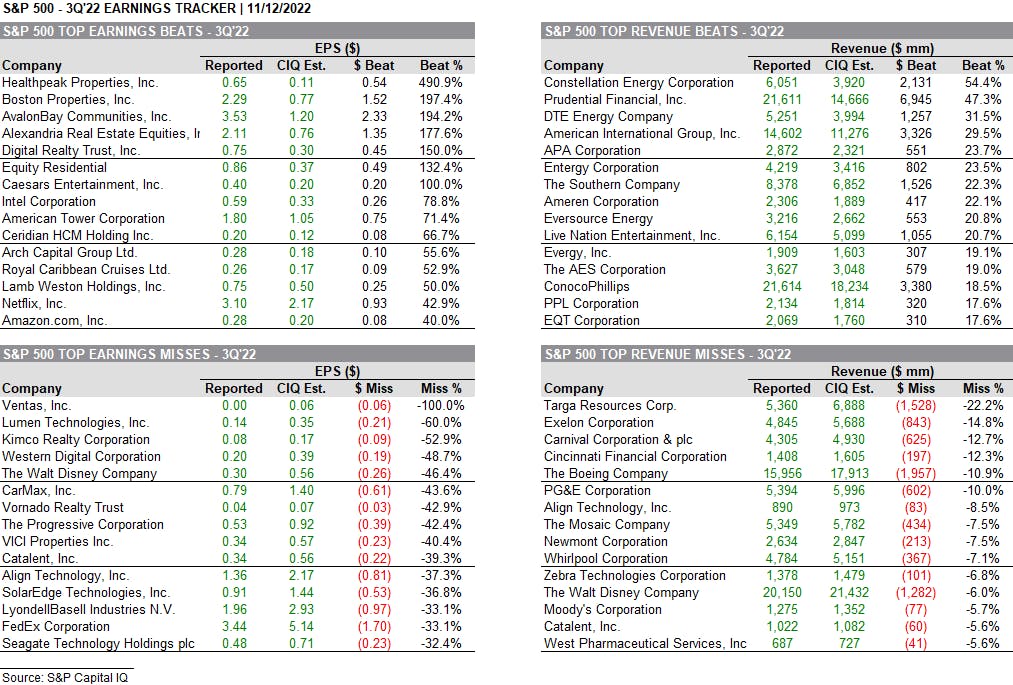
TOP BEATS & MISSES IN 3Q22
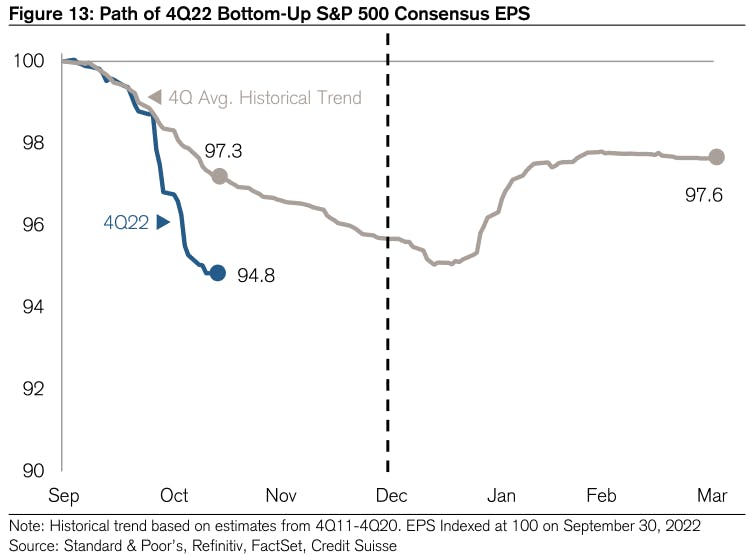
FOURTH QUARTER ESTIMATES TRENDING MUCH LOWER
TOP S&P 500 PERFORMERS THIS WEEK
- Solaredge Technologies Inc (SEDG), up 31.9% to $288.91 / YTD price return: +3.0% / 12-Month Price Range: $ 190.15-389.00 / Short interest (% of float): 3.4%; days to cover: 1.6
- T Rowe Price Group Inc (TROW), up 29.7% to $133.34 / YTD price return: -32.2% / 12-Month Price Range: $ 93.53-218.39 / Short interest (% of float): 8.5%; days to cover: 10.4
- DISH Network Corp (DISH), up 27.3% to $17.00 / YTD price return: -47.6% / 12-Month Price Range: $ 12.55-37.26 / Short interest (% of float): 11.0%; days to cover: 6.0
- Invesco Ltd (IVZ), up 25.7% to $19.77 / YTD price return: -14.1% / 12-Month Price Range: $ 13.20-26.46 / Short interest (% of float): 4.0%; days to cover: 2.9
- Meta Platforms Inc (META), up 24.5% to $113.02 / YTD price return: -66.4% / 12-Month Price Range: $ 88.10-353.82 / Short interest (% of float): 1.6%; days to cover: 0.8
- Caesars Entertainment Inc (CZR), up 22.2% to $52.12 / YTD price return: -44.3% / 12-Month Price Range: $ 31.31-106.69 / Short interest (% of float): 5.5%; days to cover: 2.3
- Mohawk Industries Inc (MHK), up 22.0% to $109.80 / YTD price return: -39.7% / 12-Month Price Range: $ 87.12-191.94 / Short interest (% of float): 4.2%; days to cover: 3.3
- PayPal Holdings Inc (PYPL), up 21.1% to $91.03 / YTD price return: -51.7% / 12-Month Price Range: $ 67.59-215.97 / Short interest (% of float): 1.8%; days to cover: 1.6
- Marketaxess Holdings Inc (MKTX), up 21.1% to $283.30 / YTD price return: -31.1% / 12-Month Price Range: $ 217.97-421.60 / Short interest (% of float): 2.3%; days to cover: 2.5
- Align Technology Inc (ALGN), up 21.0% to $218.98 / YTD price return: -66.7% / 12-Month Price Range: $ 172.29-698.77 / Short interest (% of float): 3.8%; days to cover: 2.5
BOTTOM S&P 500 PERFORMERS THIS WEEK
- Cboe Global Markets Inc (CBOE), down 10.3% to $115.10 / YTD price return: -11.7% / 12-Month Price Range: $ 104.06-134.22 / Short interest (% of float): 1.4%; days to cover: 2.4
- Mckesson Corp (MCK), down 10.2% to $356.21 / YTD price return: +43.3% / 12-Month Price Range: $ 215.27-401.57 / Short interest (% of float): 2.1%; days to cover: 3.5
- Dominion Energy Inc (D), down 8.1% to $61.66 / YTD price return: -21.5% / 12-Month Price Range: $ 59.67-88.78 / Short interest (% of float): 1.0%; days to cover: 1.8
- Everest Re Group Ltd (RE), down 7.3% to $308.71 / YTD price return: +12.7% / 12-Month Price Range: $ 244.68-336.85 / Short interest (% of float): 1.4%; days to cover: 1.5
- W R Berkley Corp (WRB), down 6.8% to $69.77 / YTD price return: +28.0% / 12-Month Price Range: $ 49.41-76.05 / Short interest (% of float): 1.1%; days to cover: 1.7
- Huntington Ingalls Industries Inc (HII), down 6.7% to $227.58 / YTD price return: +21.9% / 12-Month Price Range: $ 175.60-260.00 / Short interest (% of float): 1.7%; days to cover: 2.0
- Elevance Health Inc (ELV), down 6.7% to $491.36 / YTD price return: +6.0% / 12-Month Price Range: $ 392.40-549.35 / Short interest (% of float): 0.9%; days to cover: 2.2
- Take-Two Interactive Software Inc (TTWO), down 5.8% to $102.25 / YTD price return: -42.5% / 12-Month Price Range: $ 90.00-189.40 / Short interest (% of float): 3.0%; days to cover: 3.0
- Northrop Grumman Corp (NOC), down 5.8% to $492.70 / YTD price return: +27.3% / 12-Month Price Range: $ 345.91-556.17 / Short interest (% of float): 1.7%; days to cover: 2.5
- Cigna Corp (CI), down 5.7% to $303.82 / YTD price return: +32.3% / 12-Month Price Range: $ 191.74-331.04 / Short interest (% of float): 1.2%; days to cover: 1.9 (the stock is currently on the short sale restriction list)
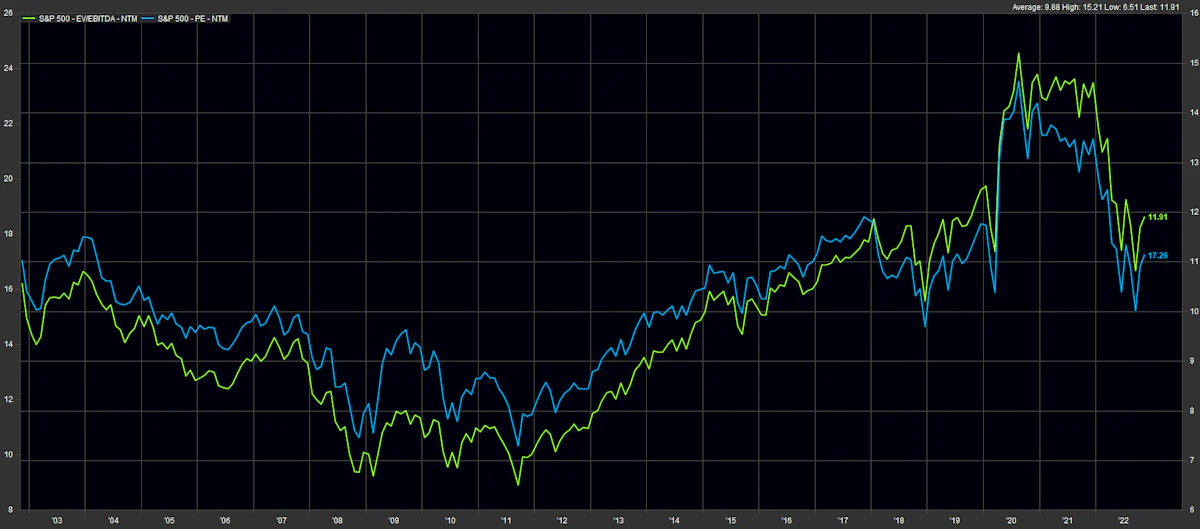
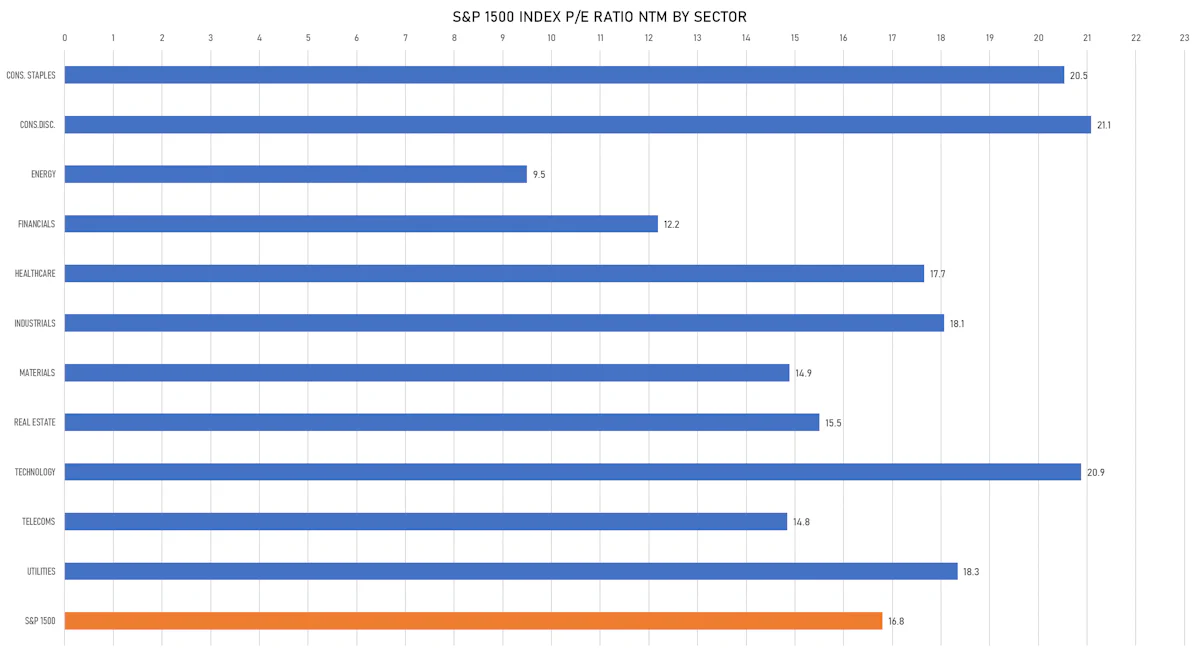
VALUATION MULTIPLES BY SECTORS
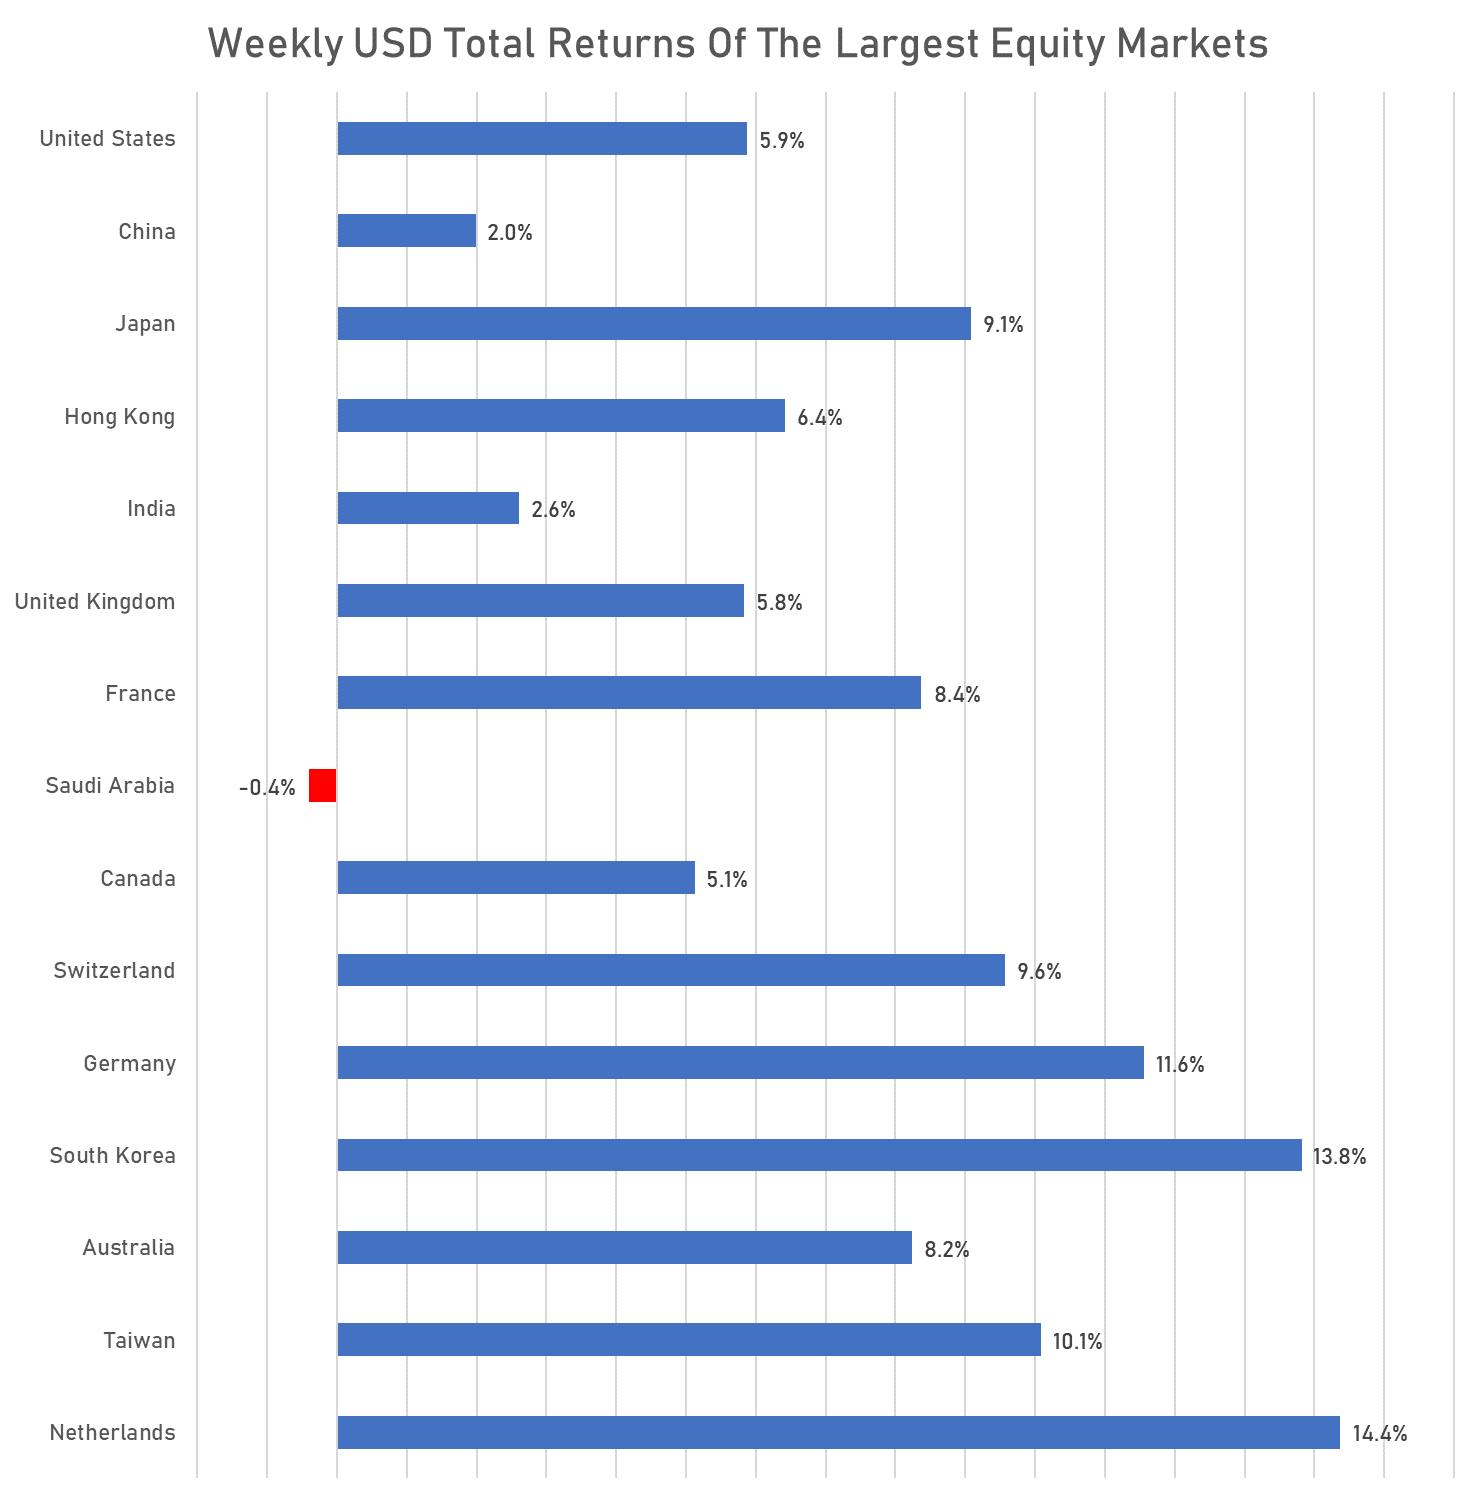
WEEKLY TOTAL RETURNS OF MAJOR GLOBAL EQUITY MARKETS
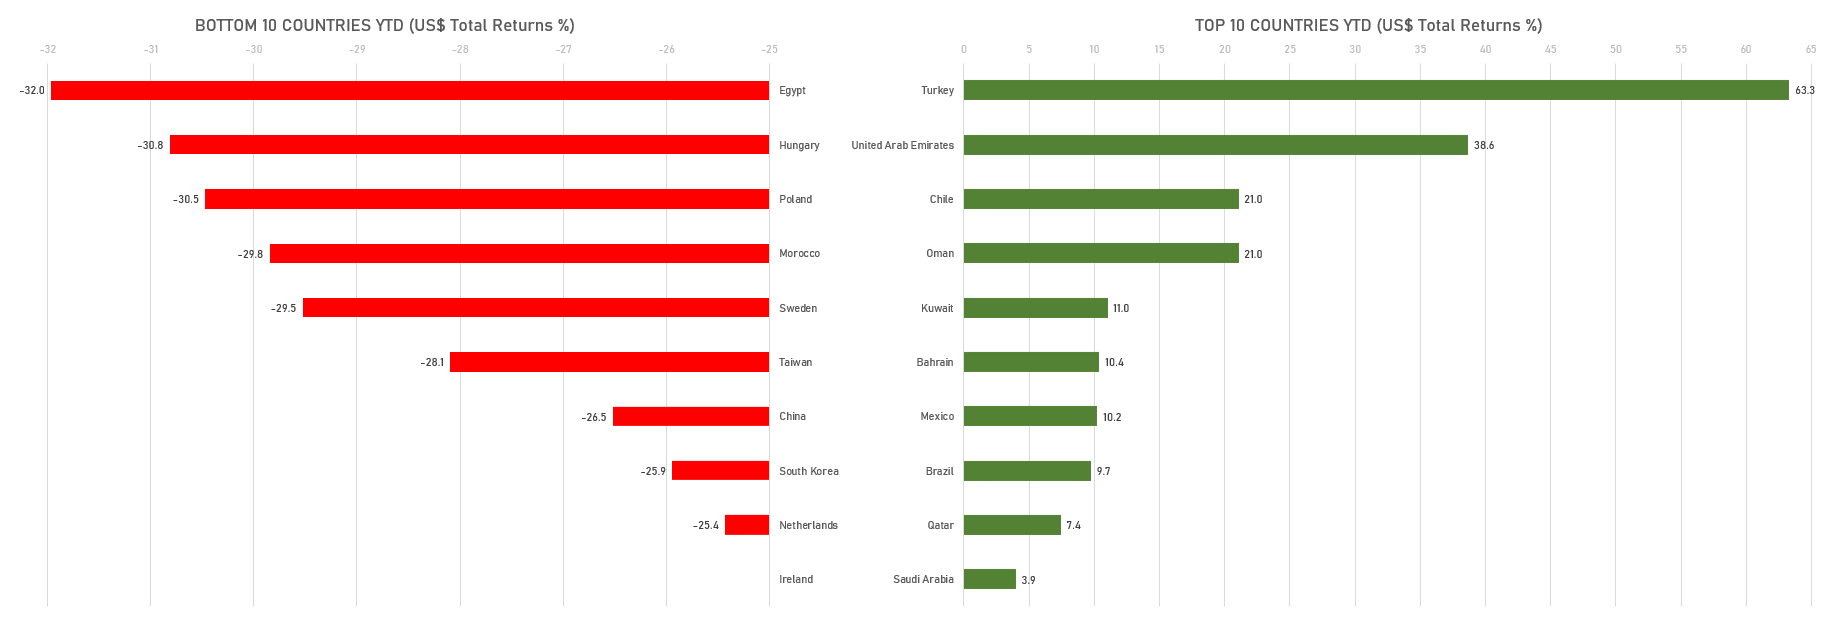
TOP / BOTTOM PERFORMING WORLD MARKETS YTD
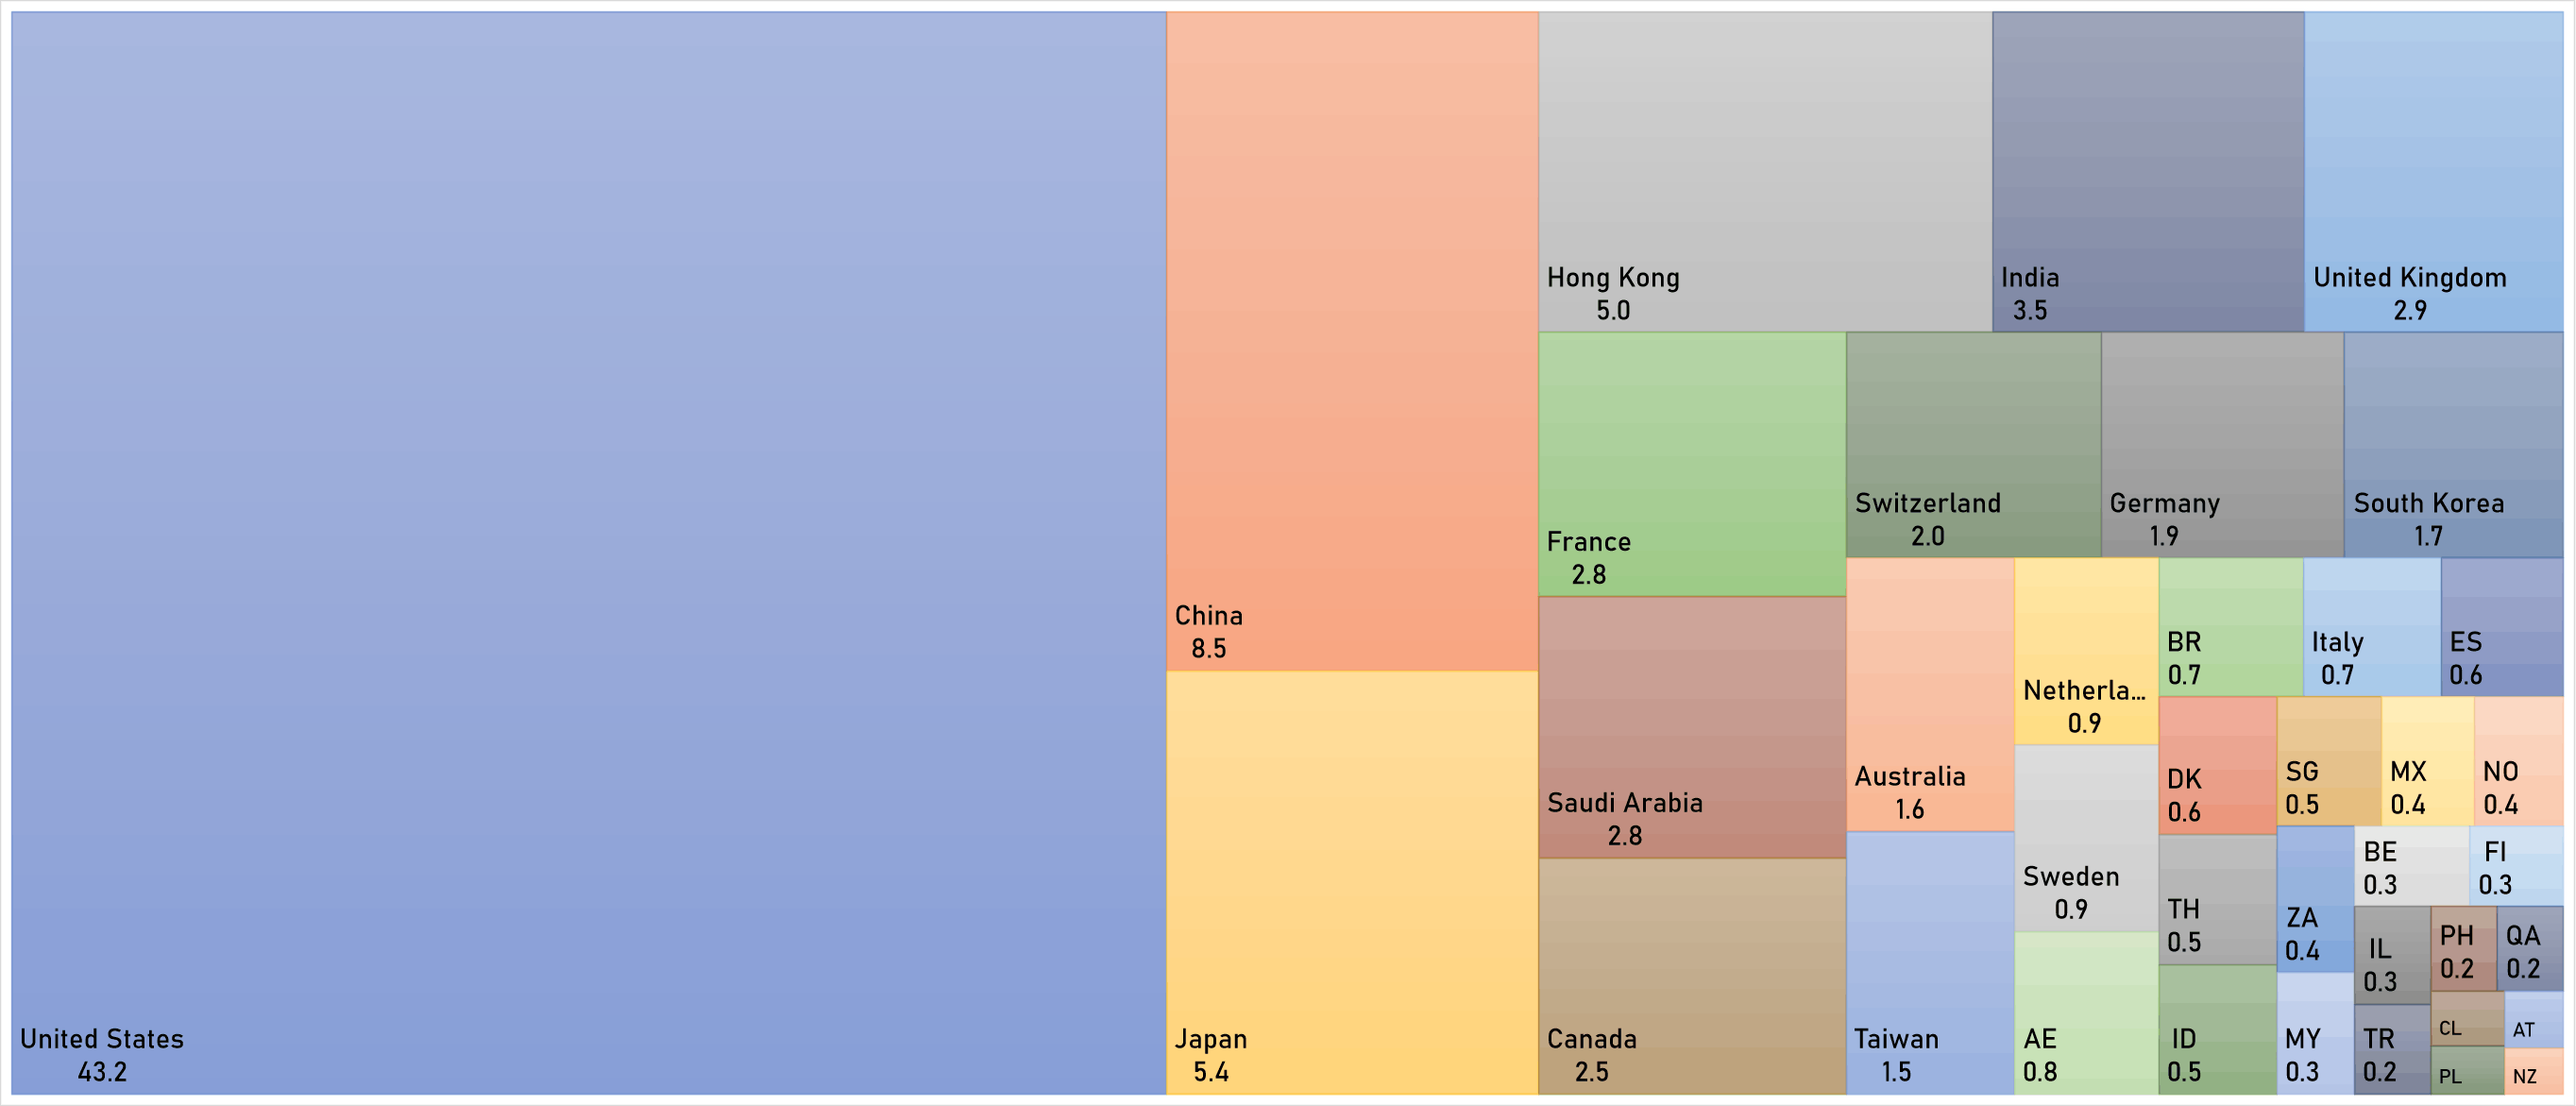
WORLD MARKET CAPITALIZATION (US$ Trillion)