Equities
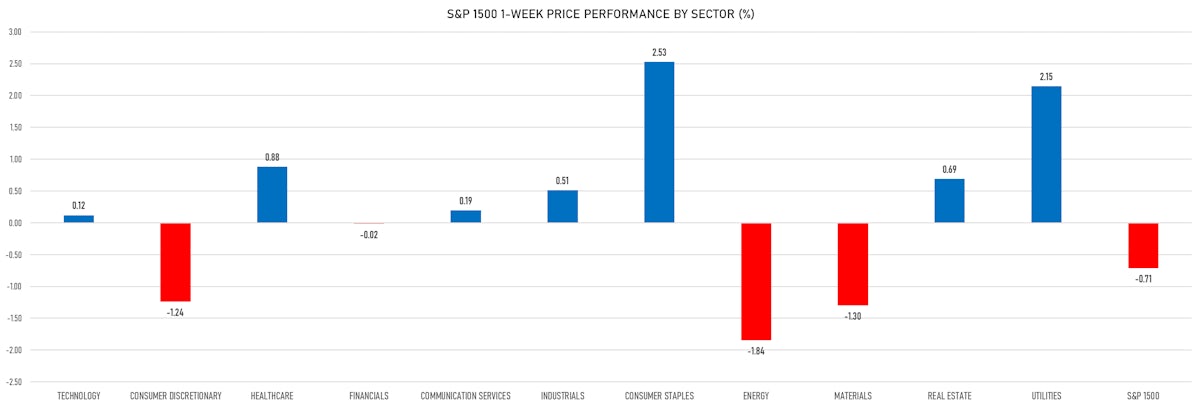
Mostly Poor Performance Across US Equities This Week, With Higher Rates And Falling 2023 EPS Forecasts Weighing
Looking at 2023 sell-side outlooks, it's worth noting that most firms don't see much upside for US equities from here: Credit Suisse's end of 2023 S&P 500 index forecast is at 4,050, Goldman Sachs at 4,000 and Jefferies at 4,200
Published ET
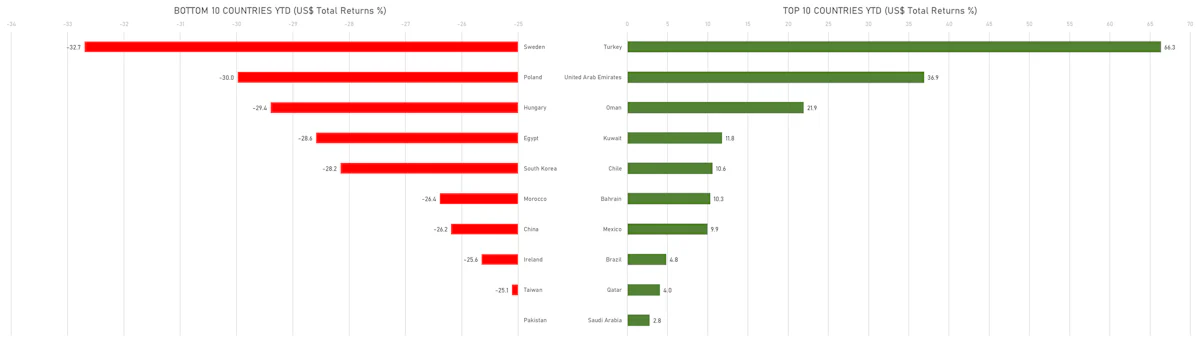
Year-To-Date USD Total Returns For Top & Bottom Performing Countries | Sources: ϕpost, FactSet data
DAILY SUMMARY
- Daily performance of US indices: S&P 500 up 0.48%; Nasdaq Composite up 0.01%; Wilshire 5000 up 0.57%
- 77.3% of S&P 500 stocks were up today, with 53.7% of stocks above their 200-day moving average (DMA) and 82.1% above their 50-DMA
- Top performing sectors in the S&P 500: utilities up 2.00% and real estate up 1.29%
- Bottom performing sectors in the S&P 500: energy down -0.90% and communication services down -0.35%
- The number of shares in the S&P 500 traded today was 659m for a total turnover of US$ 64 bn
- The S&P 500 Value Index was up 0.8%, while the S&P 500 Growth Index was up 0.1%; the S&P small caps index was up 0.7% and mid caps were up 0.8%
- The volume on CME's INX (S&P 500 Index) was 2236.0m (3-month z-score: -0.8); the 3-month average volume is 2563.8m and the 12-month range is 1340.2 - 4692.3m
- Daily performance of international indices: Europe Stoxx 600 up 1.16%; UK FTSE 100 up 0.53%; Hang Seng SH-SZ-HK 300 Index down -0.23%; Japan's TOPIX 500 up 0.02%
VOLATILITY TODAY
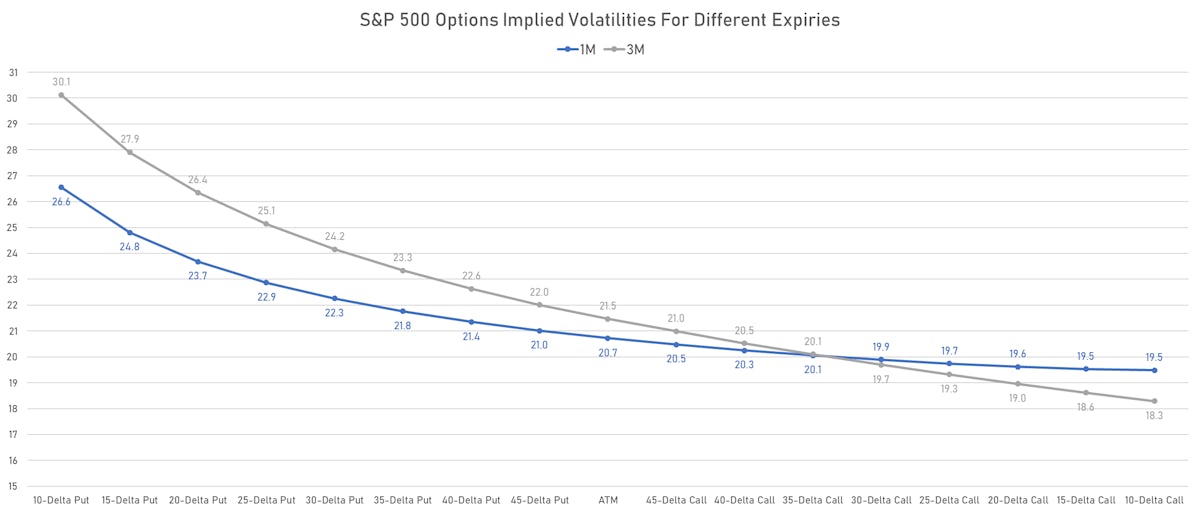
- 1-month at-the-money implied volatility on the S&P 500 at 20.7%, down from 21.3%
- 1-month at-the-money implied volatility on the STOXX Europe 600 at 16.1%, down from 16.7%
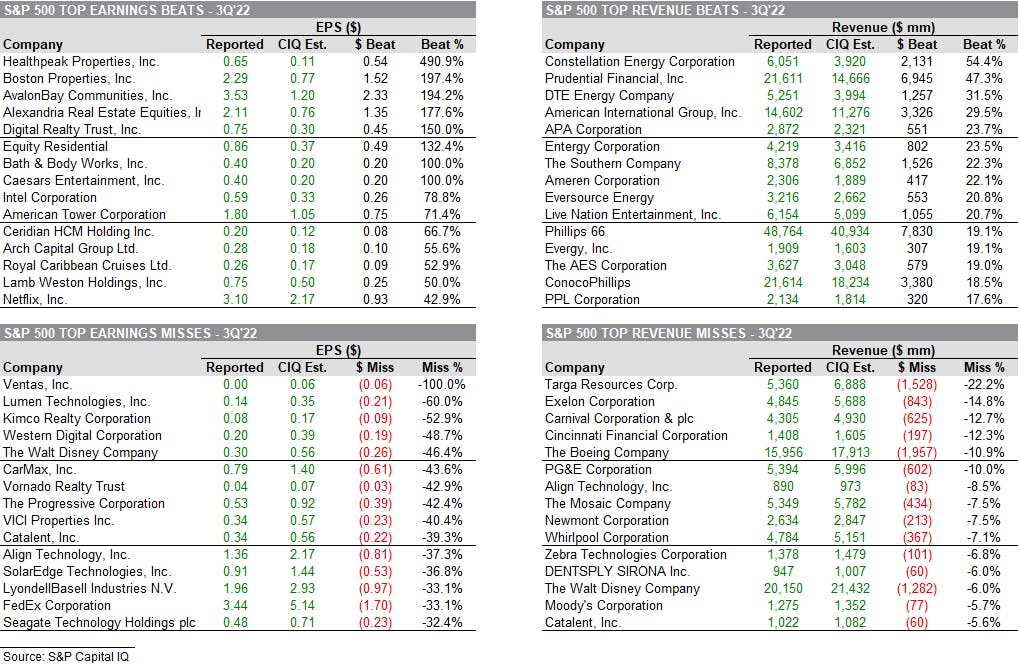
3Q22 EARNINGS DASHBOARD
![]()
TOP BEATS & MISSES IN 3Q22 EARNINGS
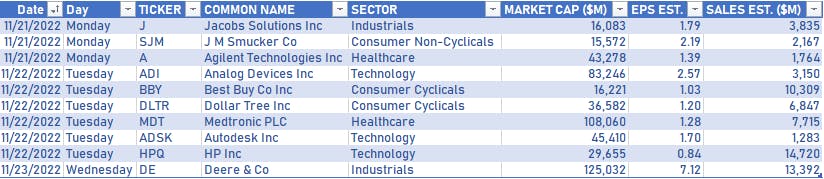
COMPANIES REPORTING IN THE WEEK AHEAD
TOP S&P 500 PERFORMERS THIS WEEK
- Ross Stores Inc (ROST), up 11.9% to $107.59 / YTD price return: -5.9% / 12-Month Price Range: $ 69.24-119.94 / Short interest (% of float): 2.2%; days to cover: 3.1
- Lincoln National Corp (LNC), up 7.1% to $37.73 / YTD price return: -44.7% / 12-Month Price Range: $ 32.60-76.40 / Short interest (% of float): 2.5%; days to cover: 2.3
- Cisco Systems Inc (CSCO), up 6.7% to $47.79 / YTD price return: -24.6% / 12-Month Price Range: $ 38.61-64.28 / Short interest (% of float): 0.9%; days to cover: 1.9
- Merck & Co Inc (MRK), up 6.4% to $104.23 / YTD price return: +36.0% / 12-Month Price Range: $ 71.50-104.23 / Short interest (% of float): 0.8%; days to cover: 2.2
- Bath & Body Works Inc (BBWI), up 6.2% to $38.23 / YTD price return: -45.2% / 12-Month Price Range: $ 25.80-82.00 / Short interest (% of float): 7.0%; days to cover: 5.2
- TJX Companies Inc (TJX), up 5.8% to $78.16 / YTD price return: +3.0% / 12-Month Price Range: $ 53.70-79.40 / Short interest (% of float): 1.0%; days to cover: 2.2
- Walmart Inc (WMT), up 5.4% to $150.23 / YTD price return: +3.8% / 12-Month Price Range: $ 117.28-160.76 / Short interest (% of float): 0.9%; days to cover: 2.1
- Biogen Inc (BIIB), up 4.6% to $302.89 / YTD price return: +26.2% / 12-Month Price Range: $ 187.22-305.26 / Short interest (% of float): 1.7%; days to cover: 1.1
- Arthur J. Gallagher & Co. (AJG), up 4.5% to $194.33 / YTD price return: +14.5% / 12-Month Price Range: $ 147.46-194.73 / Short interest (% of float): 1.0%; days to cover: 2.0
- Johnson & Johnson (JNJ), up 4.1% to $176.20 / YTD price return: +3.0% / 12-Month Price Range: $ 155.72-186.69 / Short interest (% of float): 0.5%; days to cover: 1.7
BOTTOM S&P 500 PERFORMERS THIS WEEK
- Advance Auto Parts Inc (AAP), down 20.9% to $147.50 / YTD price return: -38.5% / 12-Month Price Range: $ 147.50-244.51 / Short interest (% of float): 5.3%; days to cover: 4.2
- Albemarle Corp (ALB), down 14.9% to $276.98 / YTD price return: +18.5% / 12-Month Price Range: $ 169.95-334.25 / Short interest (% of float): 1.8%; days to cover: 1.6
- Live Nation Entertainment Inc (LYV), down 13.7% to $66.21 / YTD price return: -44.7% / 12-Month Price Range: $ 66.21-126.79 / Short interest (% of float): 8.1%; days to cover: 7.7
- DISH Network Corp (DISH), down 10.4% to $15.23 / YTD price return: -53.1% / 12-Month Price Range: $ 12.55-37.26 / Short interest (% of float): 11.0%; days to cover: 6.0
- Warner Bros Discovery Inc (WBD), down 9.0% to $10.77 / YTD price return: -54.2% / 12-Month Price Range: $ 9.52-31.55 / Short interest (% of float): 4.2%; days to cover: 4.3
- Lam Research Corp (LRCX), down 8.8% to $456.70 / YTD price return: -36.5% / 12-Month Price Range: $ 299.63-731.47 / Short interest (% of float): 2.4%; days to cover: 1.4
- Catalent Inc (CTLT), down 8.8% to $43.04 / YTD price return: -66.4% / 12-Month Price Range: $ 40.73-136.13 / Short interest (% of float): 2.3%; days to cover: 2.1
- Autodesk Inc (ADSK), down 8.1% to $210.37 / YTD price return: -25.2% / 12-Month Price Range: $ 163.20-330.96 / Short interest (% of float): 1.3%; days to cover: 2.1
- Tesla Inc (TSLA), down 8.1% to $180.19 / YTD price return: -48.8% / 12-Month Price Range: $ 177.14-402.66 / Short interest (% of float): 2.9%; days to cover: 1.0
- LyondellBasell Industries NV (LYB), down 7.6% to $82.30 / YTD price return: -6.6% / 12-Month Price Range: $ 71.50-112.53 / Short interest (% of float): 2.2%; days to cover: 2.2
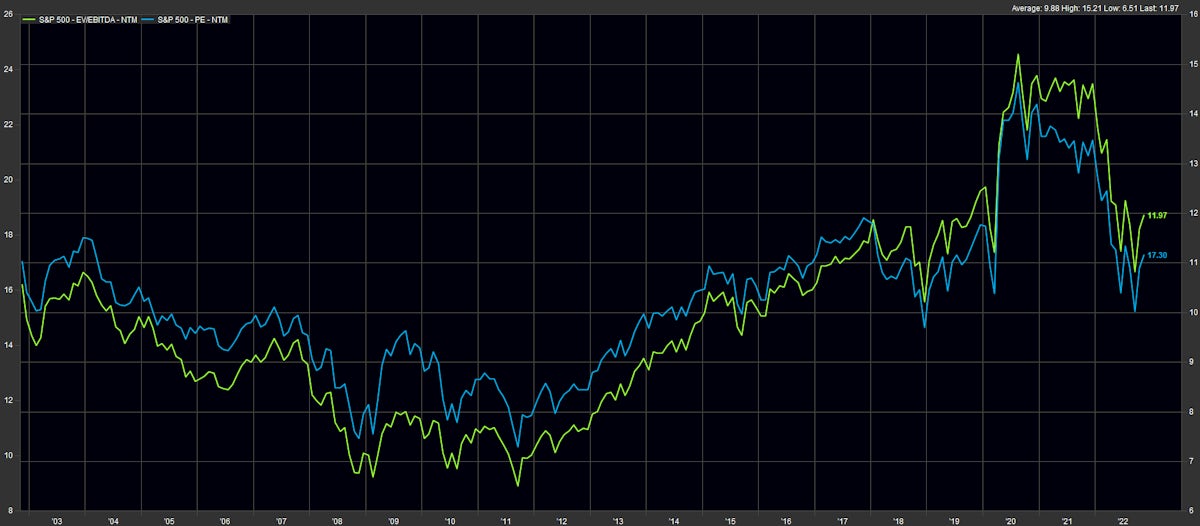
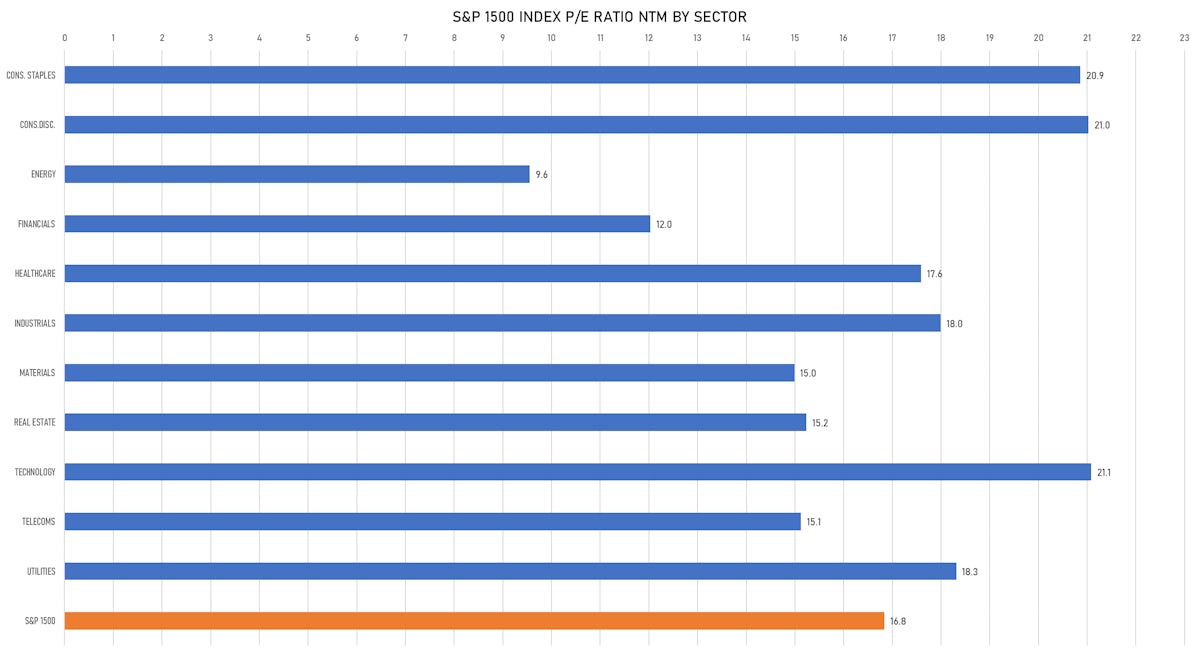
VALUATION MULTIPLES BY SECTORS
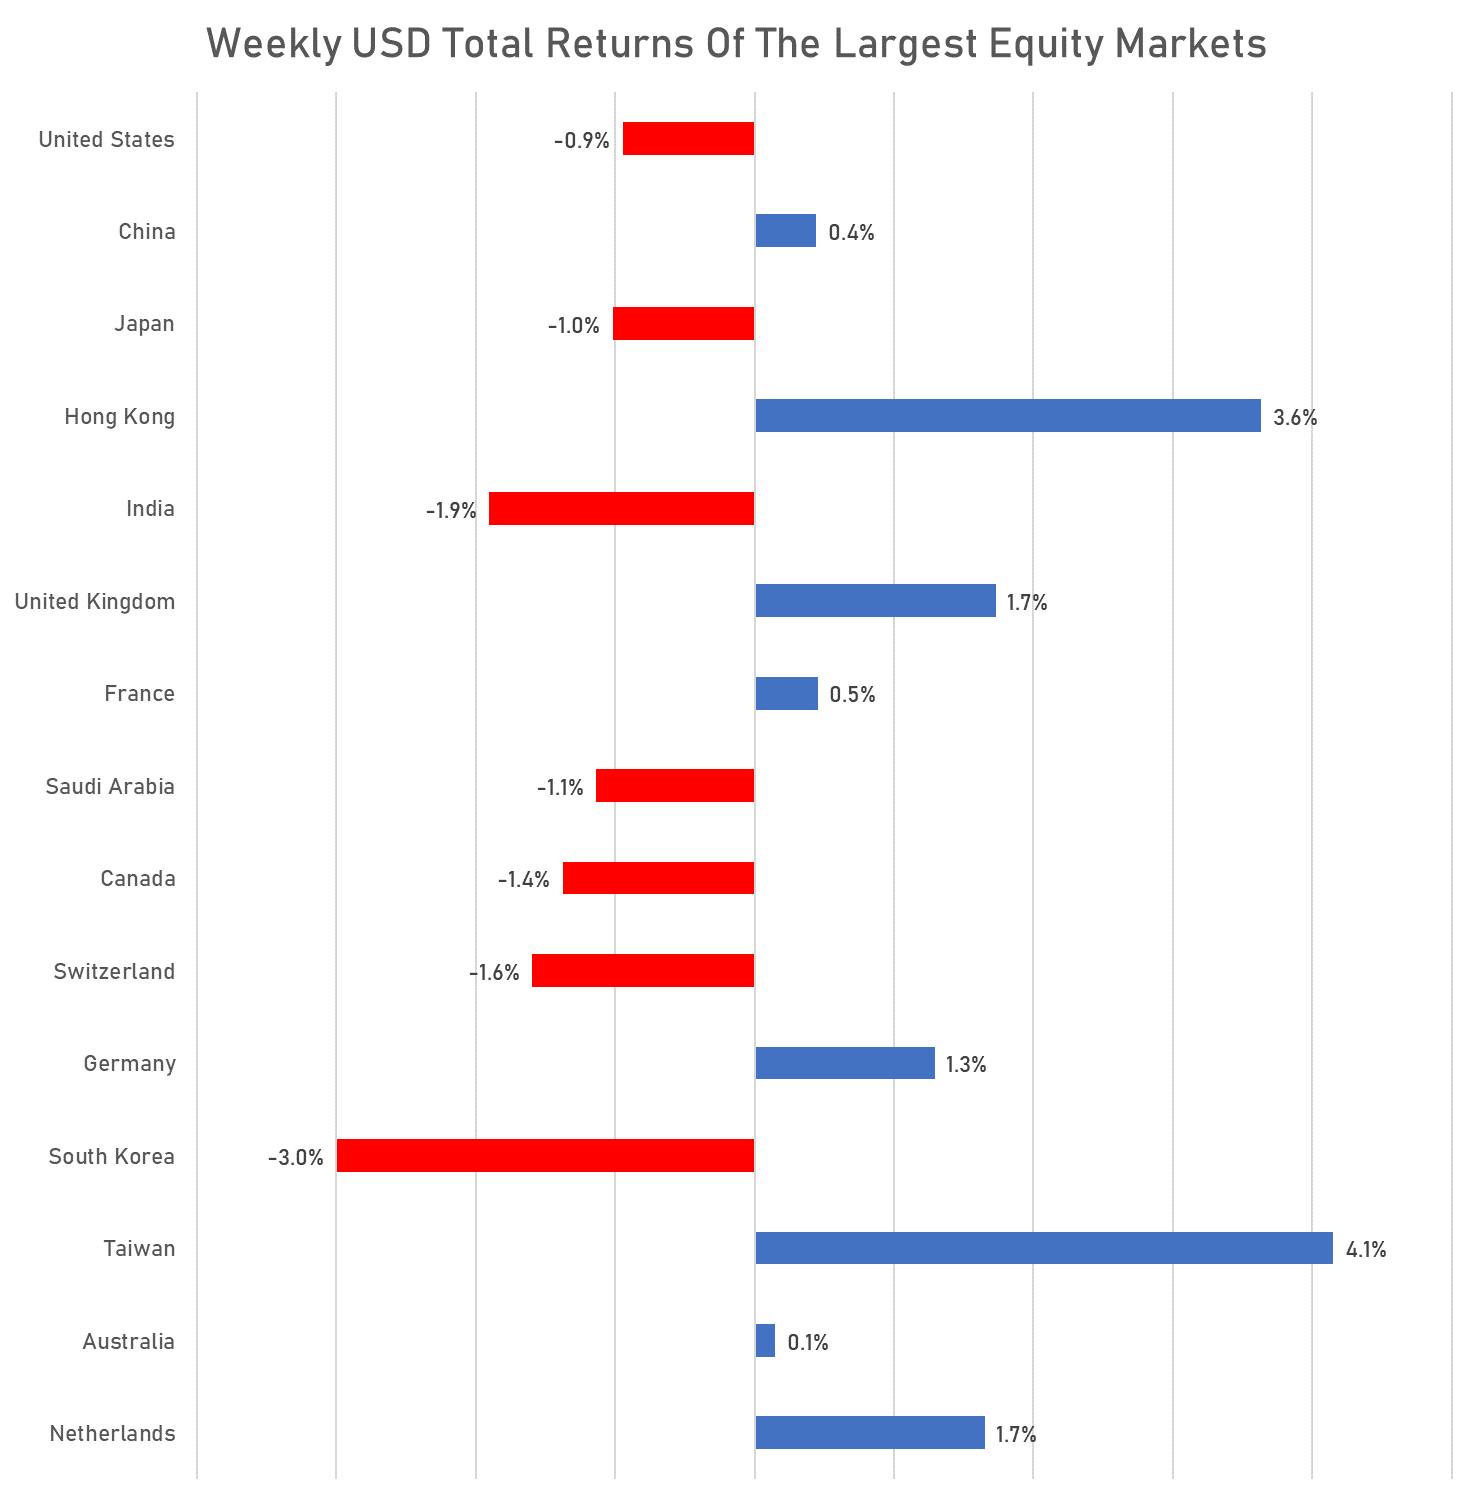
WEEKLY TOTAL RETURNS OF MAJOR GLOBAL EQUITY MARKETS
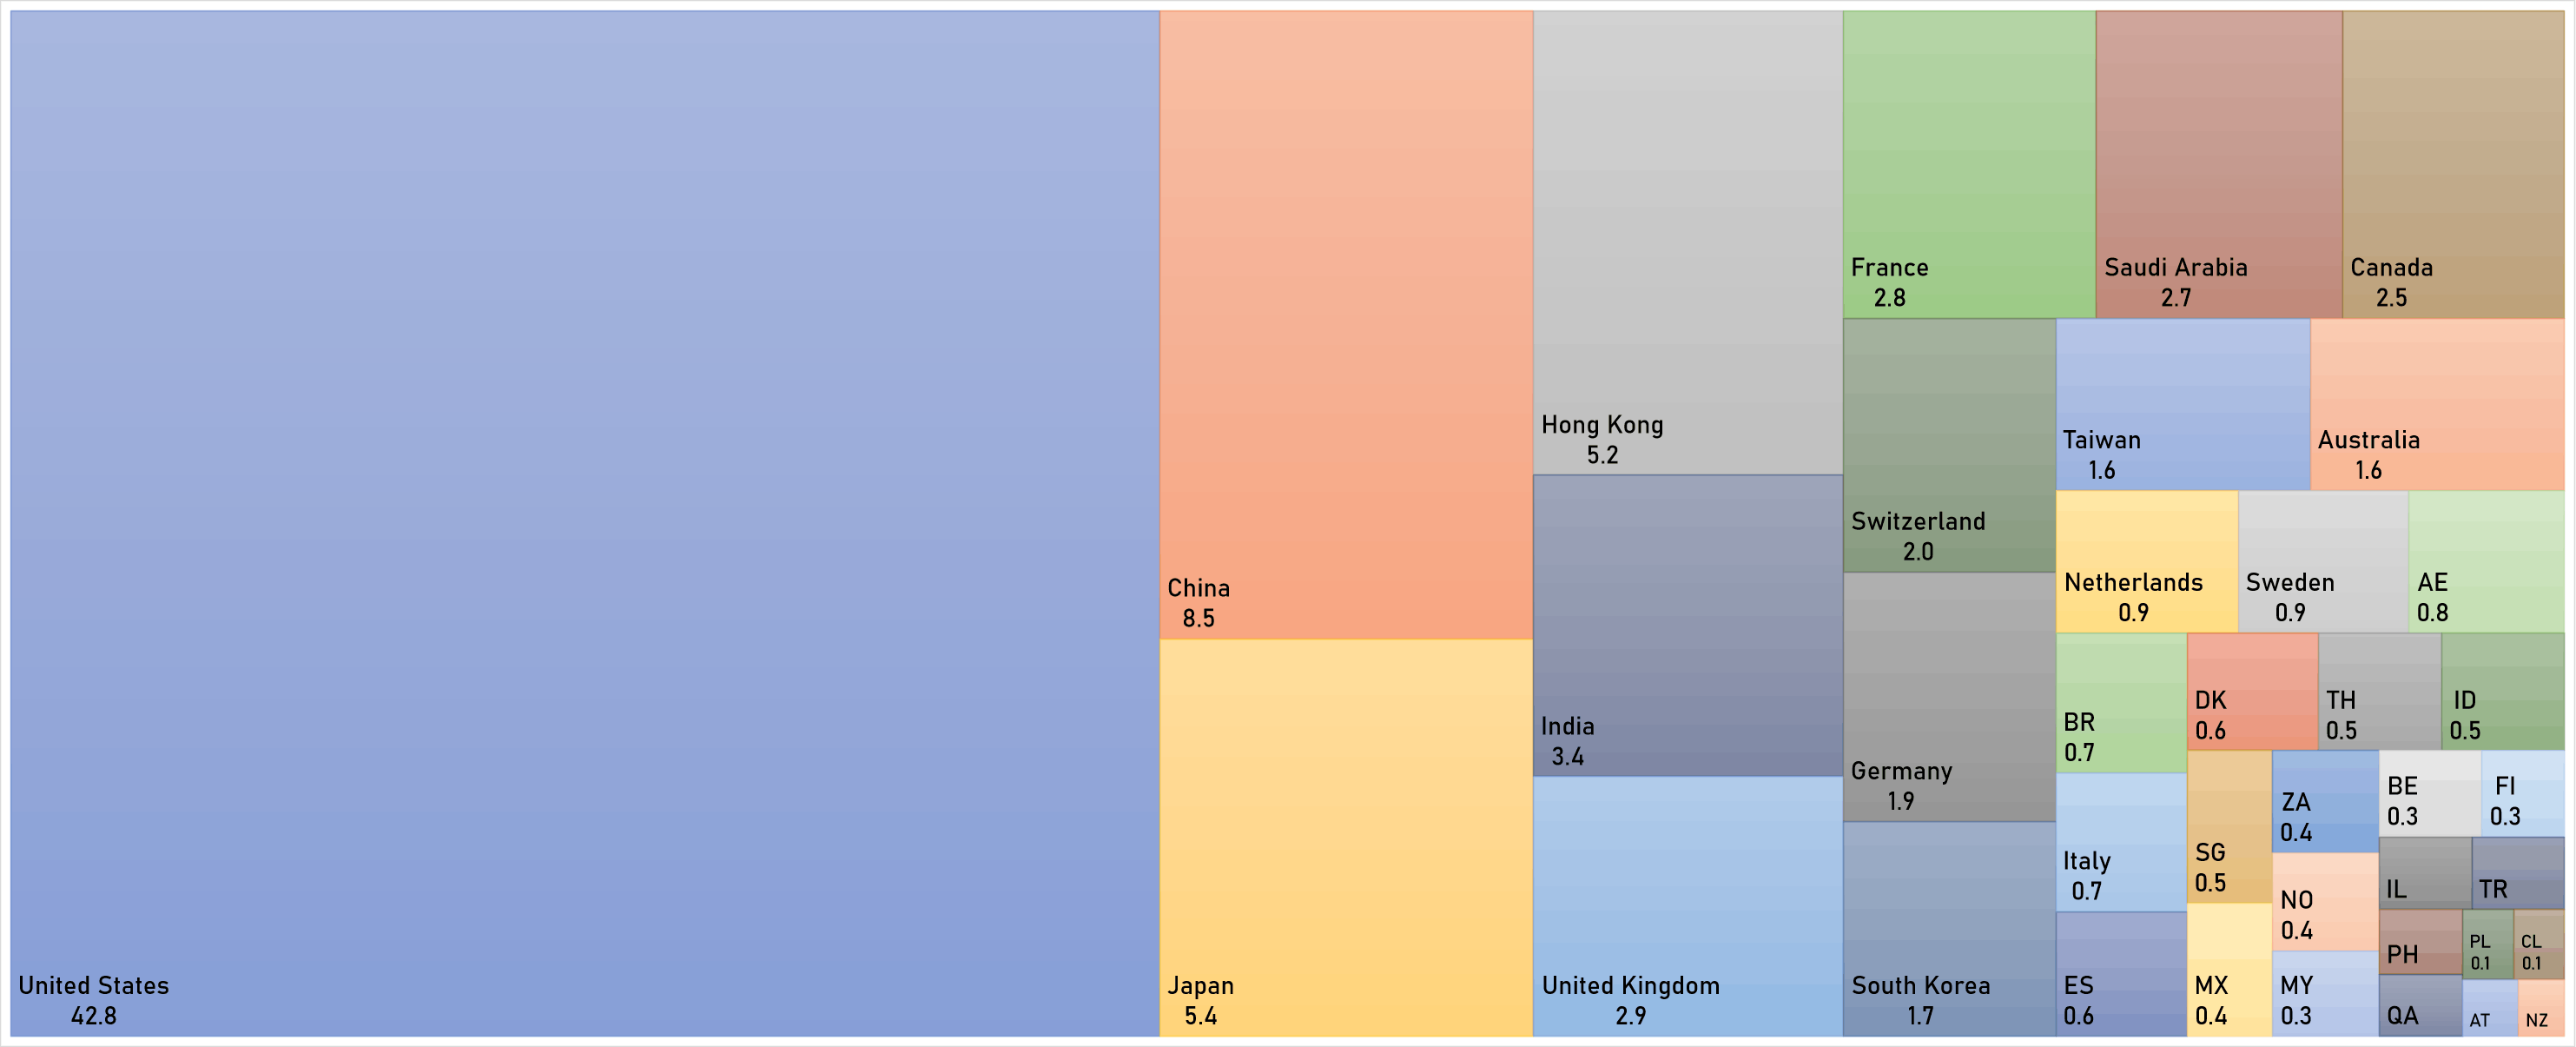
WORLD MARKET CAPITALIZATION (US$ Trillion)