Equities
Nice Further Gains For Global Equities This Week, Driven By Hopes Of Looser Fed Policy And Chinese Reopening
At current levels US equities are pricing in a soft landing, and with the VIX sub 20 and US CTAs now 80% net long (from net short a month ago), it's hard not to be cautious into year end
Published ET
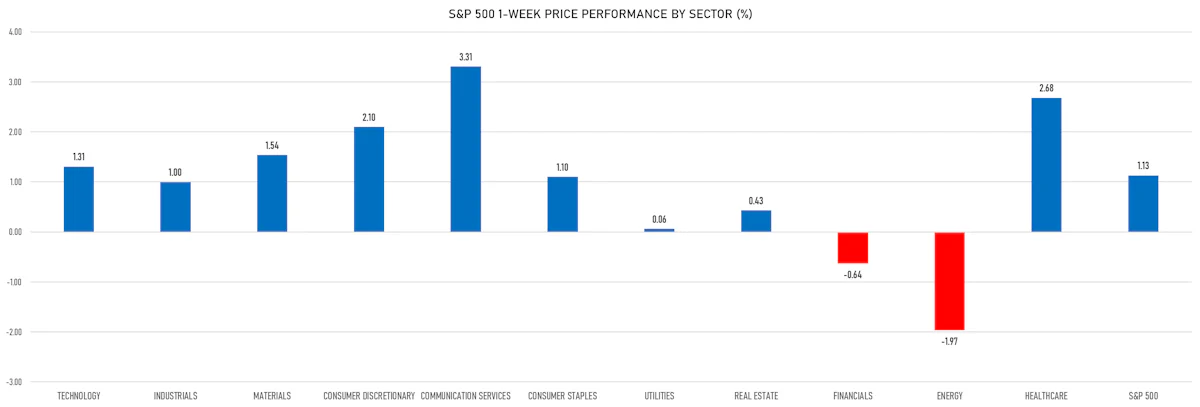
S&P 500 Price Performance (%) By Sector Over The Past Month | Source: S&P Capital IQ Pro
DAILY SUMMARY
- Daily performance of US indices: S&P 500 down -0.12%; Nasdaq Composite down -0.18%; Wilshire 5000 down -0.30%
- 48.9% of S&P 500 stocks were up today, with 62.2% of stocks above their 200-day moving average (DMA) and 90.5% above their 50-DMA
- Top performing sectors in the S&P 500: materials up 1.10% and industrials up 0.62%
- Bottom performing sectors in the S&P 500: energy down -0.60% and technology down -0.55%
- The number of shares in the S&P 500 traded today was 549m for a total turnover of US$ 54 bn
- The S&P 500 Value Index was unchanged, while the S&P 500 Growth Index was down -0.3%; the S&P small caps index was up 0.4% and mid caps were up 0.1%
- The volume on CME's INX (S&P 500 Index) was 2076.4m (3-month z-score: -1.1); the 3-month average volume is 2573.4m and the 12-month range is 903.0 - 4692.3m
- Daily performance of international indices: Europe Stoxx 600 down -0.15%; UK FTSE 100 down -0.03%; Hang Seng SH-SZ-HK 300 Index down -0.39%; Japan's TOPIX 500 down -1.63%
VOLATILITY TODAY
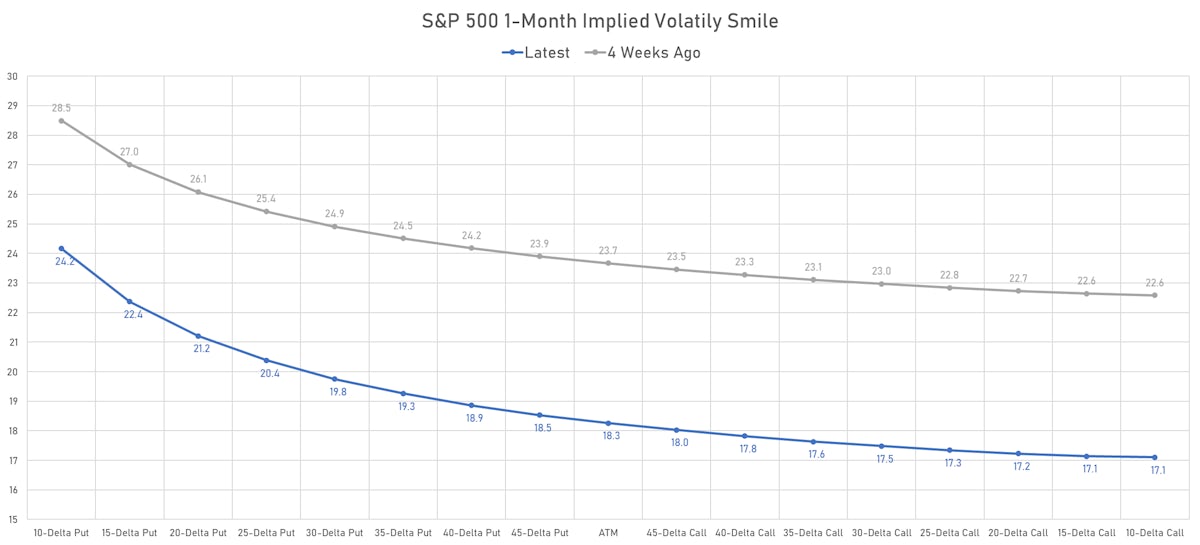
- 1-month at-the-money implied volatility on the S&P 500 at 18.3%, down from 18.9%
- 1-month at-the-money implied volatility on the STOXX Europe 600 at 14.4%, down from 15.0%
YTD PERFORMANCE DECOMPOSITION
- P/E compression has been the dominant driver of returns this year
- The story could flip next year: the Fed should hit its terminal rate in 1H23, while earnings are likely to fall further than current expectations
2023 US EQUITIES OUTLOOK
Sell-side equity strategists (from Credit Suisse and Goldman Sachs) are expressing cautious views for the year ahead, for 3 main reasons:
- Excess liquidity (M1 over nominal GDP) falling by its largest amount in over 40 years
- Valuation: The equity risk premium is 4.4%, when it should be around 5.3% according to CS. The fair value P/E model points to 15X (16% downside) on their projection
- Elevated earnings risk: realized earnings could be much lower than current consensus estimates. David Kostin (GS) sees 0% EPS growth in 2023, while CS expects about 15% downside to end 2023 EPS to around $205
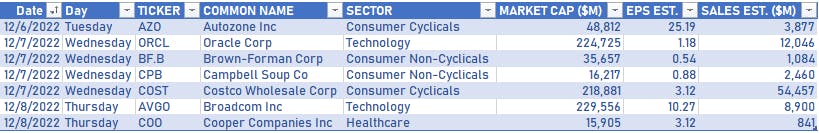
LARGE US CORPORATES REPORTING NEXT WEEK
TOP S&P 500 PERFORMERS THIS WEEK
- Catalent Inc (CTLT), up 26.2% to $52.25 / YTD price return: -59.2% / 12-Month Price Range: $ 40.70-130.89 / Short interest (% of float): 2.0%; days to cover: 1.2
- ETSY Inc (ETSY), up 16.8% to $140.49 / YTD price return: -35.8% / 12-Month Price Range: $ 67.06-255.65
- Wynn Resorts Ltd (WYNN), up 13.6% to $85.15 / YTD price return: +.1% / 12-Month Price Range: $ 50.22-96.50 / Short interest (% of float): 7.2%; days to cover: 1.4
- Fidelity National Information Services Inc (FIS), up 12.2% to $74.06 / YTD price return: -32.1% / 12-Month Price Range: $ 56.53-122.00 / Short interest (% of float): 1.2%; days to cover: 1.0
- Netflix Inc (NFLX), up 12.2% to $320.41 / YTD price return: -46.8% / 12-Month Price Range: $ 162.81-632.46 / Short interest (% of float): 2.5%; days to cover: 0.8
- Las Vegas Sands Corp (LVS), up 11.1% to $47.96 / YTD price return: +27.4% / 12-Month Price Range: $ 28.88-48.26 / Short interest (% of float): 5.0%; days to cover: 2.1
- Meta Platforms Inc (META), up 10.8% to $123.49 / YTD price return: -63.3% / 12-Month Price Range: $ 88.10-352.69 / Short interest (% of float): 1.9%; days to cover: 0.7
- Marketaxess Holdings Inc (MKTX), up 9.5% to $281.16 / YTD price return: -31.6% / 12-Month Price Range: $ 217.97-421.60 / Short interest (% of float): 2.5%; days to cover: 2.3
- Bath & Body Works Inc (BBWI), up 8.6% to $43.86 / YTD price return: -37.2% / 12-Month Price Range: $ 25.80-77.40 / Short interest (% of float): 7.3%; days to cover: 4.7
- Estee Lauder Companies Inc (EL), up 8.6% to $239.01 / YTD price return: -35.4% / 12-Month Price Range: $ 186.54-373.99 / Short interest (% of float): 1.5%; days to cover: 1.4
BOTTOM S&P 500 PERFORMERS THIS WEEK
- NetApp Inc (NTAP), down 11.0% to $66.43 / YTD price return: -27.8% / 12-Month Price Range: $ 60.60-96.81 / Short interest (% of float): 2.6%; days to cover: 3.6
- Charles River Laboratories International Inc (CRL), down 8.3% to $222.66 / YTD price return: -40.9% / 12-Month Price Range: $ 181.37-379.45 / Short interest (% of float): 1.9%; days to cover: 1.7
- Valero Energy Corp (VLO), down 8.2% to $127.07 / YTD price return: +69.2% / 12-Month Price Range: $ 65.16-146.80 / Short interest (% of float): 2.3%; days to cover: 2.3
- Costco Wholesale Corp (COST), down 7.3% to $494.53 / YTD price return: -12.9% / 12-Month Price Range: $ 406.64-612.12 / Short interest (% of float): 1.0%; days to cover: 2.2
- EQT Corp (EQT), down 7.2% to $39.93 / YTD price return: +83.1% / 12-Month Price Range: $ 17.97-51.95
- PayPal Holdings Inc (PYPL), down 6.8% to $74.66 / YTD price return: -60.4% / 12-Month Price Range: $ 67.59-197.67 / Short interest (% of float): 2.1%; days to cover: 1.5
- Micron Technology Inc (MU), down 6.4% to $54.68 / YTD price return: -41.3% / 12-Month Price Range: $ 48.45-98.44 / Short interest (% of float): 3.0%; days to cover: 1.7
- Archer-Daniels-Midland Co (ADM), down 5.8% to $91.71 / YTD price return: +35.7% / 12-Month Price Range: $ 61.86-98.88 / Short interest (% of float): 1.3%; days to cover: 2.6
- Pioneer Natural Resources Co (PXD), down 5.8% to $239.41 / YTD price return: +31.6% / 12-Month Price Range: $ 166.98-288.32
- Salesforce Inc (CRM), down 5.7% to $144.56 / YTD price return: -43.1% / 12-Month Price Range: $ 136.04-270.56 / Short interest (% of float): 1.0%; days to cover: 1.3 (the stock is currently on the short sale restriction list)
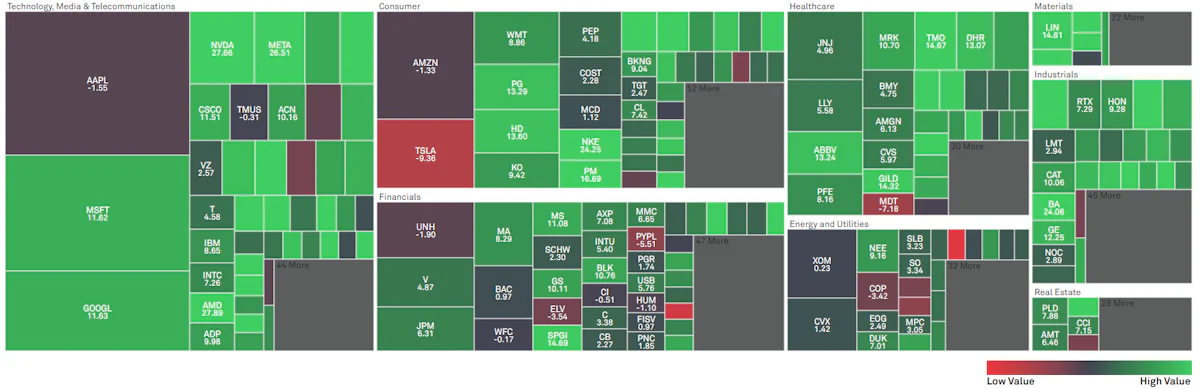
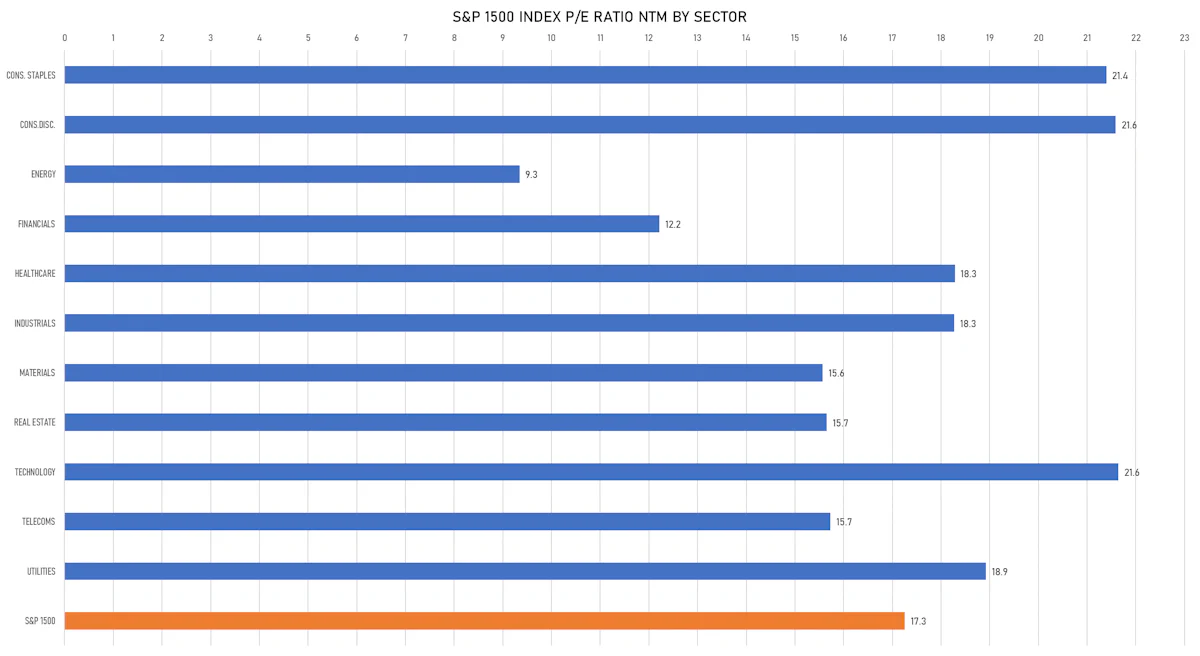
VALUATION MULTIPLES BY SECTORS
WEEKLY TOTAL RETURNS OF MAJOR GLOBAL EQUITY MARKETS
TOP / BOTTOM PERFORMING WORLD MARKETS YTD
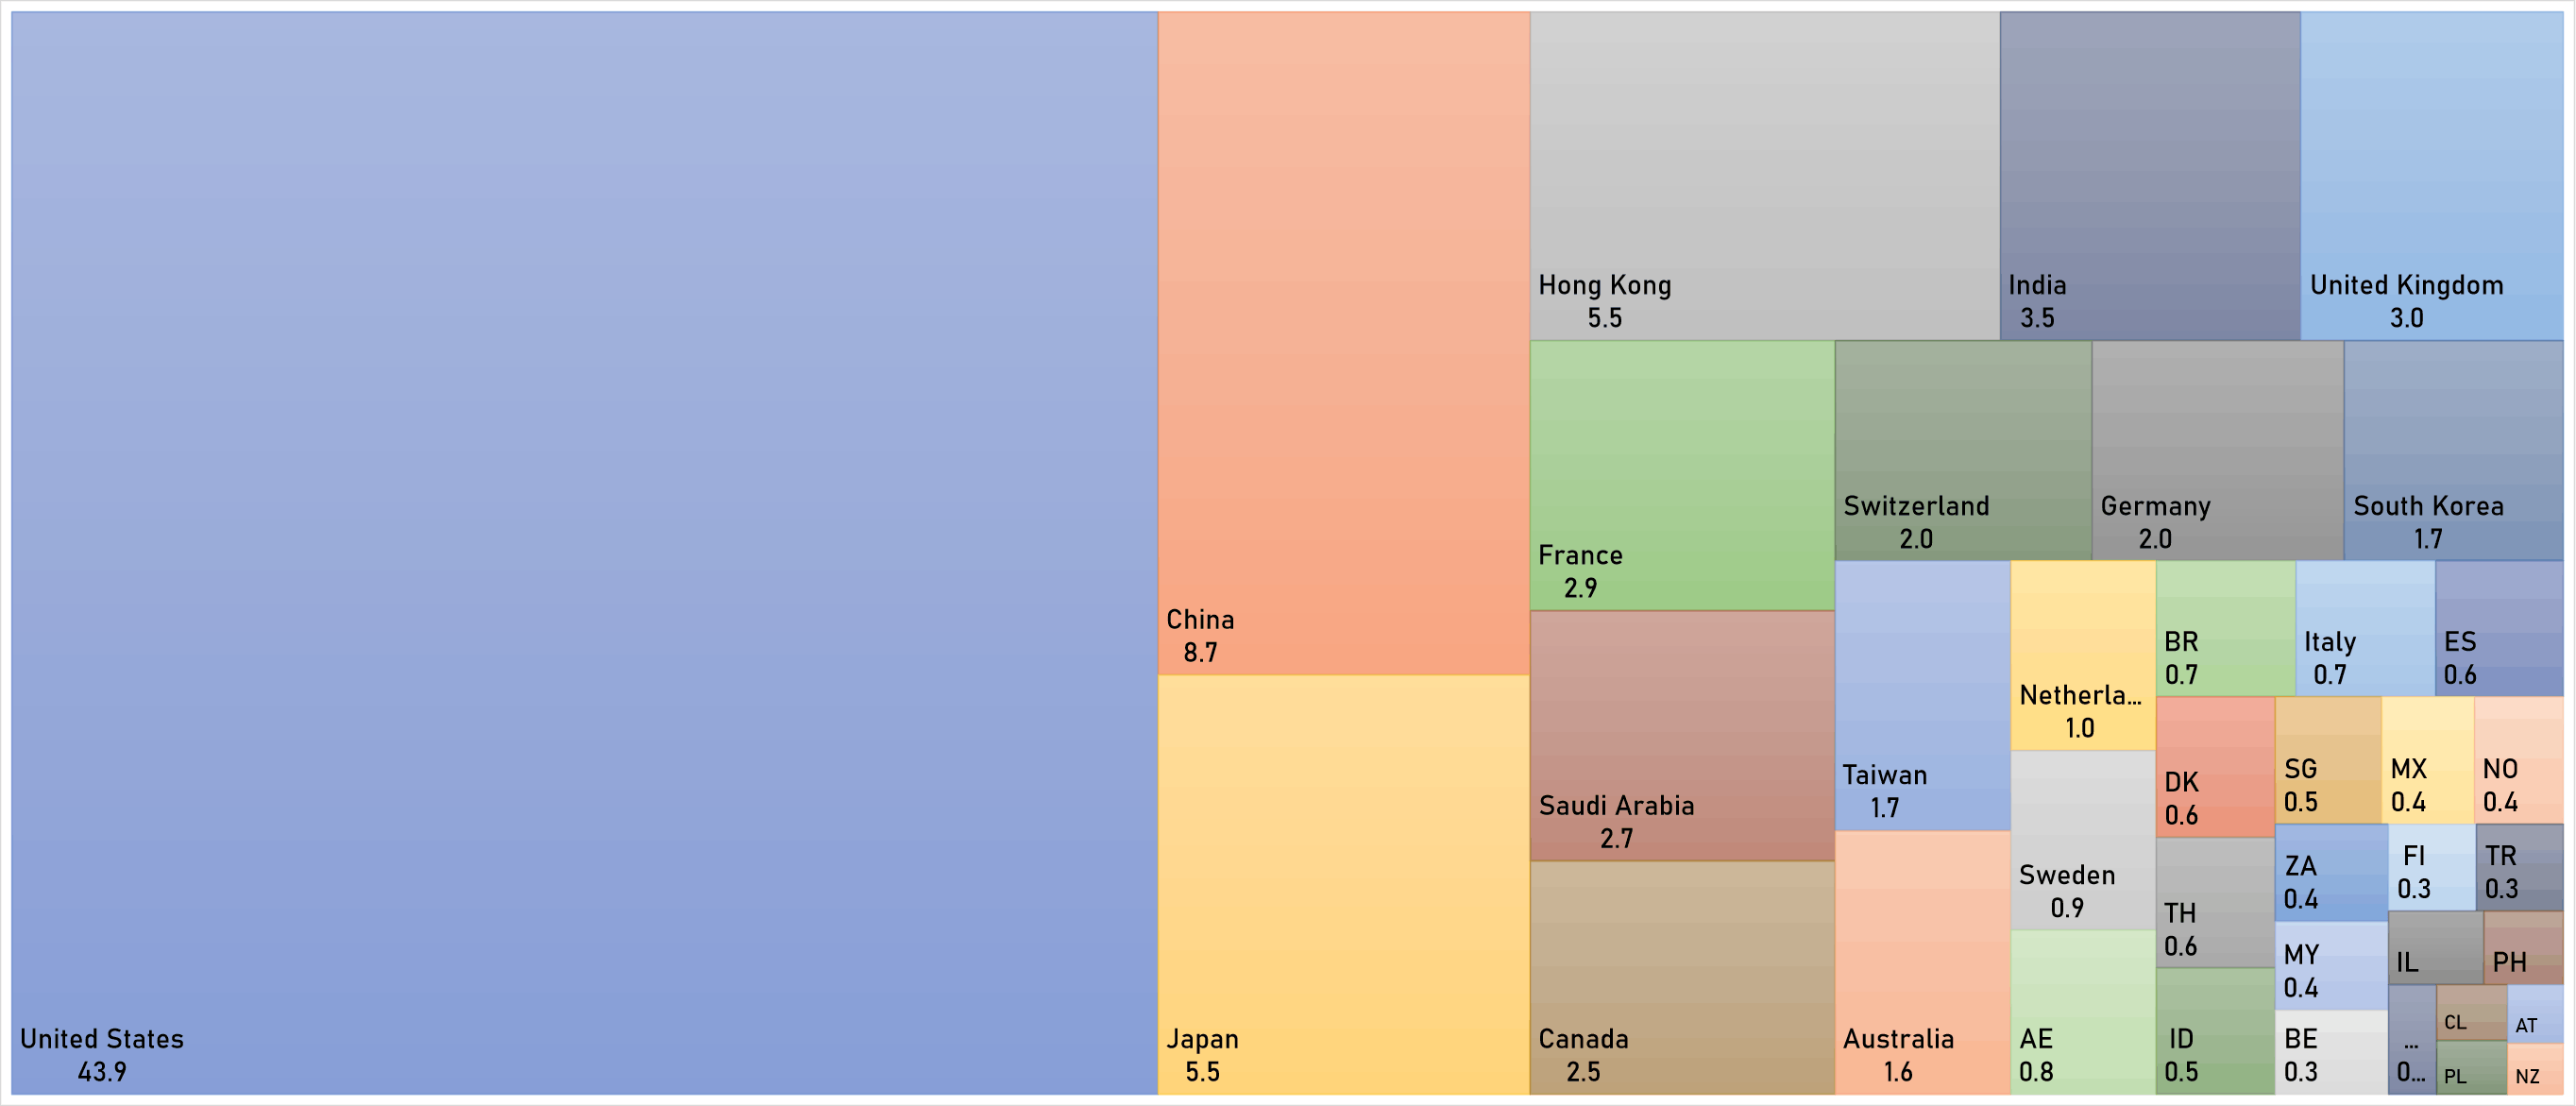
WORLD MARKET CAPITALIZATION (US$ Trillion)