Equities
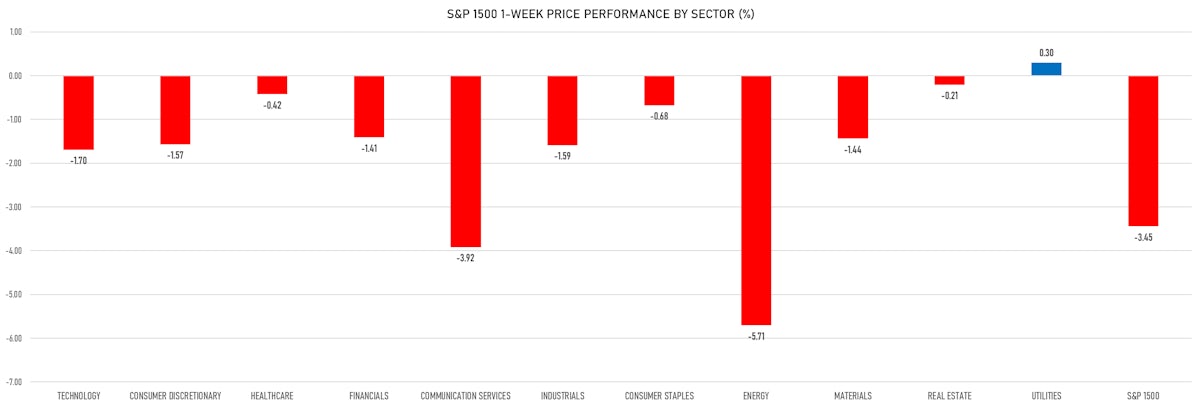
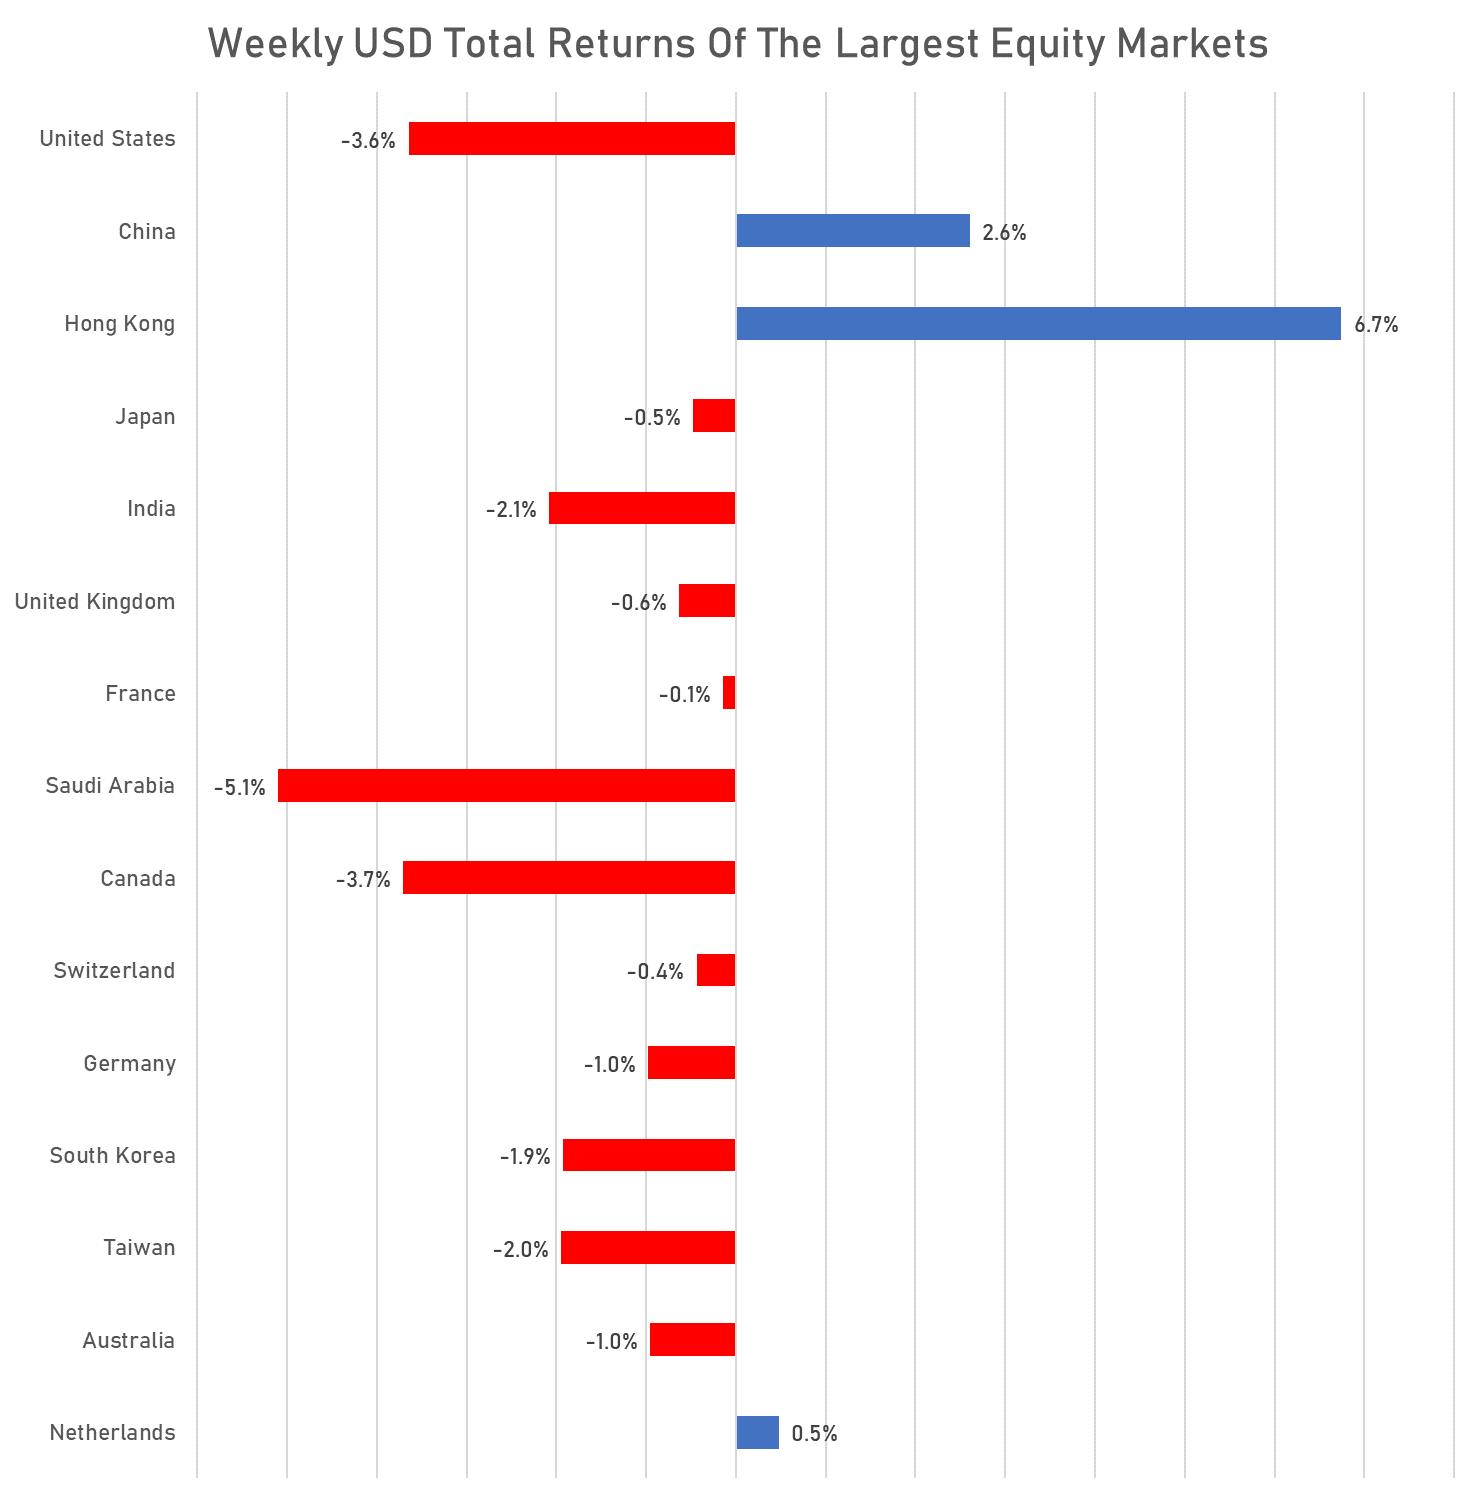
As Expected, US Equities Down 3.6% For The Week Ahead Of Critical Macro Events Next Week
China's mainland and Hong Kong equity markets continued to rebound on the back of looser local COVID restrictions, with a full national reopening expected around April next year
Published ET
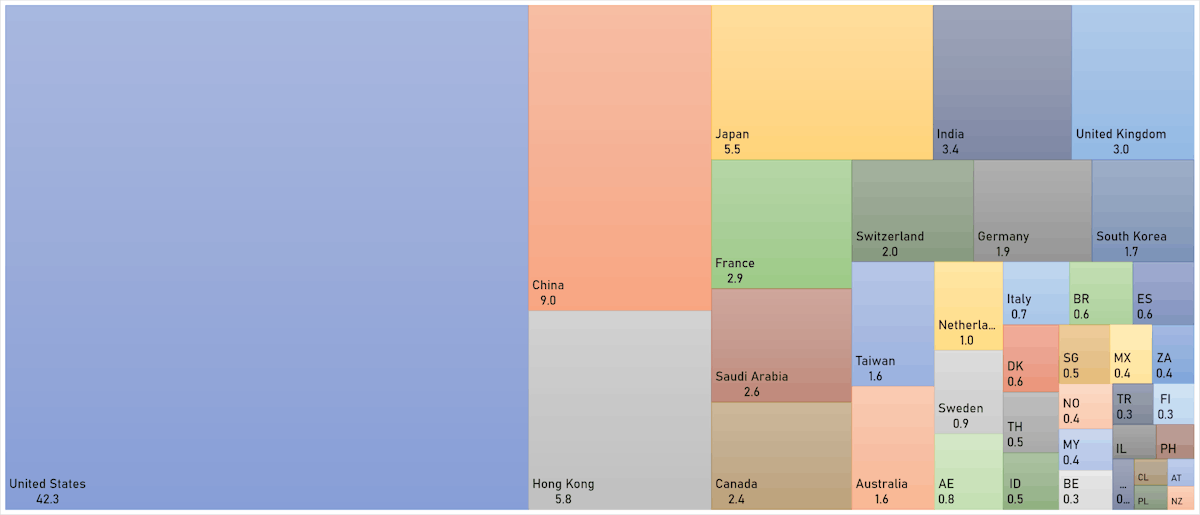
Hong Kong's Market Cap Is Back Above Japan's (USD Trillion) | Sources: ϕpost, FactSet data
DAILY SUMMARY
- Daily performance of US indices: S&P 500 down -0.73%; Nasdaq Composite down -0.70%; Wilshire 5000 down -0.14%
- 23.1% of S&P 500 stocks were up today, with 54.1% of stocks above their 200-day moving average (DMA) and 77.5% above their 50-DMA
- Top performing sectors in the S&P 500: communication services up 0.02% and real estate down -0.20%
- Bottom performing sectors in the S&P 500: energy down -2.33% and healthcare down -1.28%
- The number of shares in the S&P 500 traded today was 582m for a total turnover of US$ 56 bn
- The S&P 500 Value Index was down -0.8%, while the S&P 500 Growth Index was down -0.7%; the S&P small caps index was down -1.1% and mid caps were down -0.9%
- The volume on CME's INX (S&P 500 Index) was 2123.2m (3-month z-score: -1.0); the 3-month average volume is 2577.5m and the 12-month range is 903.0 - 4692.3m
- Daily performance of international indices: Europe Stoxx 600 up 0.84%; UK FTSE 100 up 0.06%; Hang Seng SH-SZ-HK 300 Index up 1.50%; Japan's TOPIX 500 up 1.06%
VOLATILITY TODAY
- 1-month at-the-money implied volatility on the S&P 500 at 20.9%, up from 20.5%
- 1-month at-the-money implied volatility on the STOXX Europe 600 at 15.8%, down from 16.2%
TOP S&P 500 PERFORMERS THIS WEEK
- Evergy Inc (EVRG), up 6.6% to $62.39 / YTD price return: -9.1% / 12-Month Price Range: $ 54.15-73.08 / Short interest (% of float): 1.1%; days to cover: 1.5
- Newell Brands Inc (NWL), up 3.5% to $13.44 / YTD price return: -38.5% / 12-Month Price Range: $ 12.25-26.45 / Short interest (% of float): 5.1%; days to cover: 5.0
- Campbell Soup Co (CPB), up 2.9% to $55.66 / YTD price return: +28.1% / 12-Month Price Range: $ 40.99-57.08 / Short interest (% of float): 6.8%; days to cover: 5.7
- CMS Energy Corp (CMS), up 2.8% to $62.22 / YTD price return: -4.4% / 12-Month Price Range: $ 52.43-73.75 / Short interest (% of float): 1.7%; days to cover: 2.1
- Realty Income Corp (O), up 2.5% to $64.45 / YTD price return: -10.0% / 12-Month Price Range: $ 55.51-75.40 / Short interest (% of float): 4.7%; days to cover: 7.6
- Seagate Technology Holdings PLC (STX), up 2.2% to $54.14 / YTD price return: -52.1% / 12-Month Price Range: $ 47.47-117.63 / Short interest (% of float): 4.9%; days to cover: 3.2
- Molina Healthcare Inc (MOH), up 2.1% to $341.15 / YTD price return: +7.3% / 12-Month Price Range: $ 250.38-374.00 / Short interest (% of float): 1.8%; days to cover: 2.0
- Teleflex Inc (TFX), up 2.0% to $247.34 / YTD price return: -24.7% / 12-Month Price Range: $ 183.50-356.37 / Short interest (% of float): 3.0%; days to cover: 3.4
- Solaredge Technologies Inc (SEDG), up 2.0% to $314.80 / YTD price return: +12.2% / 12-Month Price Range: $ 190.15-375.14 / Short interest (% of float): 3.8%; days to cover: 1.5
- DTE Energy Co (DTE), up 1.9% to $117.19 / YTD price return: -2.0% / 12-Month Price Range: $ 100.64-140.20 / Short interest (% of float): 1.0%; days to cover: 0.9
BOTTOM S&P 500 PERFORMERS THIS WEEK
- NRG Energy Inc (NRG), down 21.7% to $32.28 / YTD price return: -25.1% / 12-Month Price Range: $ 32.17-47.81
- Lincoln National Corp (LNC), down 18.4% to $31.66 / YTD price return: -53.6% / 12-Month Price Range: $ 30.83-76.40 / Short interest (% of float): 2.7%; days to cover: 1.7 (the stock is currently on the short sale restriction list)
- VF Corp (VFC), down 15.1% to $28.20 / YTD price return: -61.5% / 12-Month Price Range: $ 26.46-77.32
- Halliburton Co (HAL), down 15.1% to $33.01 / YTD price return: +44.3% / 12-Month Price Range: $ 21.07-43.99 / Short interest (% of float): 2.2%; days to cover: 1.7
- Catalent Inc (CTLT), down 14.5% to $44.68 / YTD price return: -65.1% / 12-Month Price Range: $ 40.70-130.89 / Short interest (% of float): 2.0%; days to cover: 1.2
- Devon Energy Corp (DVN), down 12.9% to $59.62 / YTD price return: +35.3% / 12-Month Price Range: $ 35.56-79.40 / Short interest (% of float): 2.5%; days to cover: 1.5
- Signature Bank (SBNY), down 12.8% to $118.56 / YTD price return: -63.3% / 12-Month Price Range: $ 113.50-374.76
- EOG Resources Inc (EOG), down 12.4% to $121.67 / YTD price return: +41.8% / 12-Month Price Range: $ 77.99-150.88 / Short interest (% of float): 1.3%; days to cover: 1.9
- Marathon Oil Corp (MRO), down 12.0% to $26.17 / YTD price return: +59.4% / 12-Month Price Range: $ 14.30-33.42 / Short interest (% of float): 3.9%; days to cover: 1.9
- Carnival Corp (CCL), down 11.3% to $8.87 / YTD price return: -55.9% / 12-Month Price Range: $ 6.12-23.85 / Short interest (% of float): 11.4%; days to cover: 1.8
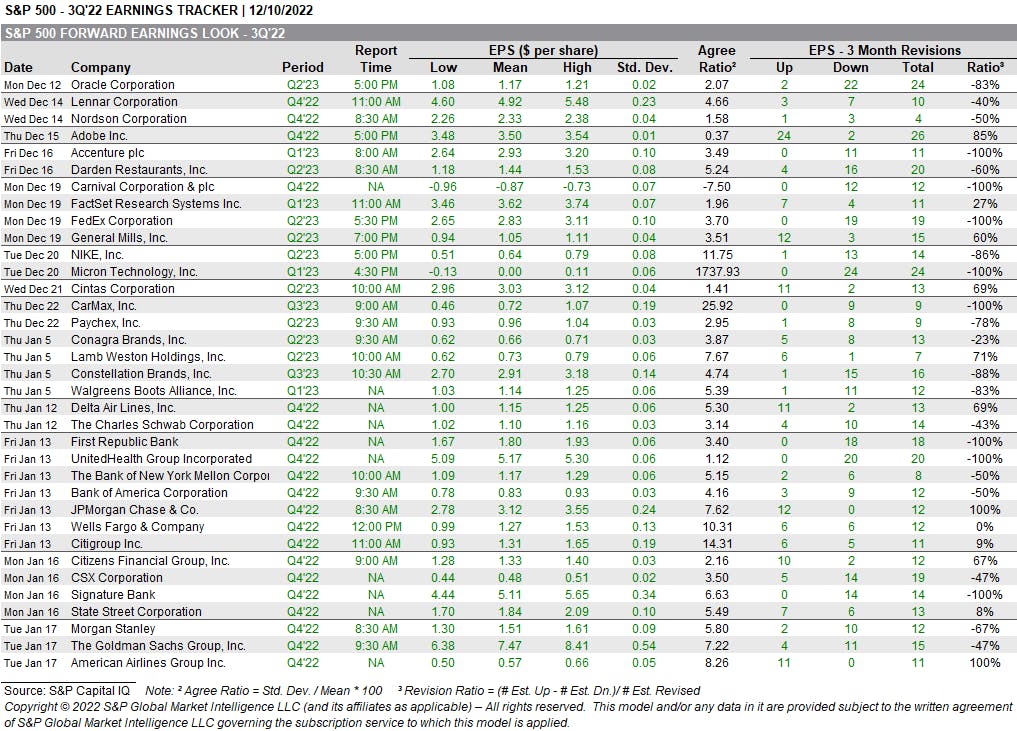
EARNINGS CALENDAR FOR THE WEEK AHEAD
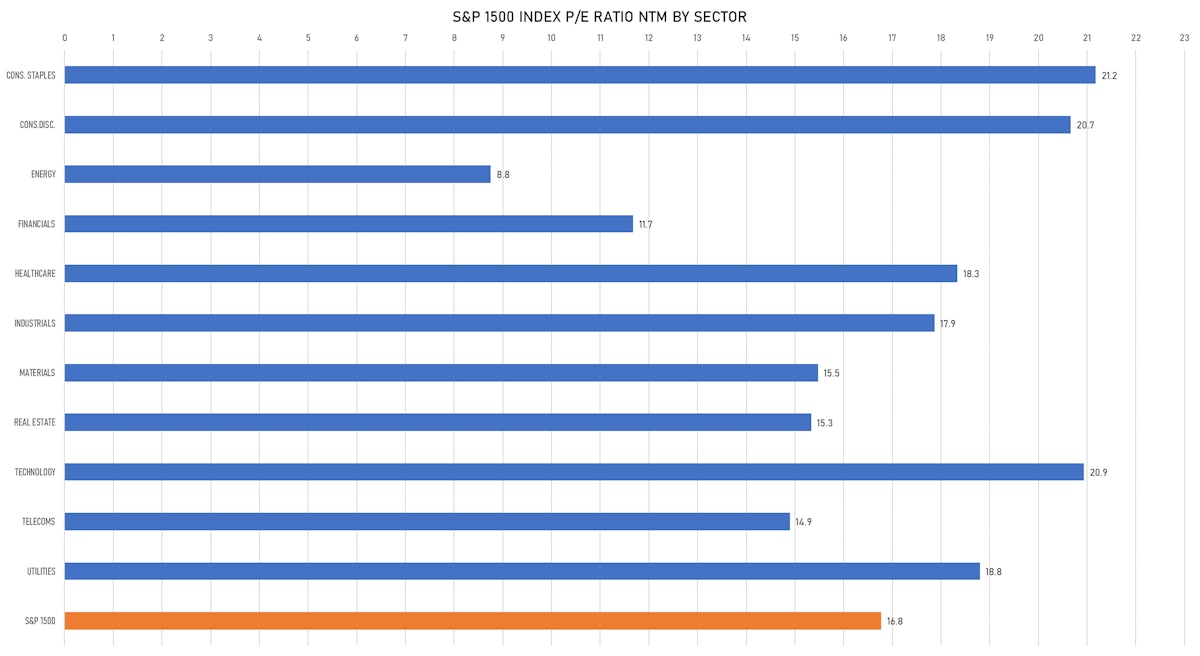
VALUATION MULTIPLES BY SECTORS
WEEKLY TOTAL RETURNS OF MAJOR GLOBAL EQUITY MARKETS
TOP / BOTTOM PERFORMING WORLD MARKETS YTD

