Equities
Weakness Across Global Equities, As Hawkish Central Banks And Soft Data Add Up To A Challenging Environment
The year 2023 is setting up as a tale of two halves in the US: the first one should be dominated by earnings revisions and bring in a possible new bottom for the cycle, while the second half should be a positive recovery trade
Published ET
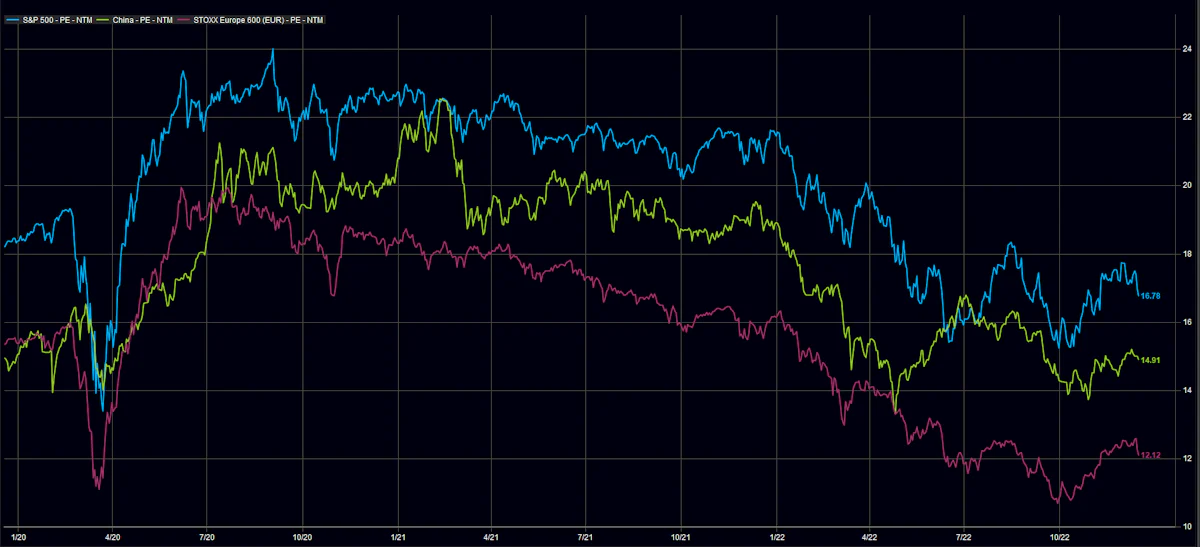
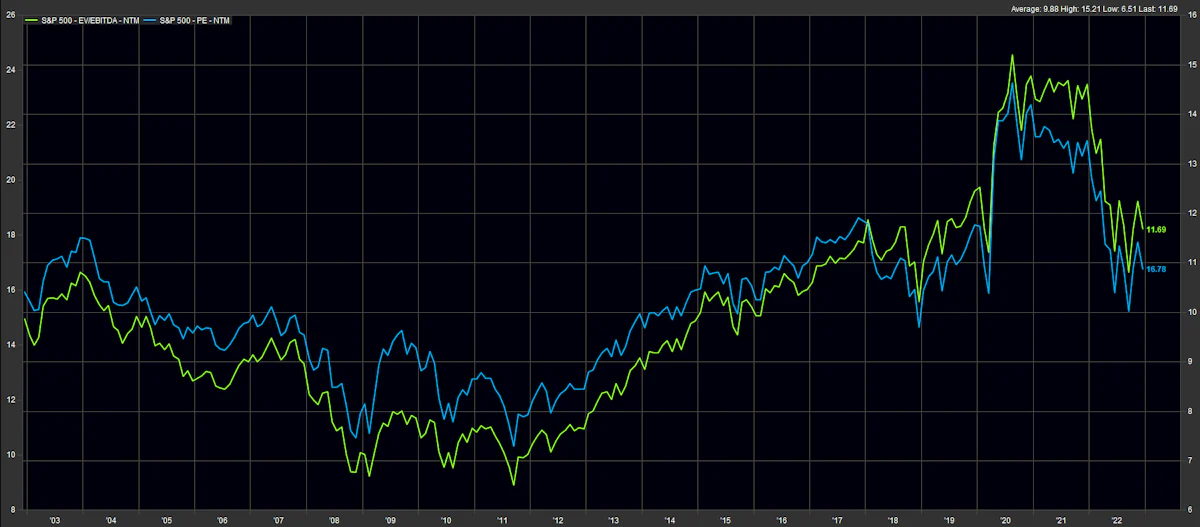
Forward P/E For US, Chinese, European Equity Markets | Source: FactSet
DAILY SUMMARY
- Daily performance of US indices: S&P 500 down -1.11%; Nasdaq Composite down -0.97%; Wilshire 5000 down -1.07%
- 17.1% of S&P 500 stocks were up today, with 47.3% of stocks above their 200-day moving average (DMA) and 57.5% above their 50-DMA
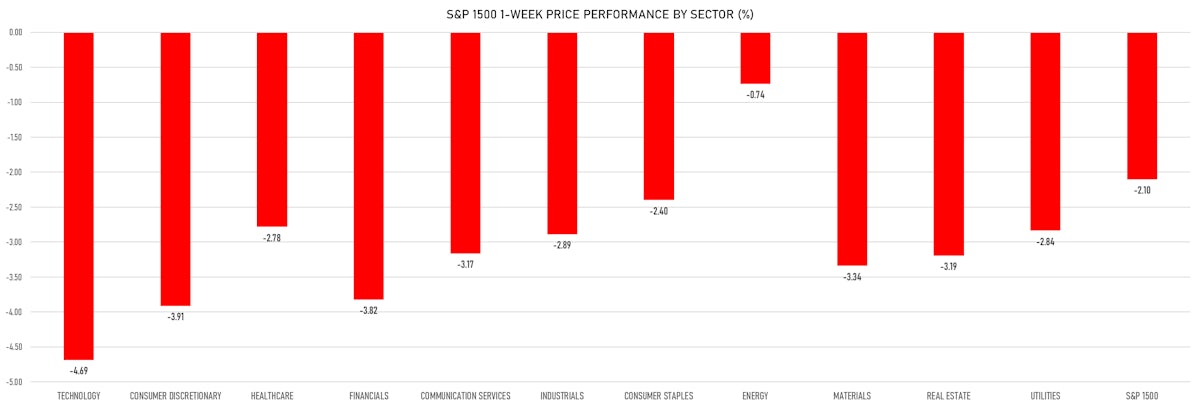
- Top performing sectors in the S&P 500: communication services down -0.11% and materials down -0.41%
- Bottom performing sectors in the S&P 500: real estate down -2.96% and consumer discretionary down -1.74%
- The number of shares in the S&P 500 traded today was 2479m for a total turnover of US$ 217 bn
- The S&P 500 Value Index was down -1.0%, while the S&P 500 Growth Index was down -1.3%; the S&P small caps index was down -1.0% and mid caps were down -0.9%
- The volume on CME's INX (S&P 500 Index) was 5089.5m (3-month z-score: 4.7); the 3-month average volume is 2602.9m and the 12-month range is 903.0 - 5089.5m
- Daily performance of international indices: Europe Stoxx 600 down -1.20%; UK FTSE 100 down -1.27%; Hang Seng SH-SZ-HK 300 Index up 0.23%; Japan's TOPIX 500 down -1.23%
VOLATILITY TODAY
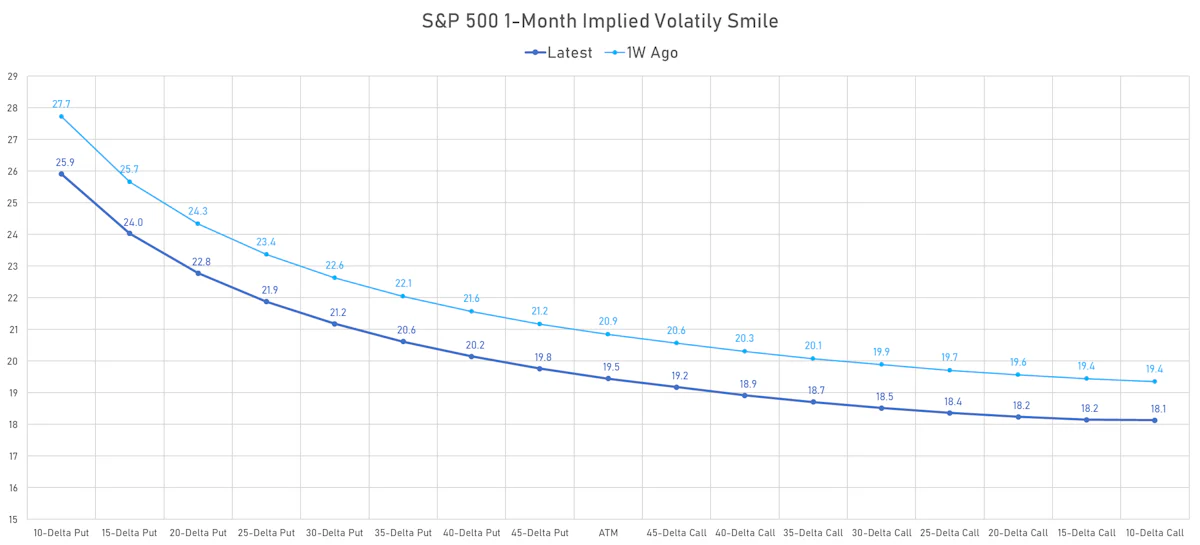
- 1-month at-the-money implied volatility on the S&P 500 at 19.5%, up from 19.3%
- 1-month at-the-money implied volatility on the STOXX Europe 600 at 16.6%, up from 16.0%
TOP S&P 500 PERFORMERS THIS WEEK
- Fortune Brands Innovations Inc (FBIN), up 10.8% to $57.13 / YTD price return: -37.5% / 12-Month Price Range: $ 45.30-92.60 / Short interest (% of float): 2.1%; days to cover: 1.6
- Moderna Inc (MRNA), up 9.0% to $193.29 / YTD price return: -23.9% / 12-Month Price Range: $ 115.06-321.00 / Short interest (% of float): 4.8%; days to cover: 3.7
- Halliburton Co (HAL), up 8.6% to $35.85 / YTD price return: +56.8% / 12-Month Price Range: $ 21.07-43.99 / Short interest (% of float): 2.2%; days to cover: 1.8
- Universal Health Services Inc (UHS), up 6.6% to $135.77 / YTD price return: +4.7% / 12-Month Price Range: $ 82.52-158.24 / Short interest (% of float): 3.6%; days to cover: 2.6
- Pultegroup Inc (PHM), up 5.4% to $46.30 / YTD price return: -19.0% / 12-Month Price Range: $ 35.04-58.09 / Short interest (% of float): 4.0%; days to cover: 3.4
- Schlumberger NV (SLB), up 5.1% to $49.38 / YTD price return: +64.9% / 12-Month Price Range: $ 27.66-56.04 / Short interest (% of float): 1.5%; days to cover: 1.4
- Align Technology Inc (ALGN), up 5.0% to $198.21 / YTD price return: -69.8% / 12-Month Price Range: $ 172.29-674.50 / Short interest (% of float): 3.3%; days to cover: 1.9
- D R Horton Inc (DHI), up 4.7% to $89.38 / YTD price return: -17.6% / 12-Month Price Range: $ 59.26-108.99 / Short interest (% of float): 4.4%; days to cover: 4.5
- Baker Hughes Co (BKR), up 4.6% to $28.37 / YTD price return: +17.9% / 12-Month Price Range: $ 20.42-39.78 / Short interest (% of float): 1.9%; days to cover: 2.2
- APA Corp (US) (APA), up 4.6% to $43.79 / YTD price return: +62.8% / 12-Month Price Range: $ 22.95-51.95 / Short interest (% of float): 2.9%; days to cover: 1.3
BOTTOM S&P 500 PERFORMERS THIS WEEK
- Charter Communications Inc (CHTR), down 19.9% to $304.96 / YTD price return: -53.2% / 12-Month Price Range: $ 297.83-669.26 / Short interest (% of float): 8.9%; days to cover: 6.4
- Tesla Inc (TSLA), down 16.1% to $150.23 / YTD price return: -57.4% / 12-Month Price Range: $ 150.23-402.66 / Short interest (% of float): 2.9%; days to cover: 0.9
- Trimble Inc (TRMB), down 13.3% to $49.83 / YTD price return: -42.8% / 12-Month Price Range: $ 49.83-88.85 / Short interest (% of float): 1.0%; days to cover: 2.0
- United Airlines Holdings Inc (UAL), down 10.7% to $38.43 / YTD price return: -12.2% / 12-Month Price Range: $ 30.54-53.11
- Warner Bros Discovery Inc (WBD), down 10.6% to $9.91 / YTD price return: -57.9% / 12-Month Price Range: $ 9.52-31.55 / Short interest (% of float): 4.6%; days to cover: 3.9
- Western Digital Corp (WDC), down 10.6% to $31.94 / YTD price return: -51.0% / 12-Month Price Range: $ 31.57-69.35 / Short interest (% of float): 2.7%; days to cover: 2.0
- Nucor Corp (NUE), down 9.2% to $133.60 / YTD price return: +17.0% / 12-Month Price Range: $ 88.50-187.90 / Short interest (% of float): 3.2%; days to cover: 4.0
- Netflix Inc (NFLX), down 9.2% to $290.71 / YTD price return: -51.7% / 12-Month Price Range: $ 162.81-620.49 / Short interest (% of float): 2.4%; days to cover: 0.9
- Paramount Global (PARA), down 9.0% to $17.31 / YTD price return: -42.6% / 12-Month Price Range: $ 15.29-39.21 / Short interest (% of float): 13.4%; days to cover: 5.6
- Accenture PLC (ACN), down 8.3% to $264.48 / YTD price return: -36.2% / 12-Month Price Range: $ 242.95-417.33
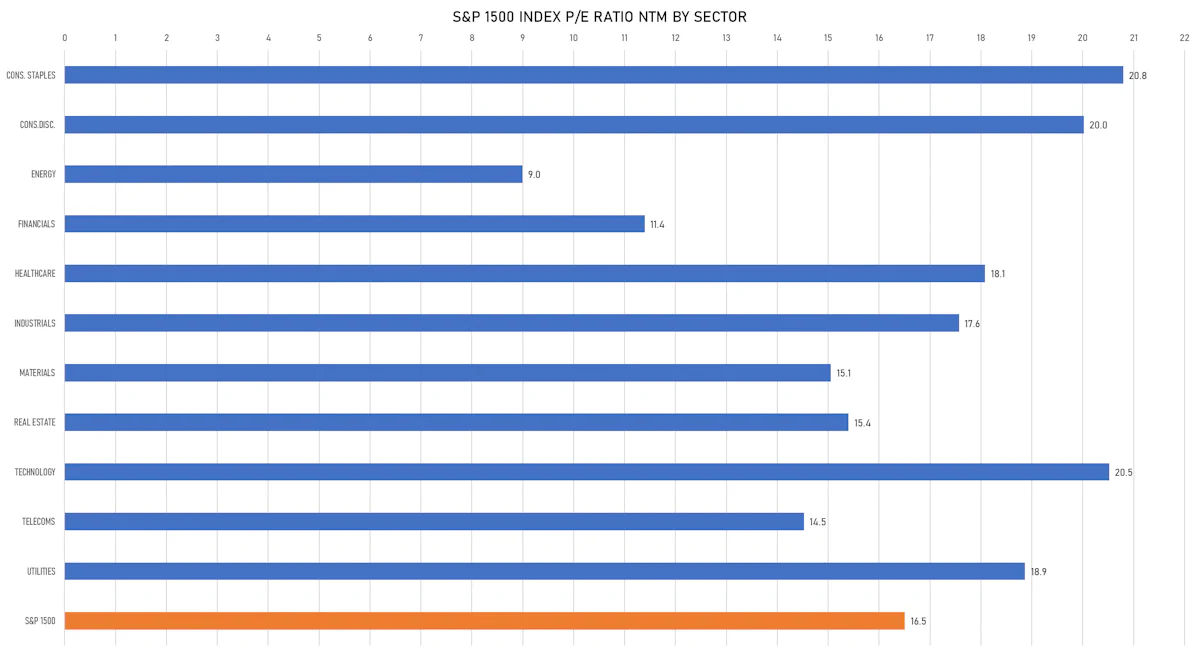
VALUATION MULTIPLES BY SECTORS
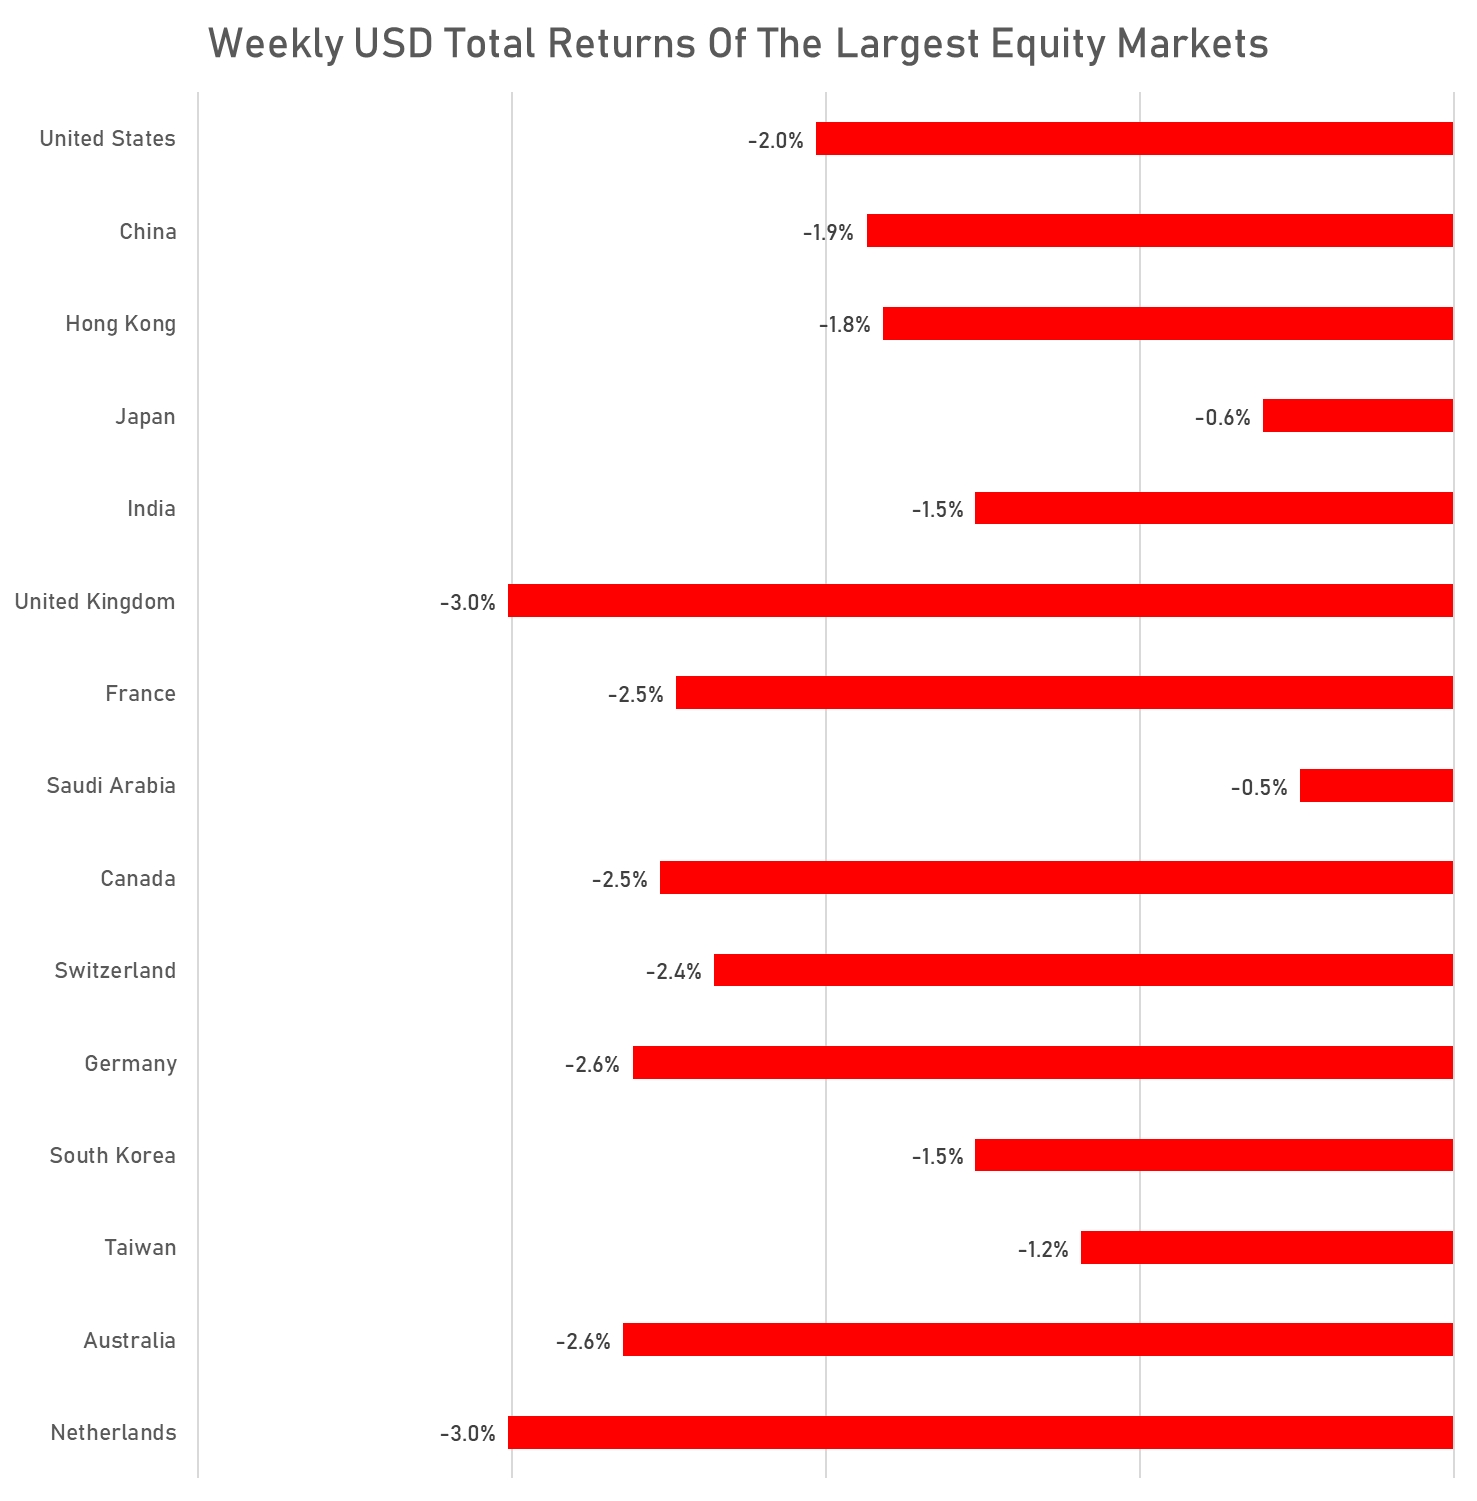
WEEKLY TOTAL RETURNS OF MAJOR GLOBAL EQUITY MARKETS
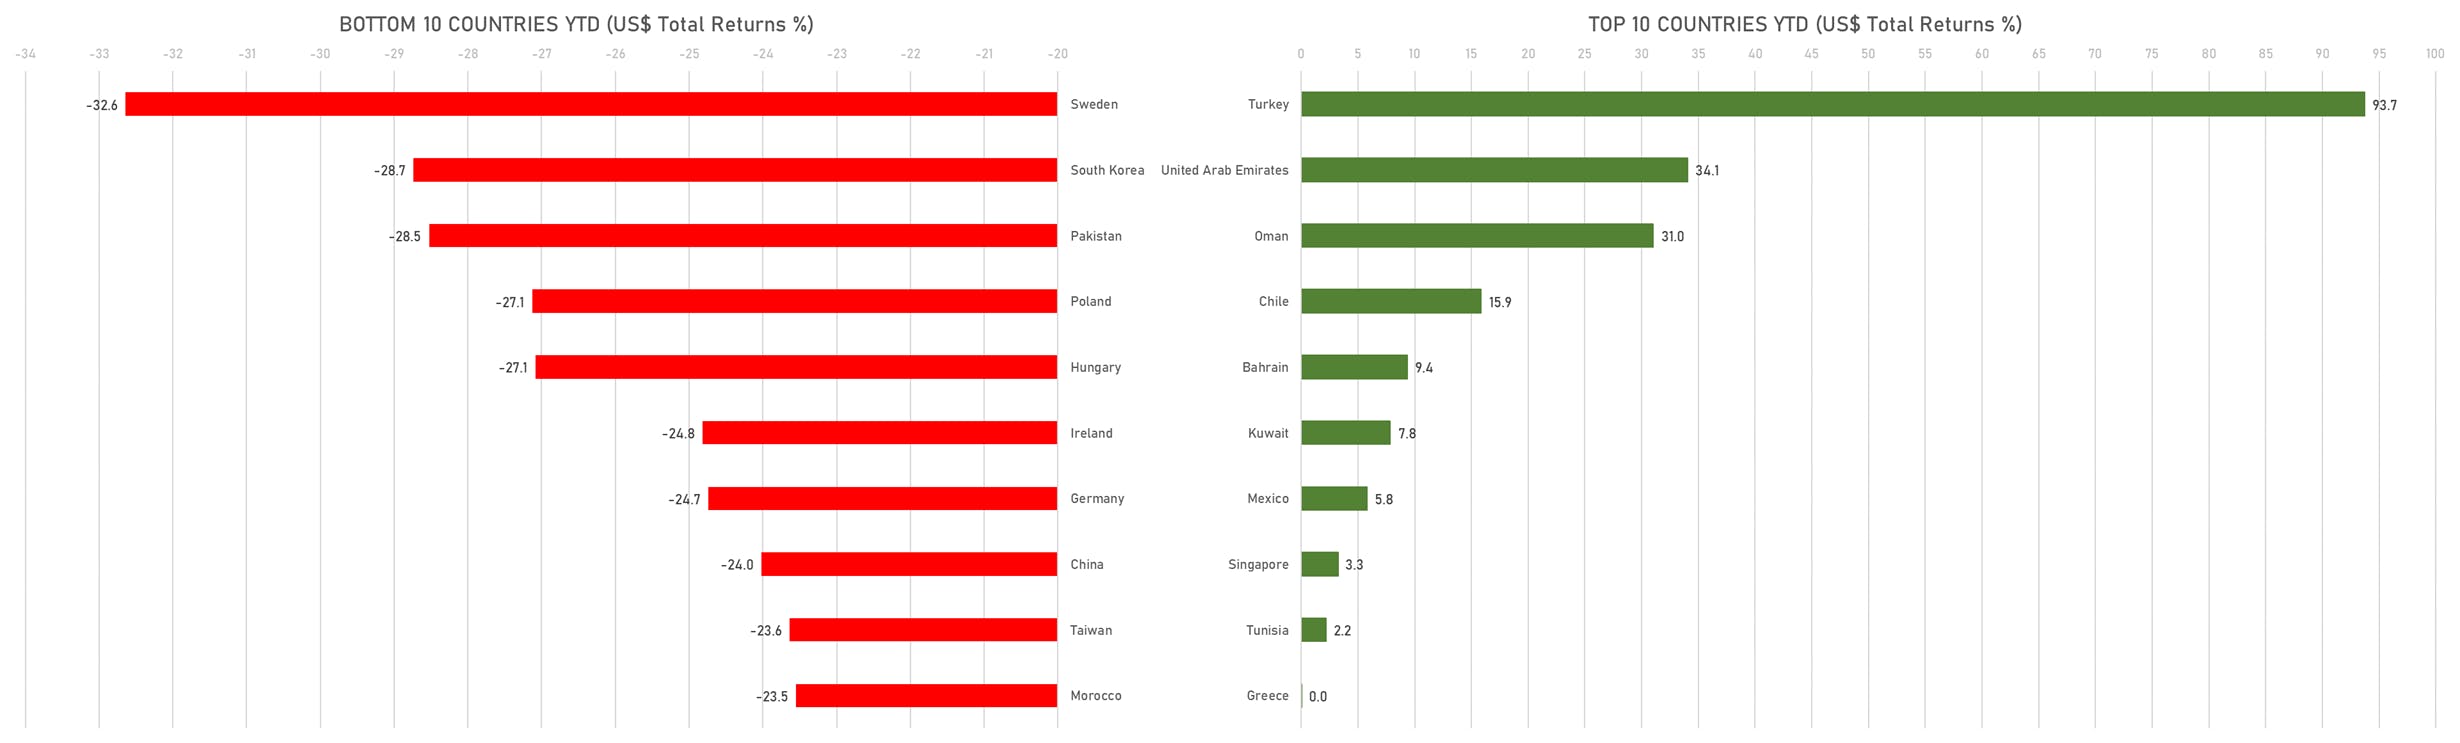
TOP / BOTTOM PERFORMING WORLD MARKETS YTD
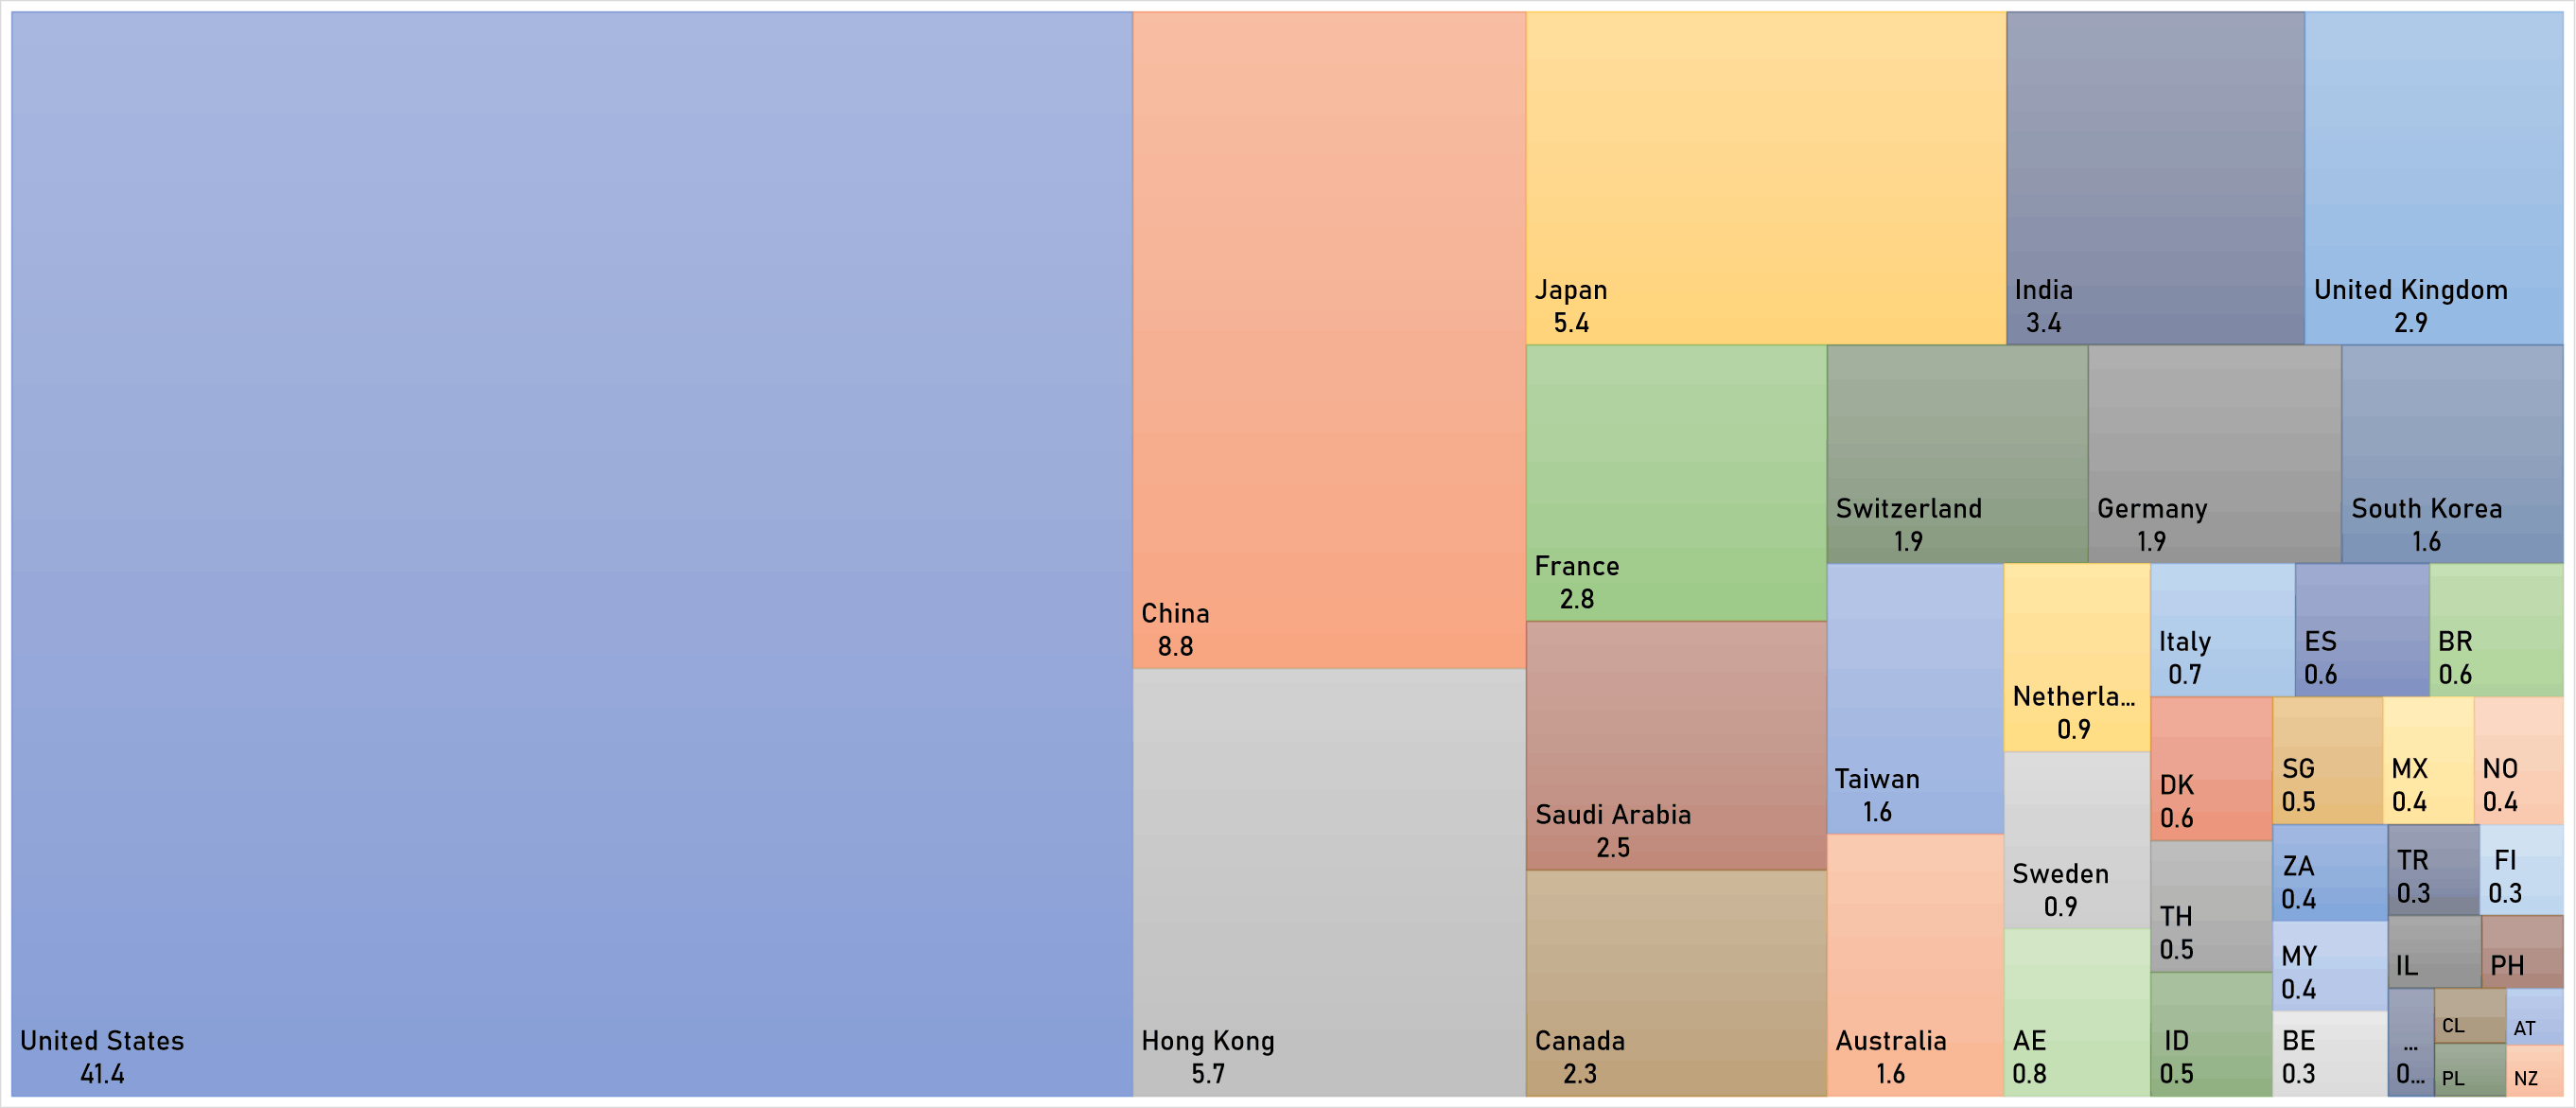
WORLD MARKET CAPITALIZATION (US$ Trillion)