Equities
Global Equities Surf On The Current Goldilocks Vibe And Kick Off 2023 With Solid Gains
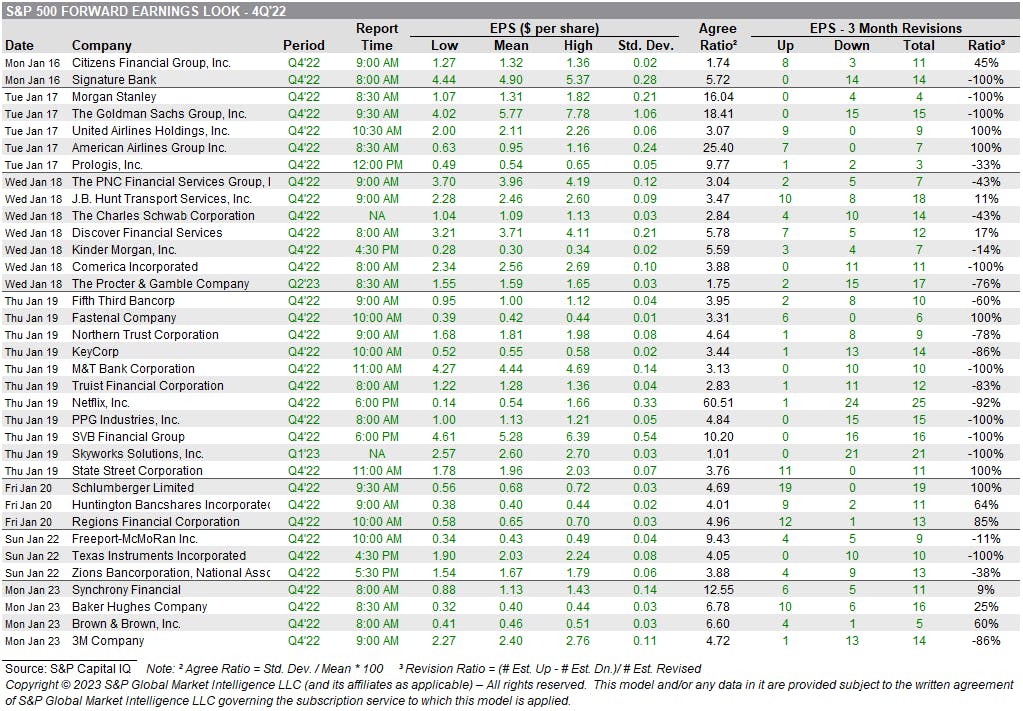
Although S&P 500 EPS estimates for CY2023 have fallen almost 5% over the past 3 months, they still project an EPS growth of nearly 5% vs CY2022; Goldman sees EPS growth of 0% this year and Jefferies expects -6.5%
Published ET
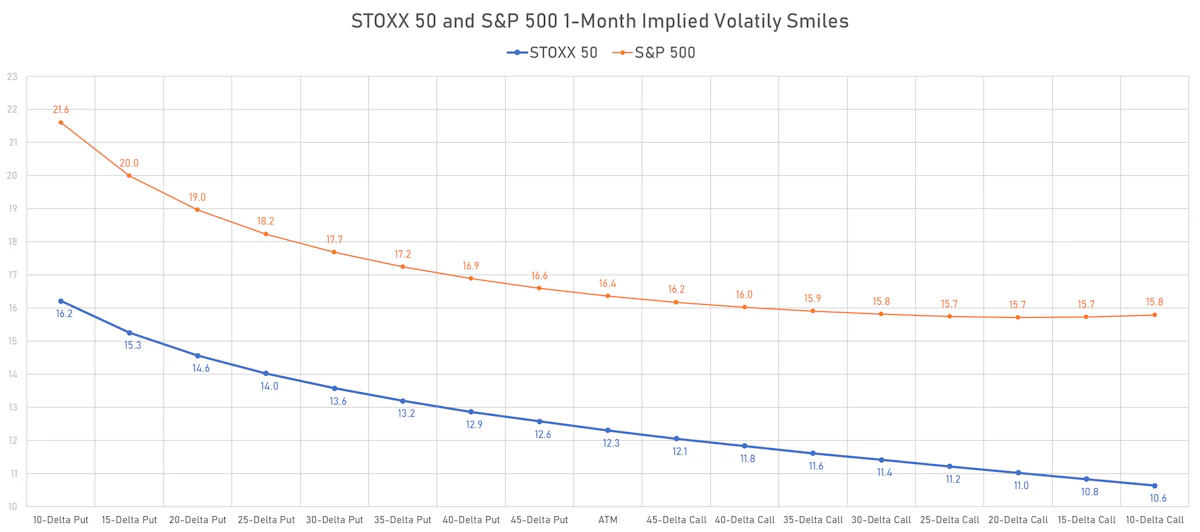
STOXX and S&P 500 1-Month Implied Volatility Smiles | Sources: ϕpost, Refinitiv data
DAILY SUMMARY
- Daily performance of US indices: S&P 500 up 0.40%; Nasdaq Composite up 0.71%; Wilshire 5000 up 0.64%
- 61.6% of S&P 500 stocks were up today, with 62.4% of stocks above their 200-day moving average (DMA) and 76.1% above their 50-DMA
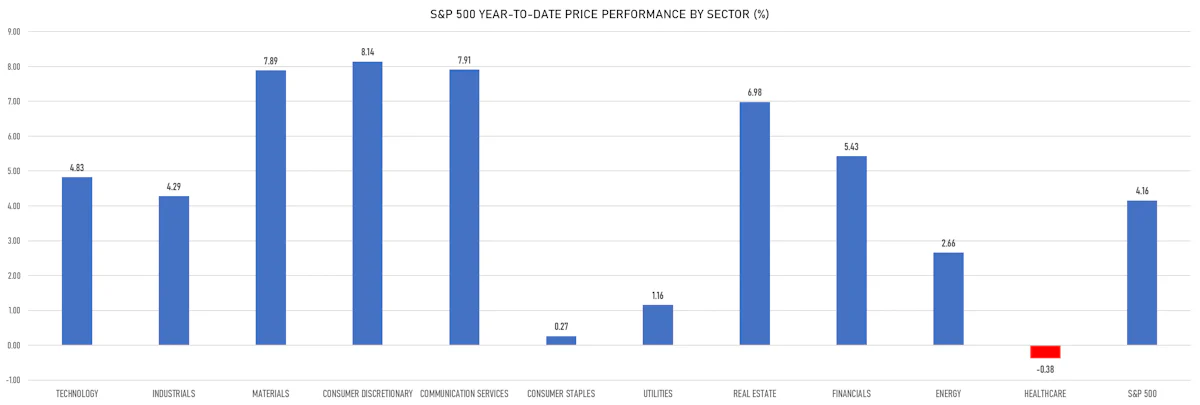
- Top performing sectors in the S&P 500: consumer discretionary up 0.97% and financials up 0.71%
- Bottom performing sectors in the S&P 500: real estate down -0.61% and utilities down -0.44%
- The number of shares in the S&P 500 traded today was 574m for a total turnover of US$ 53 bn
- The S&P 500 Value Index was up 0.4%, while the S&P 500 Growth Index was up 0.4%; the S&P small caps index was up 0.4% and mid caps were up 0.4%
- The volume on CME's INX (S&P 500 Index) was 2305.9m (3-month z-score: -0.3); the 3-month average volume is 2482.3m and the 12-month range is 903.0 - 5089.5m
- Daily performance of international indices: Europe Stoxx 600 up 0.52%; UK FTSE 100 up 0.64%; Hang Seng SH-SZ-HK 300 Index up 1.09%; Japan's TOPIX 500 down -0.28%
VOLATILITY TODAY
- 1-month at-the-money implied volatility on the S&P 500 at 16.4%, down from 16.8%
- 1-month at-the-money implied volatility on the STOXX Europe 600 at 12.4%, down from 13.5%
TOP EARNING BEATS / MISSES IN THE CURRENT QUARTER
![]()
S&P 500 EARNINGS IN THE WEEKS AHEAD
TOP WINNERS TODAY
- SmileDirectClub Inc (SDC), up 46.8% to $0.70 / YTD price return: +100.0% / 12-Month Price Range: $ 0.31-3.10 / Short interest (% of float): 20.0%; days to cover: 12.1
- Newegg Commerce Inc (NEGG), up 40.8% to $2.07 / YTD price return: +58.0% / 12-Month Price Range: $ 1.16-9.19 / Short interest (% of float): 9.8%; days to cover: 6.7
- EHang Holdings Ltd (EH), up 29.7% to $16.89 / YTD price return: +96.9% / 12-Month Price Range: $ 3.32-18.77 / Short interest (% of float): 23.0%; days to cover: 3.3
- Skyward Specialty Insurance Group Inc (SKWD), up 27.3% to $19.10 / 12-Month Price Range: $ #N/A-19.10
- Atour Lifestyle Holdings Ltd (ATAT), up 24.8% to $25.40 / YTD price return: +41.0% / 12-Month Price Range: $ 11.02-25.40
- ioneer Ltd (IONR), up 22.1% to $17.10 / YTD price return: +57.1% / 12-Month Price Range: $ 10.01-21.00 / Short interest (% of float): 0.0%; days to cover: 0.7
- Babylon Holdings Ltd (BBLN), up 20.2% to $10.81 / YTD price return: +60.1% / 12-Month Price Range: $ 6.31-179.00 / Short interest (% of float): 2.0%; days to cover: 6.4
- Summit Therapeutics Inc (SMMT), up 19.4% to $4.80 / YTD price return: +12.9% / 12-Month Price Range: $ 0.66-5.78 / Short interest (% of float): 11.5%; days to cover: 0.2
- Vicarious Surgical Inc (RBOT), up 18.6% to $2.81 / YTD price return: +39.1% / 12-Month Price Range: $ 1.69-8.30 / Short interest (% of float): 7.8%; days to cover: 7.1
- Theseus Pharmaceuticals Inc (THRX), up 18.5% to $9.60 / YTD price return: +92.8% / 12-Month Price Range: $ 4.01-15.21 / Short interest (% of float): 2.5%; days to cover: 11.0
BIGGEST LOSERS TODAY
- Bed Bath & Beyond Inc (BBBY), down 30.2% to $3.66 / YTD price return: +45.8% / 12-Month Price Range: $ 1.27-30.06 / Short interest (% of float): 33.5%; days to cover: 3.9 (the stock is currently on the short sale restriction list)
- Bakkt Holdings Inc (BKKT), down 26.3% to $2.05 / YTD price return: +72.3% / 12-Month Price Range: $ 1.13-9.01 / Short interest (% of float): 20.3%; days to cover: 9.5 (the stock is currently on the short sale restriction list)
- BigBear.ai Holdings Inc (BBAI), down 21.6% to $2.39 / YTD price return: +254.8% / 12-Month Price Range: $ .58-16.12 / Short interest (% of float): 17.9%; days to cover: 6.2 (the stock is currently on the short sale restriction list)
- Omega Therapeutics Inc (OMGA), down 21.0% to $8.65 / YTD price return: +51.5% / 12-Month Price Range: $ 1.98-14.31 / Short interest (% of float): 0.7%; days to cover: 7.5 (the stock is currently on the short sale restriction list)
- EVI Industries Inc (EVI), down 13.3% to $19.49 / YTD price return: -18.3% / 12-Month Price Range: $ 7.25-30.16 / Short interest (% of float): 4.2%; days to cover: 9.6 (the stock is currently on the short sale restriction list)
- Moolec Science SA (MLEC), down 12.8% to $7.98 / YTD price return: -34.0% / 12-Month Price Range: $ 4.35-42.25 / Short interest (% of float): 0.1%; days to cover: 0.1 (the stock is currently on the short sale restriction list)
- Carvana Co (CVNA), down 12.6% to $7.02 / YTD price return: +48.1% / 12-Month Price Range: $ 3.55-180.58 / Short interest (% of float): 56.6%; days to cover: 2.4 (the stock is currently on the short sale restriction list)
- Blend Labs Inc (BLND), down 12.5% to $1.54 / YTD price return: +6.9% / 12-Month Price Range: $ 1.00-10.22 / Short interest (% of float): 5.9%; days to cover: 5.2 (the stock is currently on the short sale restriction list)
- Molson Coors Beverage Co (TAPa), down 12.0% to $73.85 / YTD price return: -4.1% / 12-Month Price Range: $ 52.30-88.70 / Short interest (% of float): 0.0%; days to cover: 0.0 (the stock is currently on the short sale restriction list)
- Pagaya Technologies Ltd (PGY), down 11.3% to $1.10 / YTD price return: -11.3% / 12-Month Price Range: $ .57-34.50 / Short interest (% of float): 0.8%; days to cover: 1.0 (the stock is currently on the short sale restriction list)
TOP S&P 500 PERFORMERS THIS WEEK
- United Airlines Holdings Inc (UAL), up 22.3% to $51.65 / YTD price return: +37.0% / 12-Month Price Range: $ 30.54-53.11 / Short interest (% of float): 5.5%; days to cover: 2.7
- American Airlines Group Inc (AAL), up 20.0% to $17.02 / YTD price return: +33.8% / 12-Month Price Range: $ 11.66-21.42 / Short interest (% of float): 14.0%; days to cover: 3.7
- Norwegian Cruise Line Holdings Ltd (NCLH), up 19.9% to $15.63 / YTD price return: +27.7% / 12-Month Price Range: $ 10.31-23.89 / Short interest (% of float): 10.1%; days to cover: 3.5
- Warner Bros Discovery Inc (WBD), up 16.1% to $13.14 / YTD price return: +38.6% / 12-Month Price Range: $ 8.83-31.55 / Short interest (% of float): 5.1%; days to cover: 3.9
- Royal Caribbean Cruises Ltd (RCL), up 15.4% to $63.48 / YTD price return: +28.4% / 12-Month Price Range: $ 31.09-90.53 / Short interest (% of float): 9.5%; days to cover: 6.3
- First Solar Inc (FSLR), up 14.9% to $180.19 / YTD price return: +20.3% / 12-Month Price Range: $ 59.60-180.19 / Short interest (% of float): 3.9%; days to cover: 1.3
- Carnival Corp (CCL), up 14.2% to $10.51 / YTD price return: +30.4% / 12-Month Price Range: $ 6.12-23.85 / Short interest (% of float): 12.9%; days to cover: 2.9
- Amazon.com Inc (AMZN), up 14.0% to $98.12 / YTD price return: +16.8% / 12-Month Price Range: $ 81.44-170.83 / Short interest (% of float): 0.8%; days to cover: 1.1
- NVIDIA Corp (NVDA), up 13.7% to $168.99 / YTD price return: +15.6% / 12-Month Price Range: $ 108.14-289.34 / Short interest (% of float): 1.6%; days to cover: 0.9
- ServiceNow Inc (NOW), up 13.2% to $414.89 / YTD price return: +6.9% / 12-Month Price Range: $ 337.22-621.25 / Short interest (% of float): 1.7%; days to cover: 2.8
BOTTOM S&P 500 PERFORMERS THIS WEEK
- Abbvie Inc (ABBV), down 7.8% to $153.60 / YTD price return: -5.0% / 12-Month Price Range: $ 128.30-175.91 / Short interest (% of float): 0.7%; days to cover: 2.6
- Baxter International Inc (BAX), down 7.5% to $44.84 / YTD price return: -12.0% / 12-Month Price Range: $ 44.47-89.69 / Short interest (% of float): 1.5%; days to cover: 1.6
- Teleflex Inc (TFX), down 6.6% to $240.98 / YTD price return: -3.5% / 12-Month Price Range: $ 183.50-356.37 / Short interest (% of float): 2.5%; days to cover: 2.9
- Dexcom Inc (DXCM), down 6.3% to $108.47 / YTD price return: -4.2% / 12-Month Price Range: $ 66.94-134.50 / Short interest (% of float): 3.0%; days to cover: 4.6
- Leidos Holdings Inc (LDOS), down 6.3% to $98.35 / YTD price return: -6.5% / 12-Month Price Range: $ 81.26-111.10 / Short interest (% of float): 1.4%; days to cover: 2.4
- Dollar General Corp (DG), down 6.1% to $233.52 / YTD price return: -5.2% / 12-Month Price Range: $ 183.42-262.10 / Short interest (% of float): 1.6%; days to cover: 1.7
- Pfizer Inc (PFE), down 6.0% to $47.85 / YTD price return: -6.6% / 12-Month Price Range: $ 41.45-56.60 / Short interest (% of float): 0.8%; days to cover: 2.2
- McCormick & Company Inc (MKC), down 6.0% to $81.10 / YTD price return: -2.2% / 12-Month Price Range: $ 71.19-107.34 / Short interest (% of float): 2.8%; days to cover: 6.0
- Zoetis Inc (ZTS), down 5.8% to $144.46 / YTD price return: -40.8% / 12-Month Price Range: $ 124.46-247.89 / Short interest (% of float): 0.7%; days to cover: 1.6
- J M Smucker Co (SJM), down 5.0% to $154.43 / YTD price return: -2.5% / 12-Month Price Range: $ 119.90-163.06 / Short interest (% of float): 3.5%; days to cover: 4.5
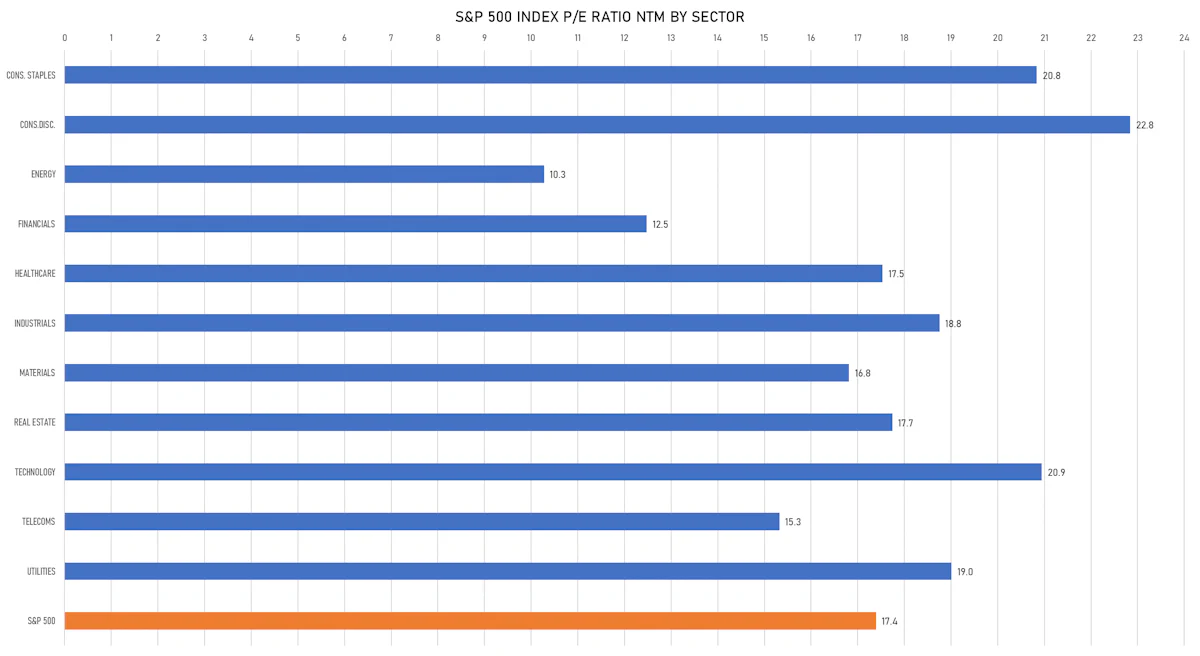
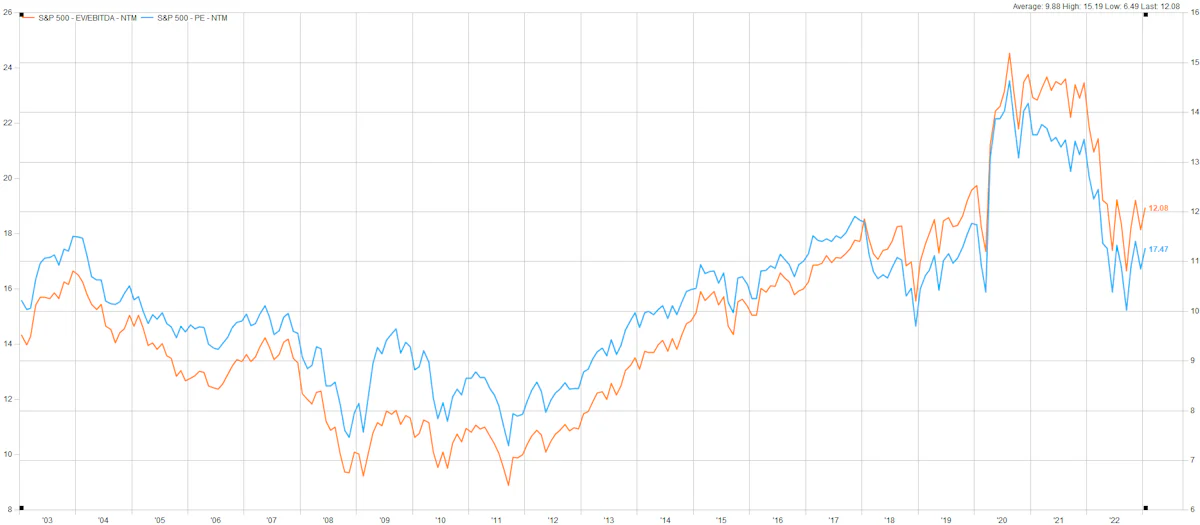
VALUATION MULTIPLES BY SECTORS
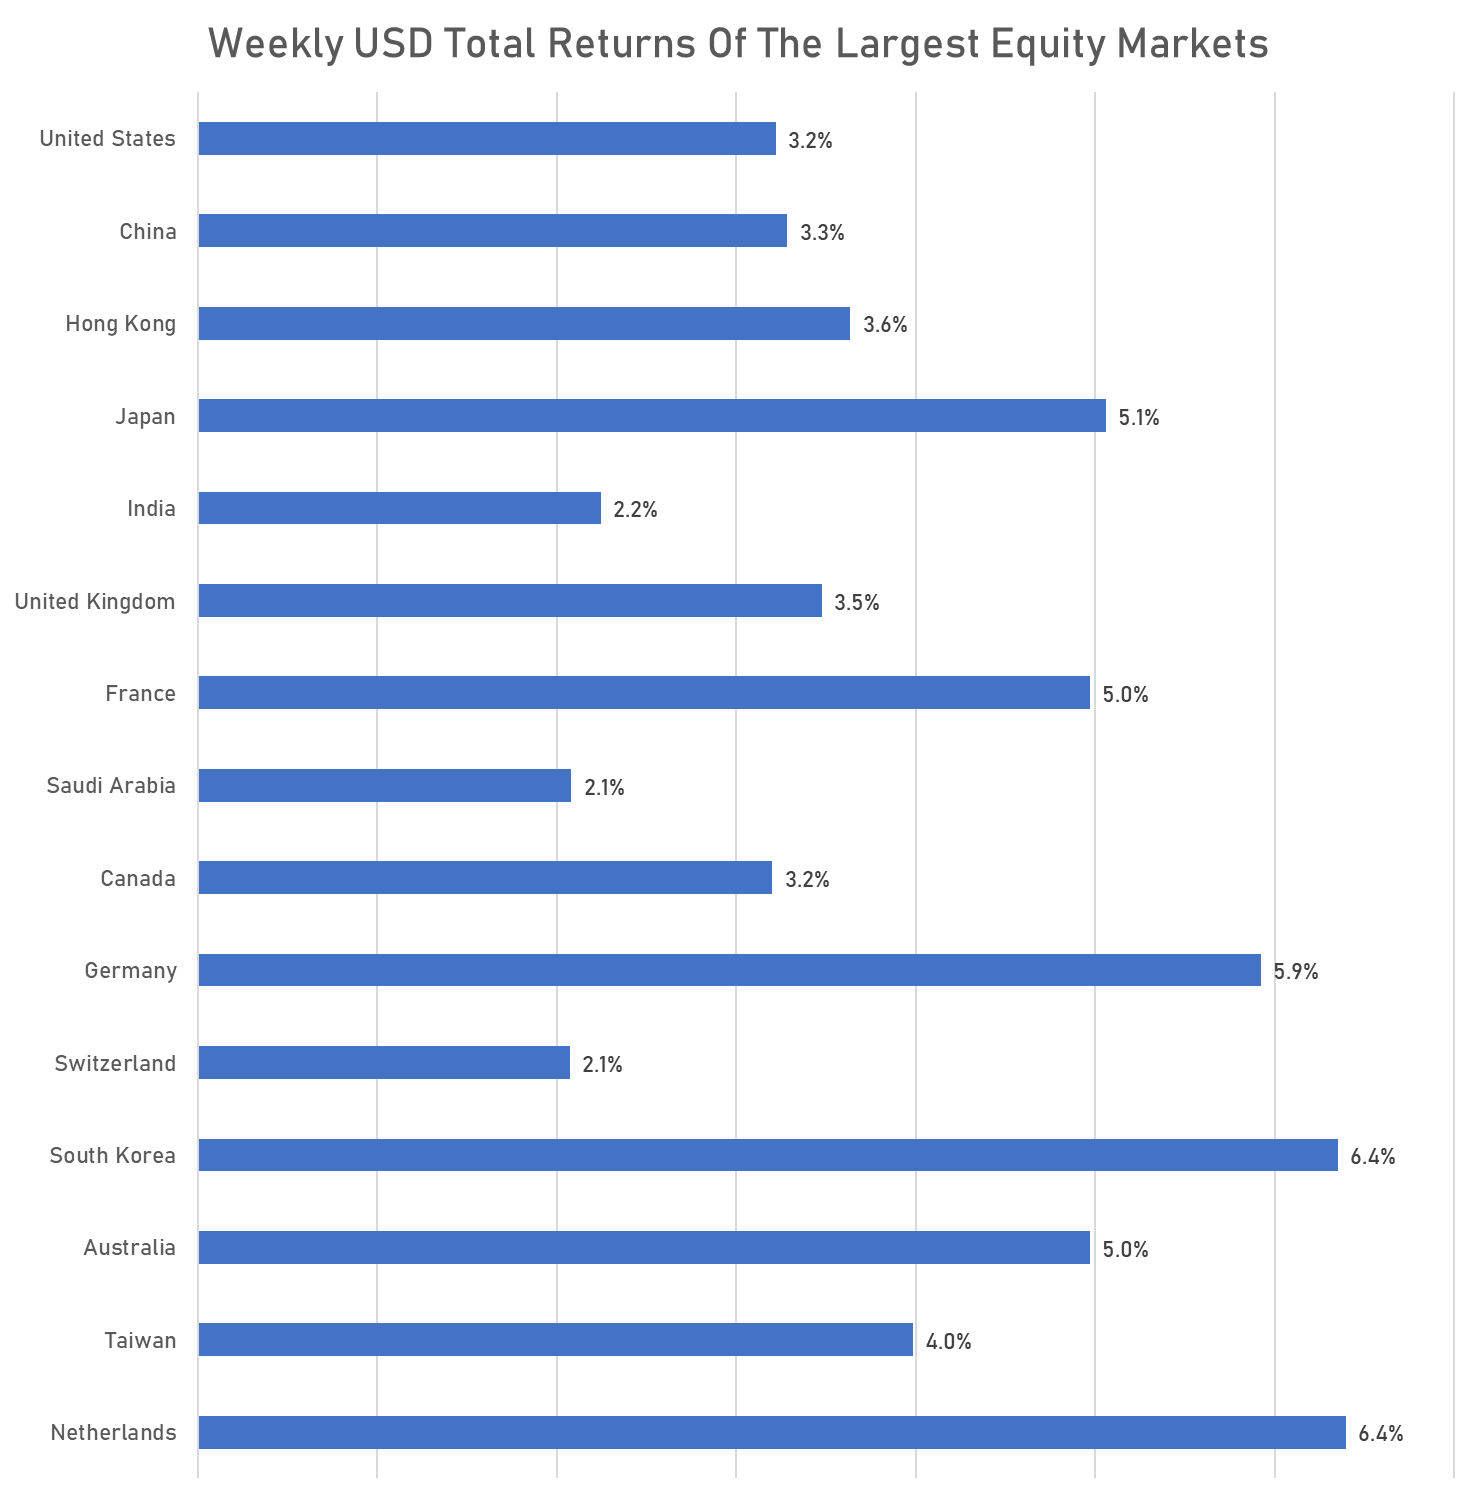
WEEKLY TOTAL RETURNS OF MAJOR GLOBAL EQUITY MARKETS
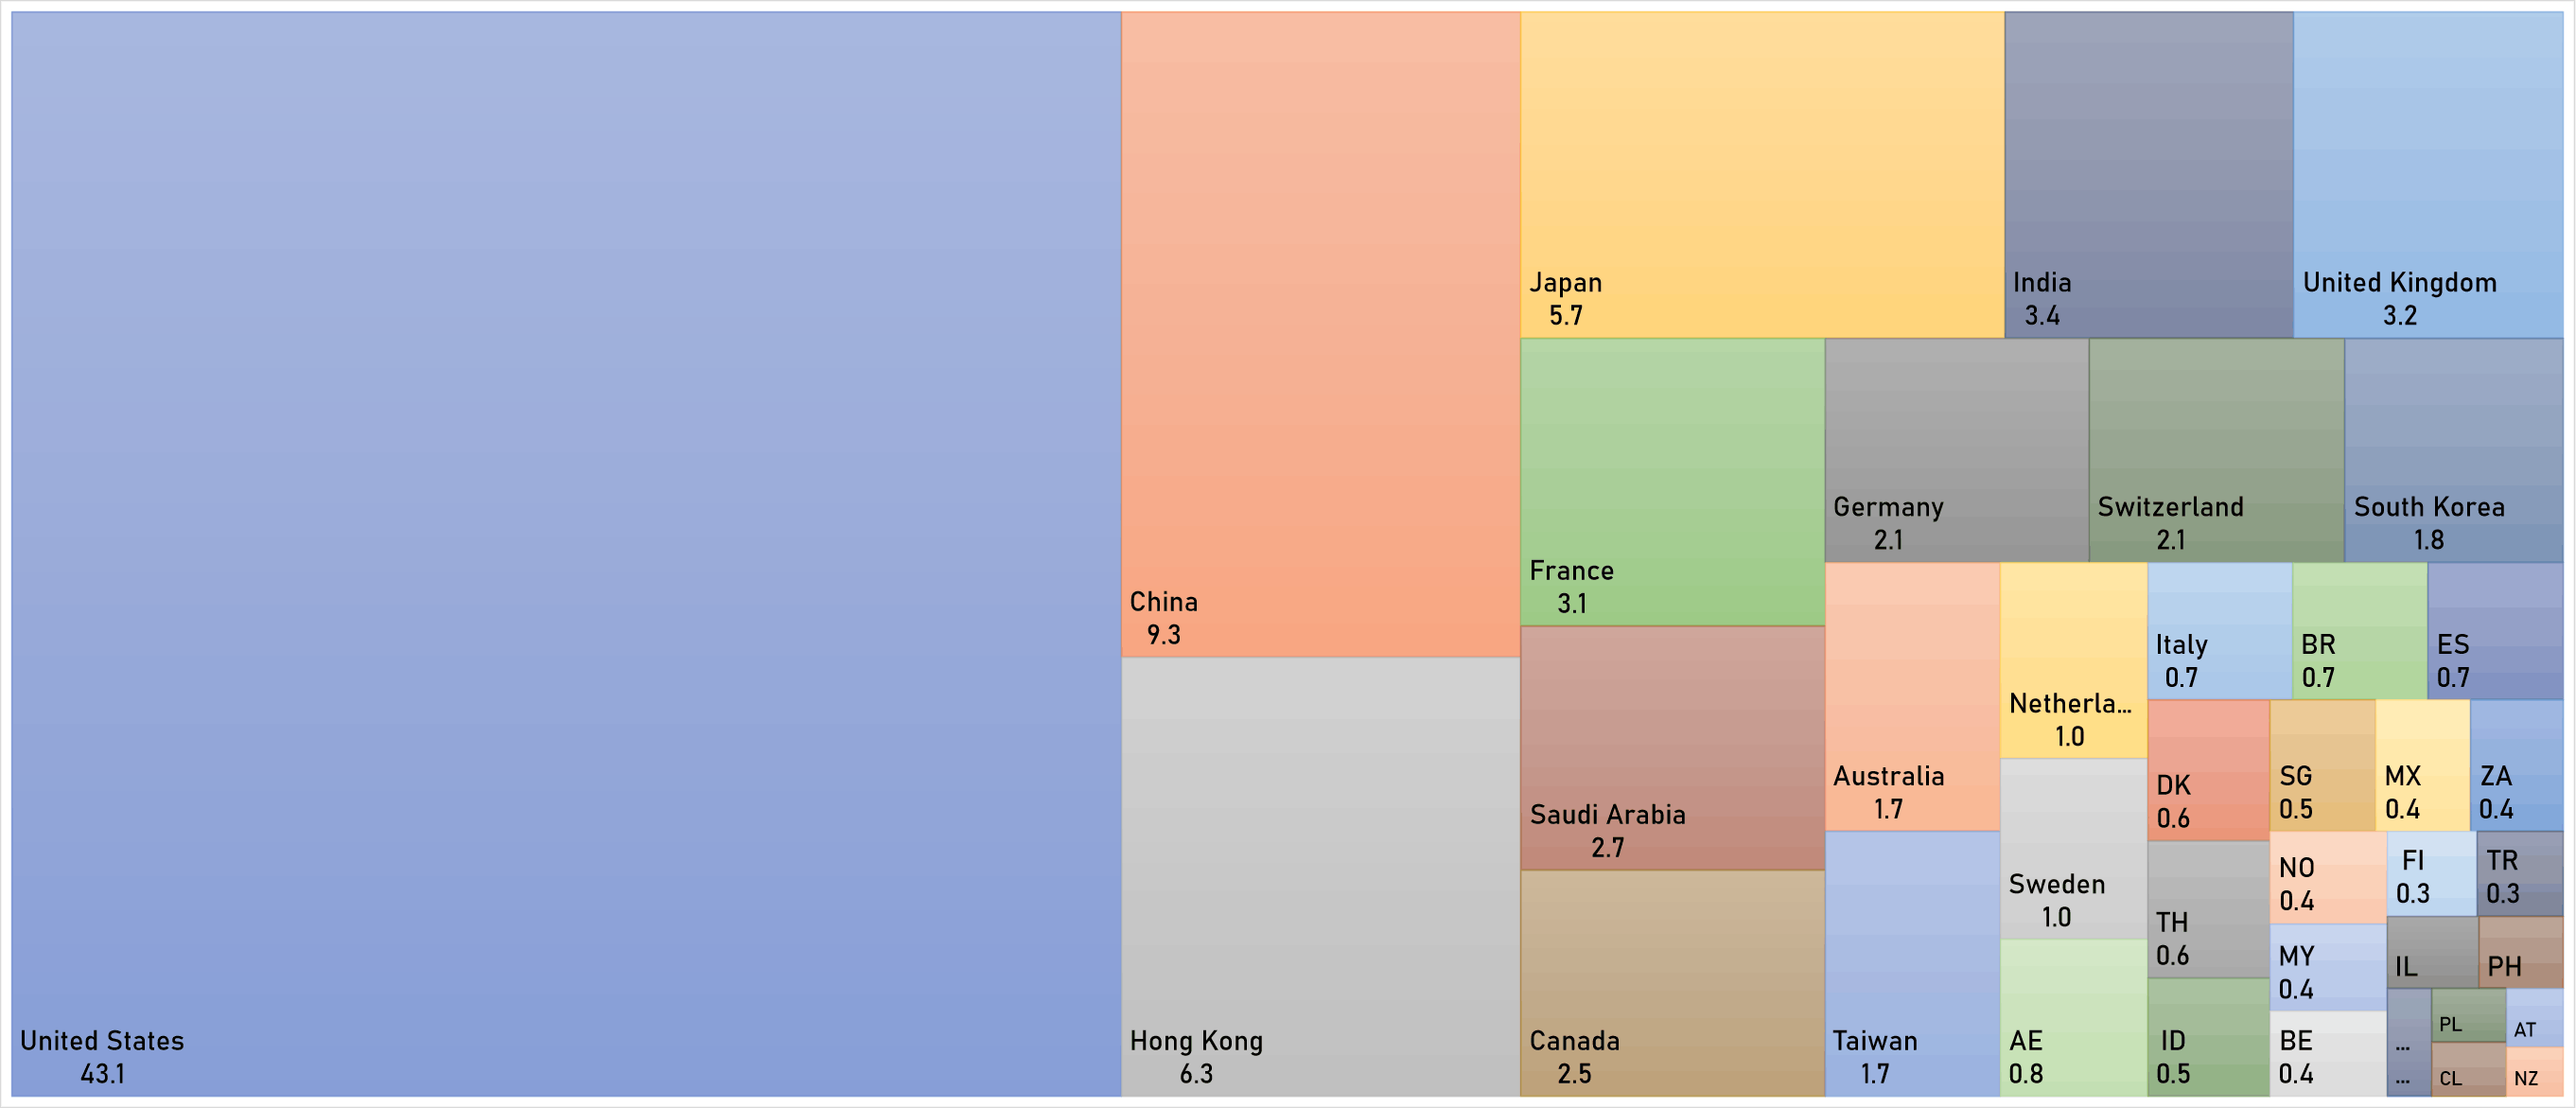
WORLD MARKET CAPITALIZATION (US$ Trillion)