Equities
Equities Weaken As 4Q22 Earnings Start Rolling In, With 17% Of The S&P 500 Reporting In The Week Ahead
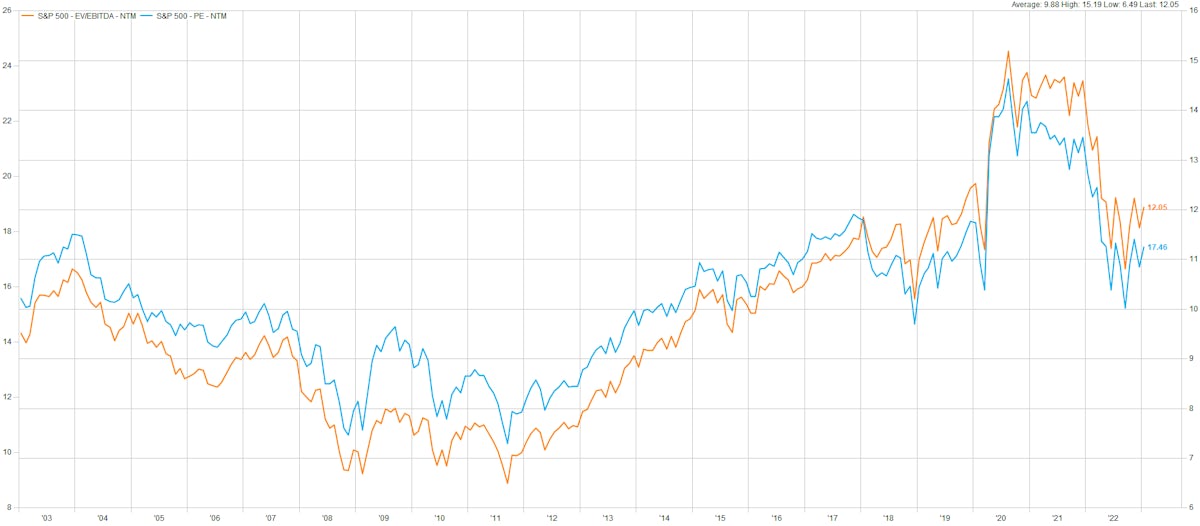
It's hard to see much upside from here for US stocks over the next 12 months, with the S&P 500 forward P/E around the 80th historical percentile and downward earnings revisions just beginning in earnest
Published ET
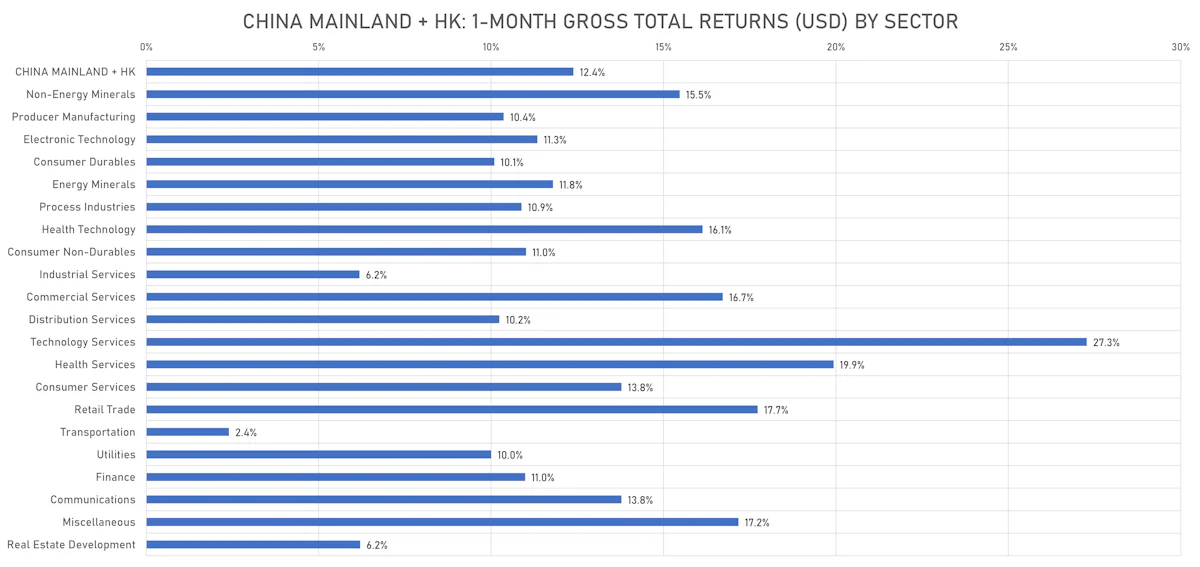
China Mainland + HK 1-Month Gross Total Returns (USD) | Sources: phipost.com, FactSet data
DAILY SUMMARY
- Daily performance of US indices: S&P 500 up 1.89%; Nasdaq Composite up 2.66%; Wilshire 5000 up 1.41%
- 91.8% of S&P 500 stocks were up today, with 57.7% of stocks above their 200-day moving average (DMA) and 61.8% above their 50-DMA
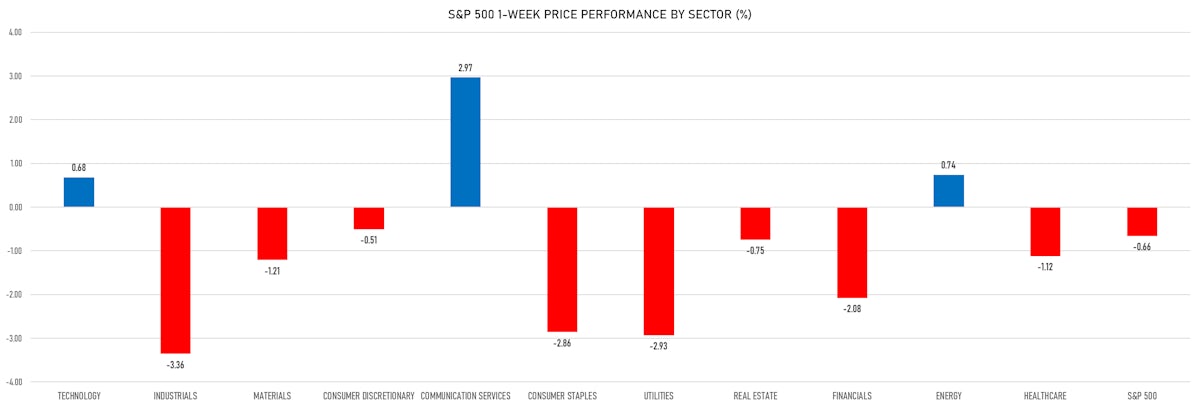
- Top performing sectors in the S&P 500: communication services up 3.96% and technology up 2.72%
- Bottom performing sectors in the S&P 500: healthcare up 0.57% and utilities up 0.59%
- The number of shares in the S&P 500 traded today was 831m for a total turnover of US$ 82 bn
- The S&P 500 Value Index was up 1.8%, while the S&P 500 Growth Index was up 2.0%; the S&P small caps index was up 1.7% and mid caps were up 1.8%
- The volume on CME's INX (S&P 500 Index) was 2617.4m (3-month z-score: 0.3); the 3-month average volume is 2466.9m and the 12-month range is 903.0 - 5089.5m
- Daily performance of international indices: Europe Stoxx 600 up 0.37%; UK FTSE 100 up 0.30%; Hang Seng SH-SZ-HK 300 Index up 1.17%; Japan's TOPIX 500 up 0.58%
VOLATILITY TODAY
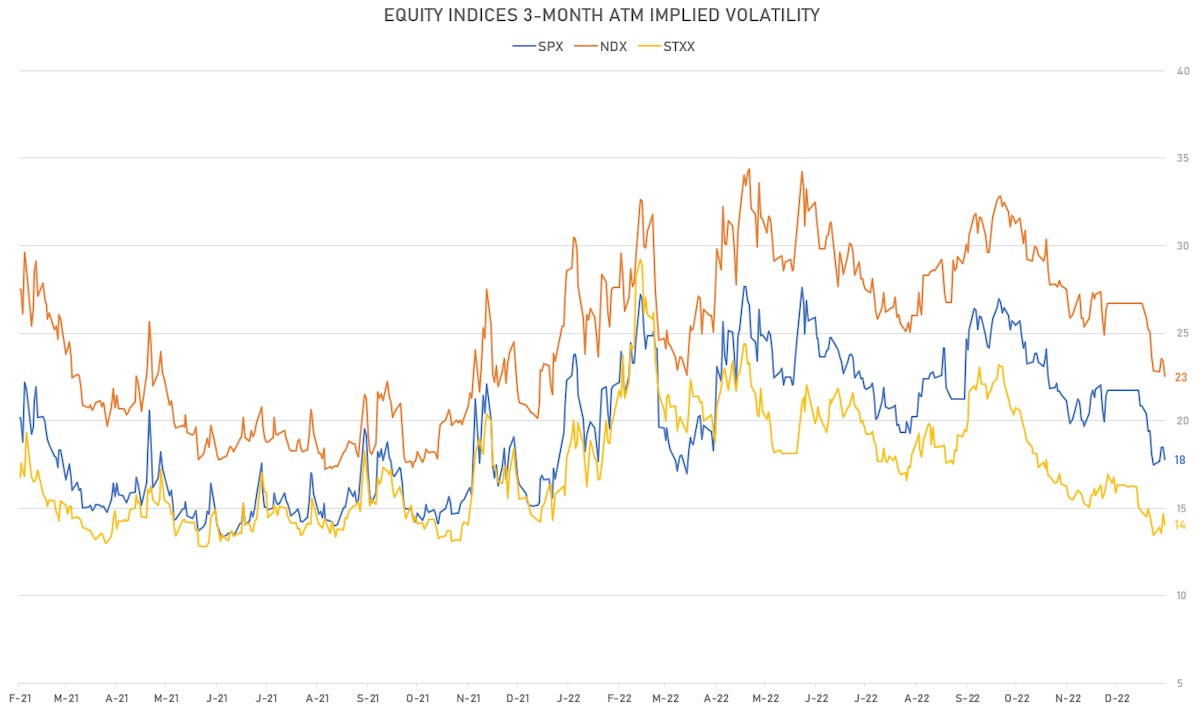
- 3-month at-the-money implied volatility on the S&P 500 at 17.8%, down from 18.5%
- 3-month at-the-money implied volatility on the STOXX Europe 600 at 14.2%, down from 14.9%
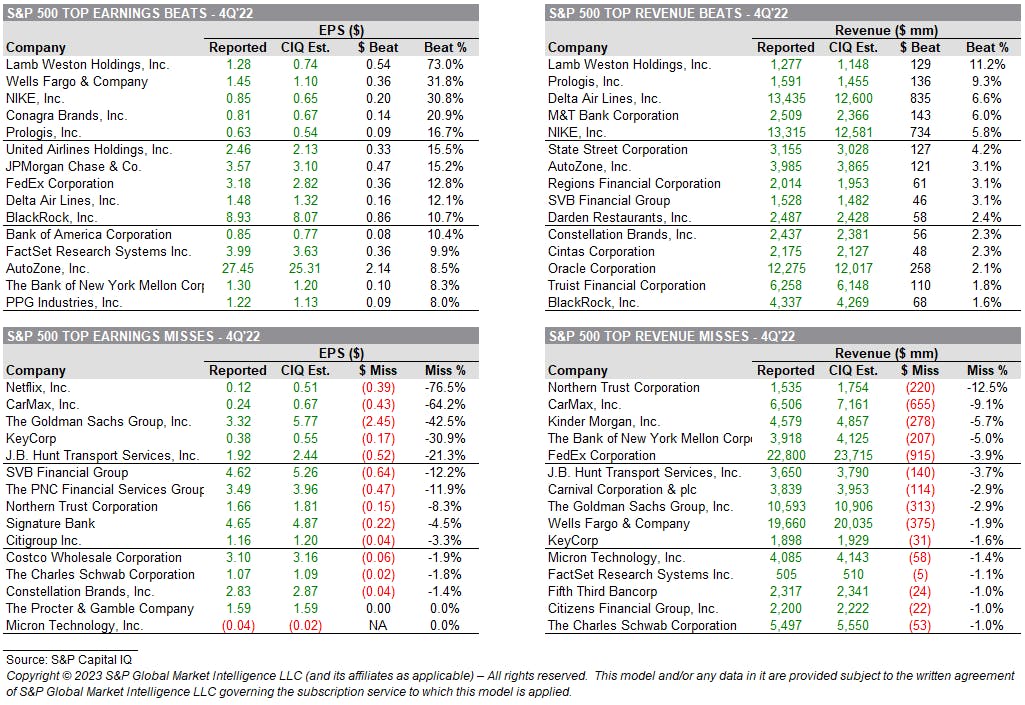
US EARNINGS IN THE WEEK AHHEAD
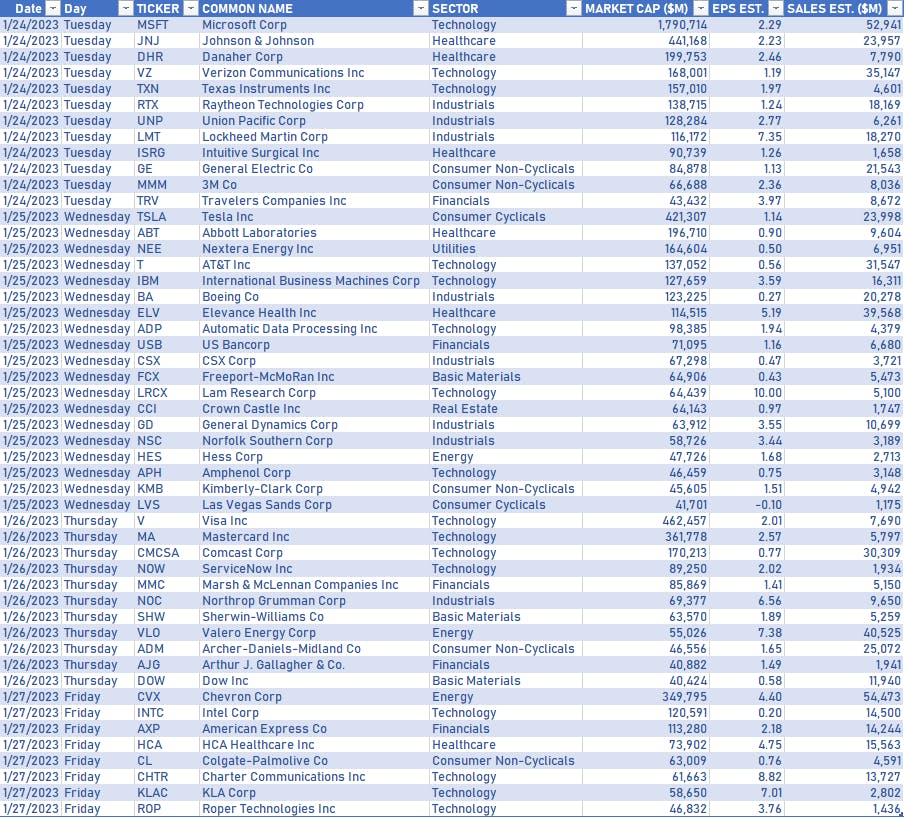
S&P 500 EARNINGS TRACKER
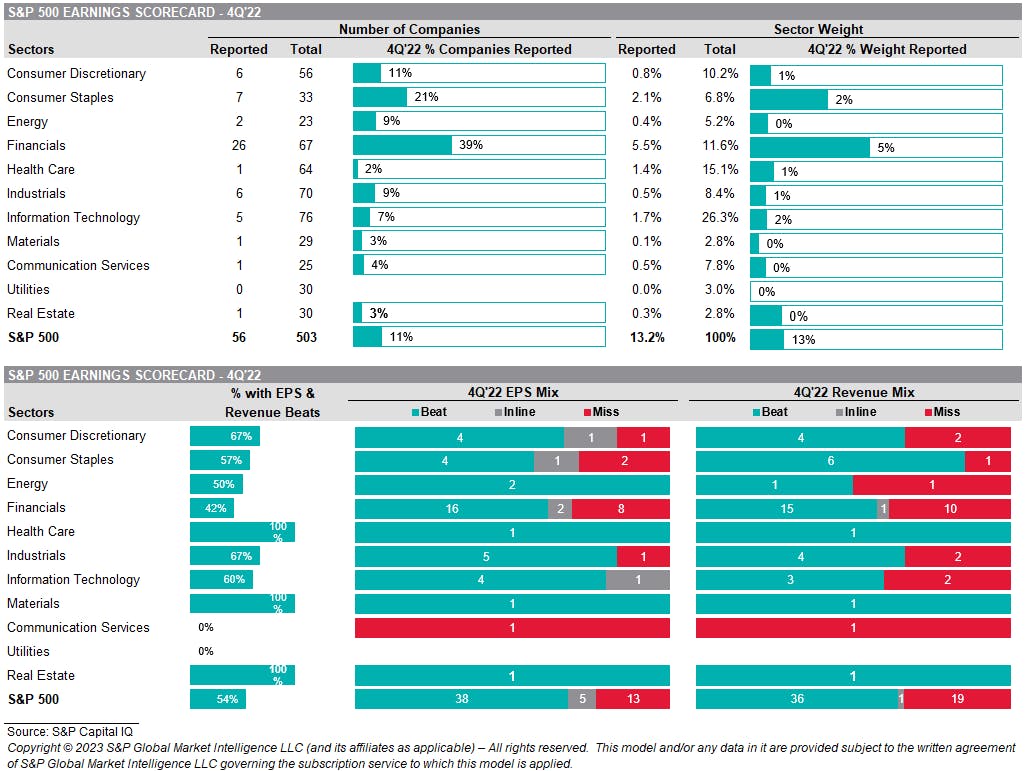
TOP EARNINGS BEATS / MISSES
TOP WINNERS TODAY
- Astronics Corp (ATRO), up 41.8% to $14.66 / YTD price return: +42.3% / 12-Month Price Range: $ 7.46-14.87 / Short interest (% of float): 1.8%; days to cover: 2.8
- MicroCloud Hologram Inc (HOLO), up 35.2% to $11.22 / YTD price return: +394.3% / 12-Month Price Range: $ 1.57-35.00 / Short interest (% of float): 2.3%; days to cover: 1.7
- Eargo Inc (EAR), up 26.1% to $14.56 / YTD price return: +26.6% / 12-Month Price Range: $ 9.60-116.80 / Short interest (% of float): 6.0%; days to cover: 3.8
- Tuniu Corp (TOUR), up 23.1% to $2.24 / YTD price return: +48.3% / 12-Month Price Range: $ 0.46-2.52 / Short interest (% of float): 1.3%; days to cover: 0.8
- Wayfair Inc (W), up 20.3% to $46.79 / YTD price return: +42.3% / 12-Month Price Range: $ 28.11-163.99 / Short interest (% of float): 34.4%; days to cover: 5.9
- Ally Financial Inc (ALLY), up 20.0% to $31.43 / YTD price return: +28.5% / 12-Month Price Range: $ 22.34-51.05 / Short interest (% of float): 5.6%; days to cover: 3.5
- Vaxxinity Inc (VAXX), up 20.0% to $3.00 / YTD price return: +114.3% / 12-Month Price Range: $ 1.24-8.88 / Short interest (% of float): 2.0%; days to cover: 1.8
- Global Blue Group Holding Ltd (GB), up 17.9% to $6.25 / YTD price return: +35.0% / 12-Month Price Range: $ 3.49-7.68 / Short interest (% of float): 0.2%; days to cover: 3.7
- Lanvin Group Holdings Ltd (LANV), up 17.3% to $6.10 / YTD price return: -33.1% / 12-Month Price Range: $ 4.19-22.81 / Short interest (% of float): 0.0%; days to cover: 0.2
- Affirm Holdings Inc (AFRM), up 16.7% to $14.30 / YTD price return: +47.9% / 12-Month Price Range: $ 8.62-83.57 / Short interest (% of float): 16.4%; days to cover: 2.4
BIGGEST LOSERS TODAY
- FARO Technologies Inc (FARO), down 21.0% to $27.87 / YTD price return: -5.2% / 12-Month Price Range: $ 25.20-61.20 / Short interest (% of float): 2.2%; days to cover: 4.0 (the stock is currently on the short sale restriction list)
- Rayonier Advanced Materials Inc (RYAM), down 16.2% to $5.68 / YTD price return: -40.8% / 12-Month Price Range: $ 2.44-9.84 / Short interest (% of float): 2.4%; days to cover: 3.5 (the stock is currently on the short sale restriction list)
- EHang Holdings Ltd (EH), down 11.7% to $11.10 / YTD price return: +29.4% / 12-Month Price Range: $ 3.32-18.77 / Short interest (% of float): 23.0%; days to cover: 3.3 (the stock is currently on the short sale restriction list)
- Bed Bath & Beyond Inc (BBBY), down 11.6% to $3.35 / YTD price return: +33.5% / 12-Month Price Range: $ 1.27-30.06 / Short interest (% of float): 33.5%; days to cover: 3.9 (the stock is currently on the short sale restriction list)
- P3 Health Partners Inc (PIII), down 8.3% to $1.43 / YTD price return: -22.3% / 12-Month Price Range: $ 1.43-8.49 / Short interest (% of float): 13.3%; days to cover: 20.8 (the stock is currently on the short sale restriction list)
- Gorilla Technology Group Inc (GRRR), down 8.2% to $7.09 / YTD price return: -12.6% / 12-Month Price Range: $ 2.62-51.00 / Short interest (% of float): 0.1%; days to cover: 0.3 (the stock is currently on the short sale restriction list)
- 1st Source Corp (SRCE), down 8.0% to $46.61 / YTD price return: -12.2% / 12-Month Price Range: $ 42.29-59.94 / Short interest (% of float): 0.8%; days to cover: 4.6 (the stock is currently on the short sale restriction list)
- Procaps Group SA (PROC), down 8.0% to $4.50 / YTD price return: -14.3% / 12-Month Price Range: $ 4.10-10.20 / Short interest (% of float): 1.3%; days to cover: 7.5
- Squarespace Inc (SQSP), down 7.9% to $21.11 / YTD price return: -4.8% / 12-Month Price Range: $ 14.43-34.97 / Short interest (% of float): 2.3%; days to cover: 2.9 (the stock is currently on the short sale restriction list)
- Purple Innovation Inc (PRPL), down 7.8% to $5.08 / YTD price return: +6.1% / 12-Month Price Range: $ 2.65-9.54 / Short interest (% of float): 5.8%; days to cover: 9.7
TOP S&P 500 PERFORMERS IN THE PAST WEEK
- SVB Financial Group (SIVB), up 15.3% to $291.44 / YTD price return: +26.6% / 12-Month Price Range: $ 198.10-674.31 / Short interest (% of float): 6.7%; days to cover: 3.9
- Match Group Inc (MTCH), up 9.3% to $50.42 / YTD price return: +21.5% / 12-Month Price Range: $ 38.65-122.08 / Short interest (% of float): 3.9%; days to cover: 2.5
- Tesla Inc (TSLA), up 9.0% to $133.42 / YTD price return: +8.3% / 12-Month Price Range: $ 101.83-384.15 / Short interest (% of float): 3.0%; days to cover: 0.6
- Signature Bank (SBNY), up 8.0% to $127.79 / YTD price return: +10.9% / 12-Month Price Range: $ 106.81-355.19 / Short interest (% of float): 5.4%; days to cover: 3.1
- Resmed Inc (RMD), up 7.6% to $234.73 / YTD price return: +12.8% / 12-Month Price Range: $ 189.61-262.38 / Short interest (% of float): 0.7%; days to cover: 2.0
- Alphabet Inc (GOOG), up 7.0% to $99.28 / YTD price return: +11.9% / 12-Month Price Range: $ 83.46-152.03 / Short interest (% of float): 0.6%; days to cover: 1.4
- J B Hunt Transport Services Inc (JBHT), up 7.0% to $189.10 / YTD price return: +8.5% / 12-Month Price Range: $ 153.98-218.14 / Short interest (% of float): 3.1%; days to cover: 4.1
- ServiceNow Inc (NOW), up 6.5% to $441.83 / YTD price return: +13.8% / 12-Month Price Range: $ 337.22-621.25 / Short interest (% of float): 1.7%; days to cover: 2.8
- Alphabet Inc (GOOGL), up 6.4% to $98.02 / YTD price return: +11.1% / 12-Month Price Range: $ 83.34-151.45 / Short interest (% of float): 0.7%; days to cover: 1.6
- Fidelity National Information Services Inc (FIS), up 6.0% to $73.92 / YTD price return: +8.9% / 12-Month Price Range: $ 56.53-122.00 / Short interest (% of float): 1.1%; days to cover: 0.9
BOTTOM S&P 500 PERFORMERS IN THE PAST WEEK
- Lumen Technologies Inc (LUMN), down 11.5% to $5.22 / YTD price return: .0% / 12-Month Price Range: $ 4.99-12.93 / Short interest (% of float): 13.2%; days to cover: 5.6
- Emerson Electric Co (EMR), down 10.8% to $87.35 / YTD price return: -9.1% / 12-Month Price Range: $ 72.43-100.00 / Short interest (% of float): 1.4%; days to cover: 2.5
- Allstate Corp (ALL), down 9.6% to $125.65 / YTD price return: -7.3% / 12-Month Price Range: $ 111.89-144.46 / Short interest (% of float): 1.3%; days to cover: 2.3
- Enphase Energy Inc (ENPH), down 9.5% to $222.54 / YTD price return: -16.0% / 12-Month Price Range: $ 113.49-339.88 / Short interest (% of float): 3.7%; days to cover: 1.5
- Goldman Sachs Group Inc (GS), down 8.6% to $341.84 / YTD price return: -.4% / 12-Month Price Range: $ 277.84-389.41 / Short interest (% of float): 1.3%; days to cover: 2.2
- Trane Technologies PLC (TT), down 7.4% to $169.88 / YTD price return: +1.0% / 12-Month Price Range: $ 120.64-183.94 / Short interest (% of float): 1.2%; days to cover: 2.5
- Carrier Global Corp (CARR), down 7.2% to $42.57 / YTD price return: +3.2% / 12-Month Price Range: $ 33.12-50.18 / Short interest (% of float): 0.9%; days to cover: 2.2
- Charles Schwab Corp (SCHW), down 7.2% to $77.03 / YTD price return: -7.5% / 12-Month Price Range: $ 59.35-96.24 / Short interest (% of float): 1.0%; days to cover: 2.7
- 3M Co (MMM), down 6.8% to $120.65 / YTD price return: +.6% / 12-Month Price Range: $ 107.09-179.20 / Short interest (% of float): 2.5%; days to cover: 5.0
- First Solar Inc (FSLR), down 6.8% to $167.87 / YTD price return: +12.1% / 12-Month Price Range: $ 59.60-185.28 / Short interest (% of float): 3.9%; days to cover: 1.3
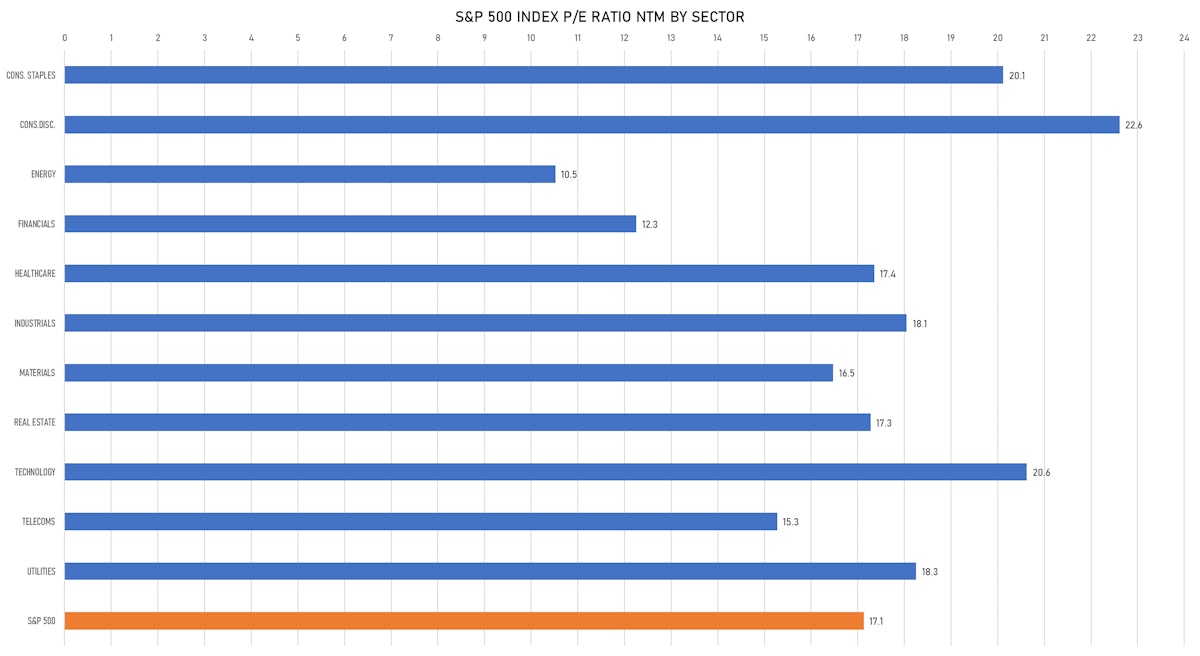
VALUATION MULTIPLES BY SECTORS
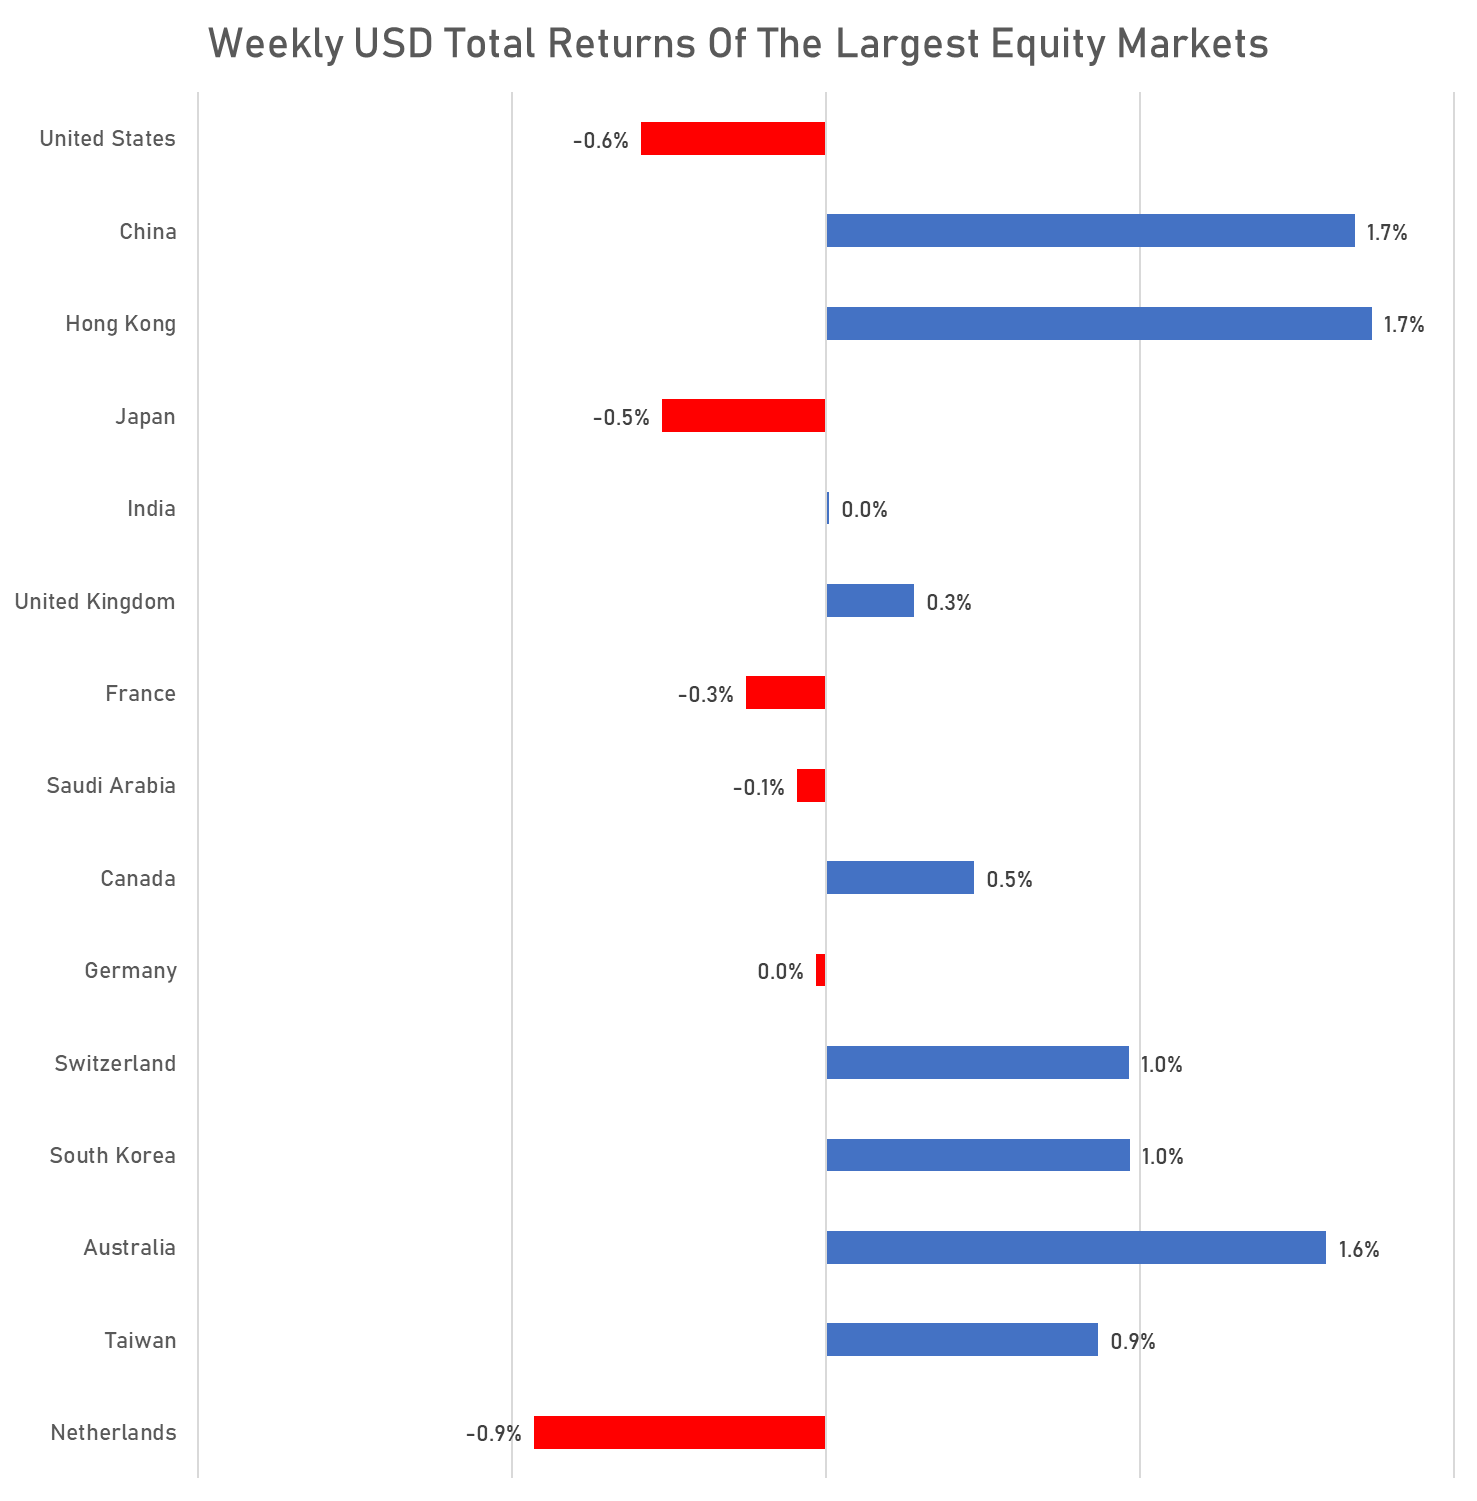
WEEKLY TOTAL RETURNS OF MAJOR GLOBAL EQUITY MARKETS
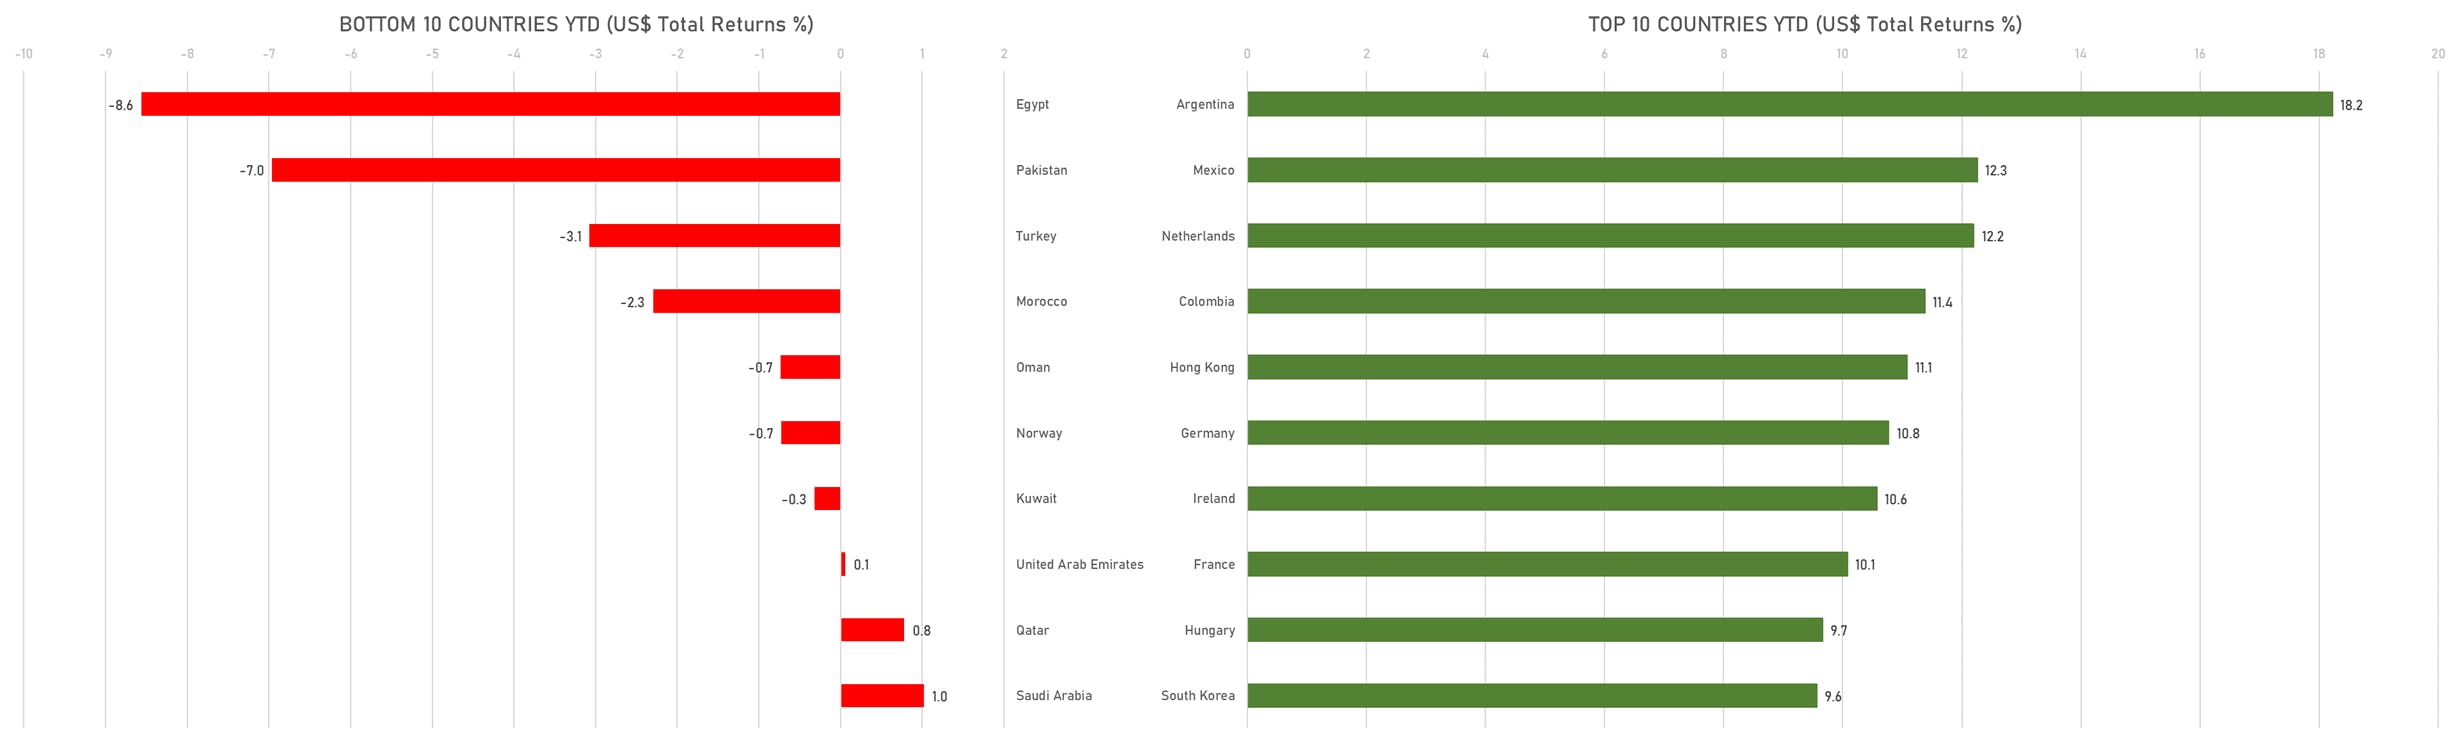
TOP / BOTTOM PERFORMING WORLD MARKETS YTD
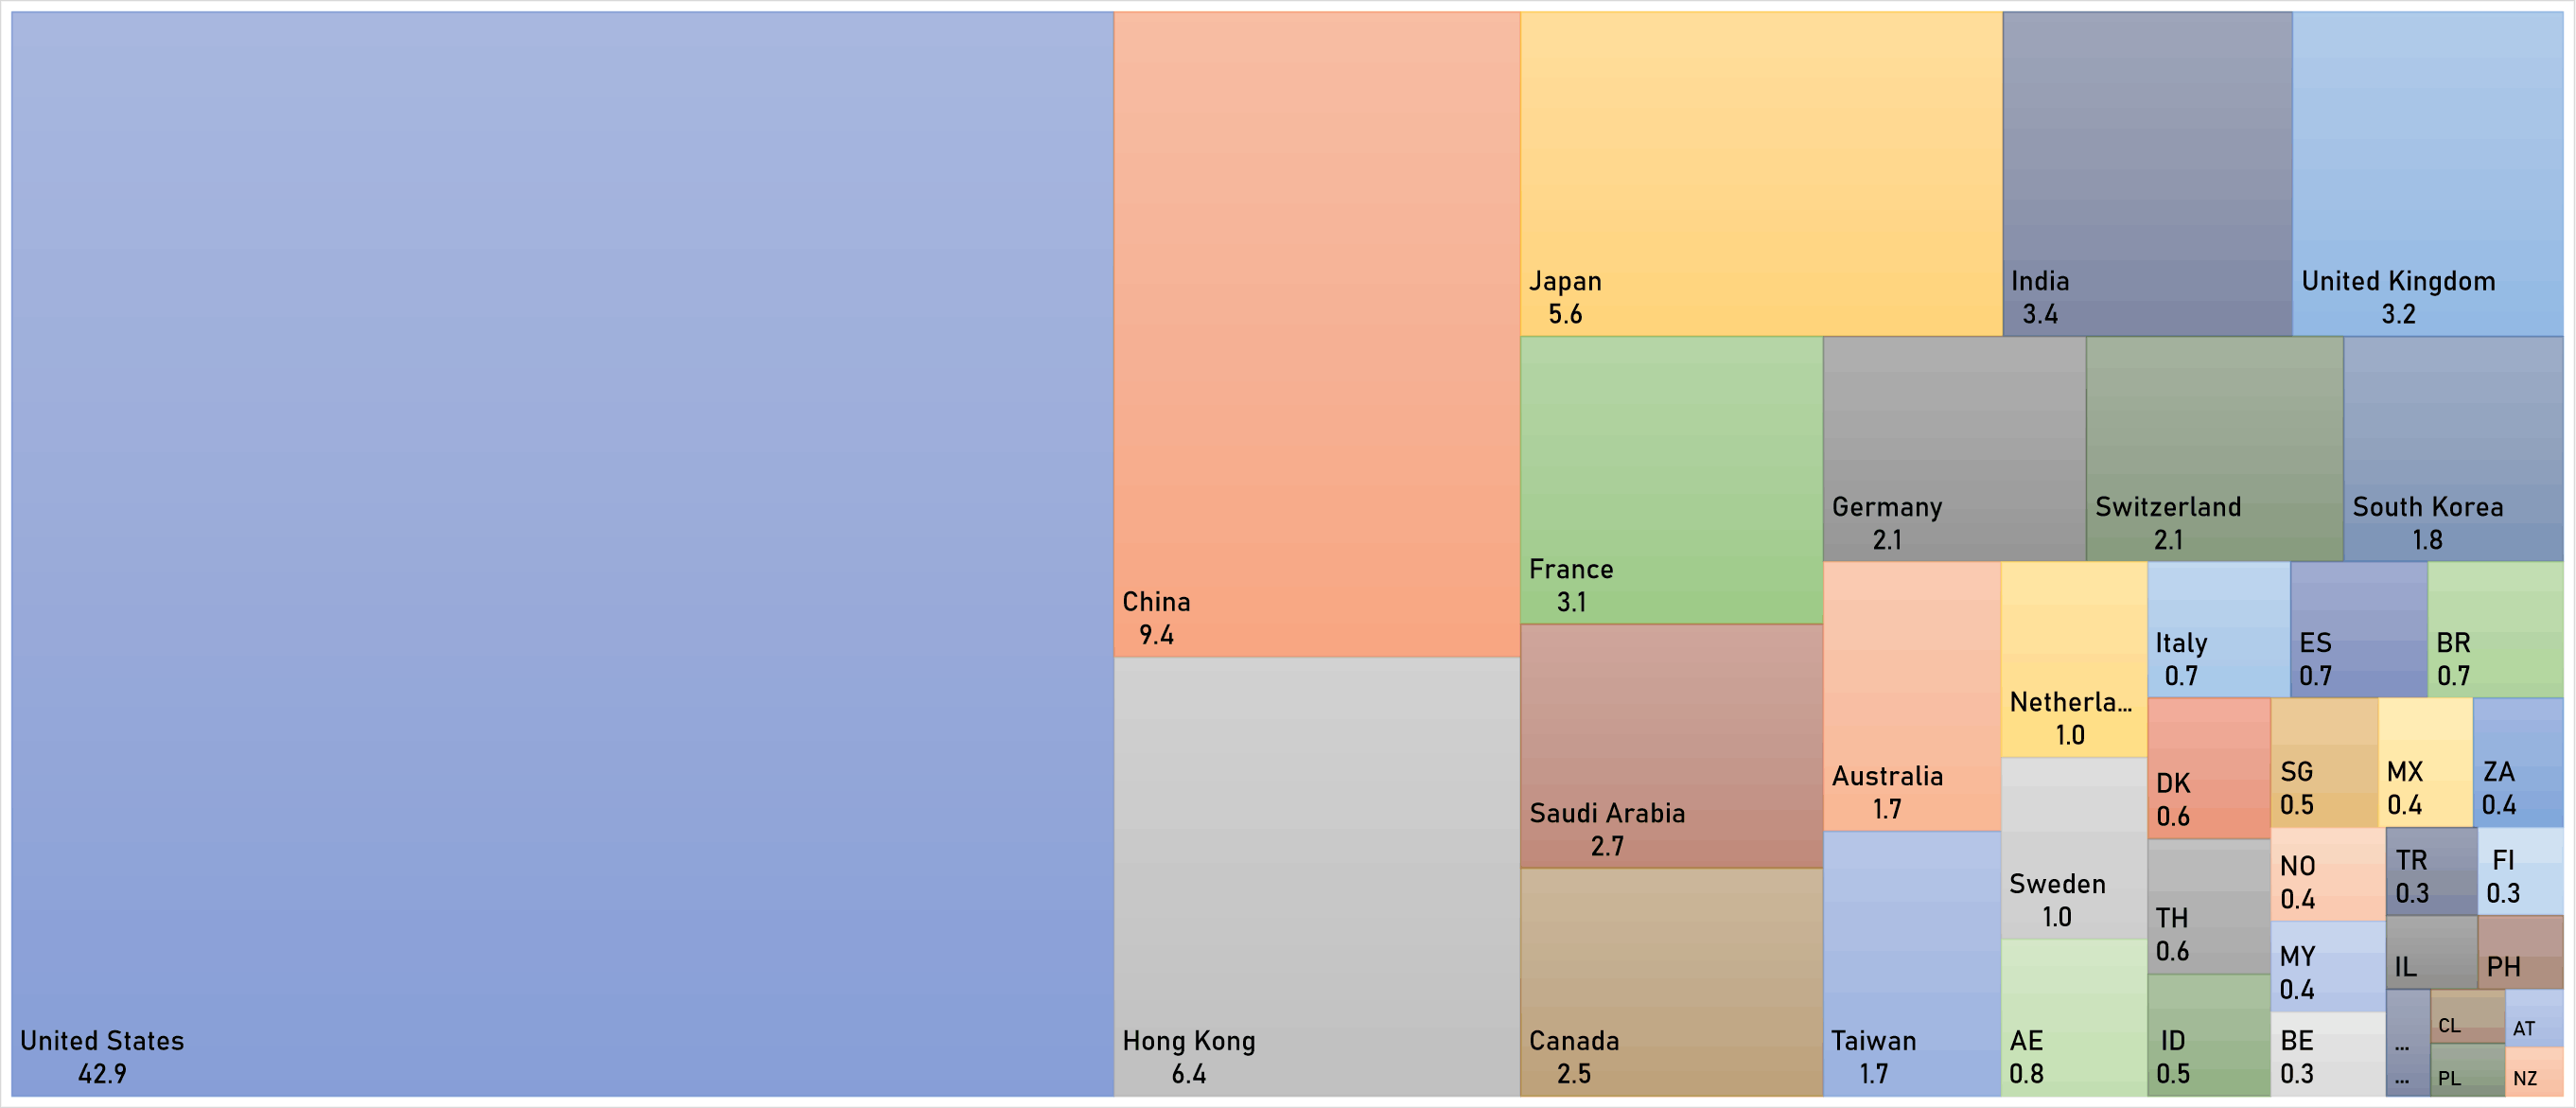
WORLD MARKET CAPITALIZATION (US$ Trillion)