Equities
Strong NFP Surprise Takes Equities For A Slide Into The Weekend; S&P 500 Still Up 8% YTD
Global equities are off to a spectacular start this year, underpinned by a broadly positive growth outlook and fueled by short covering; estimates of speculative net exposure remain low, meaning that the rally could go on for a while
Published ET
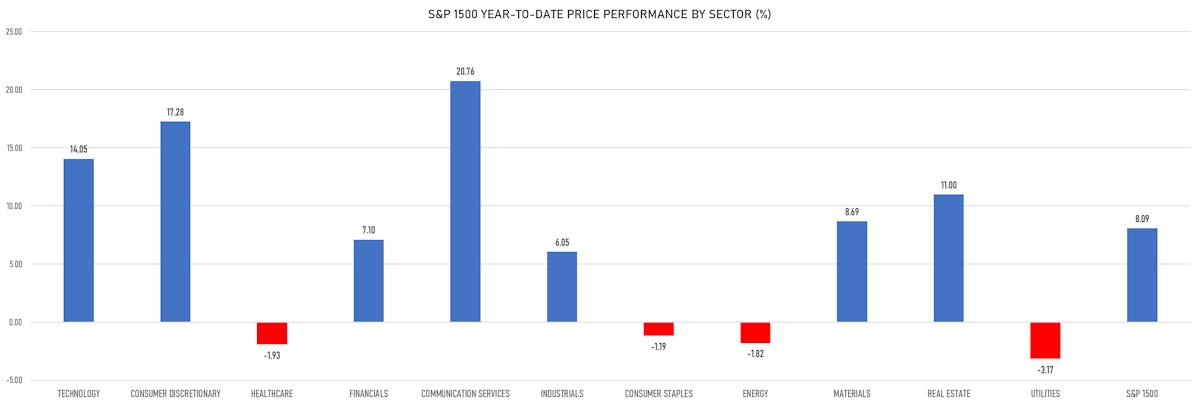
S&P 1500 Price Performance By Sector YTD | Sources: phipost.com, Refinitiv data
DAILY SUMMARY
- Daily performance of US indices: S&P 500 down -1.04%; Nasdaq Composite down -1.59%; Wilshire 5000 down -0.91%
- 21.5% of S&P 500 stocks were up today, with 71.2% of stocks above their 200-day moving average (DMA) and 69.0% above their 50-DMA
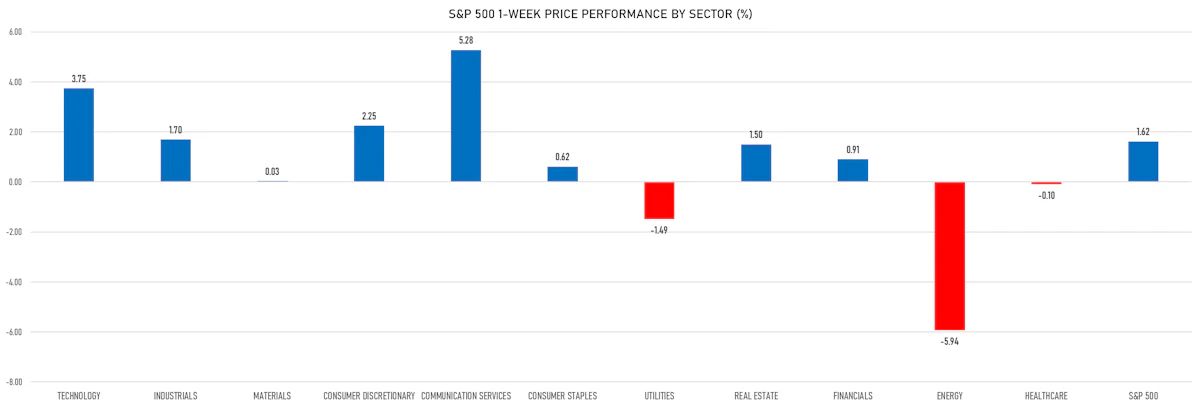
- Top performing sectors in the S&P 500: financials down -0.10% and energy down -0.23%
- Bottom performing sectors in the S&P 500: consumer discretionary down -3.11% and communication services down -2.22%
- The number of shares in the S&P 500 traded today was 736m for a total turnover of US$ 77 bn
- The S&P 500 Value Index was down -1.4%, while the S&P 500 Growth Index was down -0.7%; the S&P small caps index was down -0.6% and mid caps were down -0.9%
- The volume on CME's INX (S&P 500 Index) was 2,900.0m (3-month z-score: 0.8); the 3-month average volume is 2446.9m and the 12-month range is 903.0 - 5,089.5m
- Daily performance of international indices: Europe Stoxx 600 up 0.34%; UK FTSE 100 up 1.04%; Hang Seng SH-SZ-HK 300 Index down -0.91%; Japan's TOPIX 500 up 0.34%
VOLATILITY TODAY
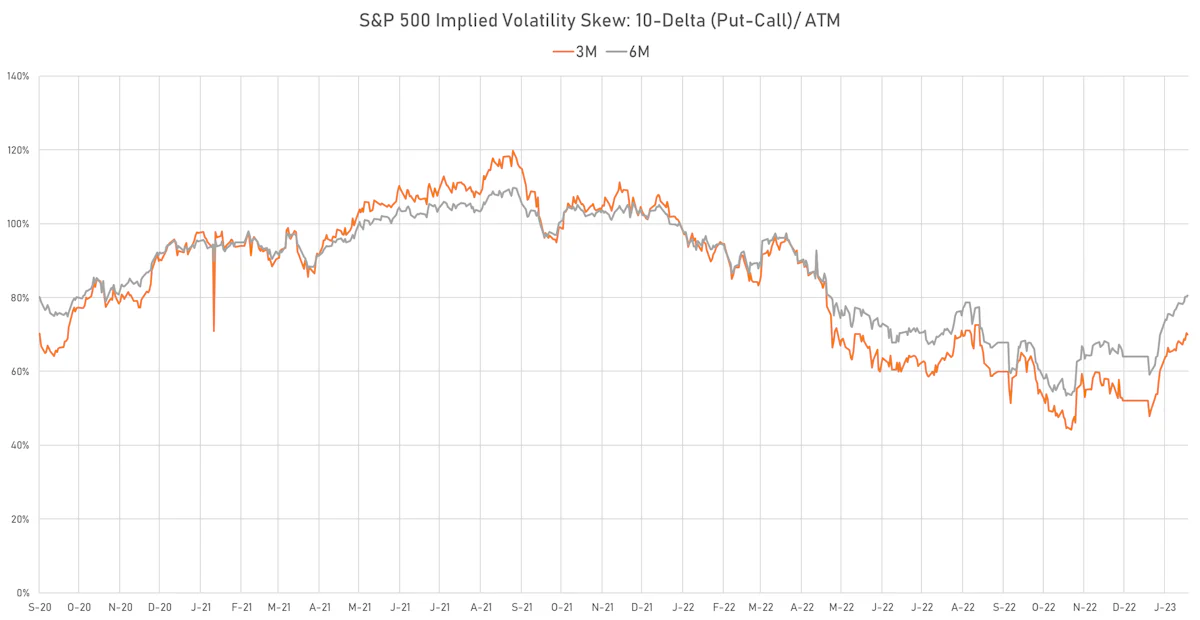
- 3-month at-the-money implied volatility on the S&P 500 at 16.5%, down from 16.8%
- 3-month at-the-money implied volatility on the STOXX Europe 600 at 13.0%, up from 12.9%
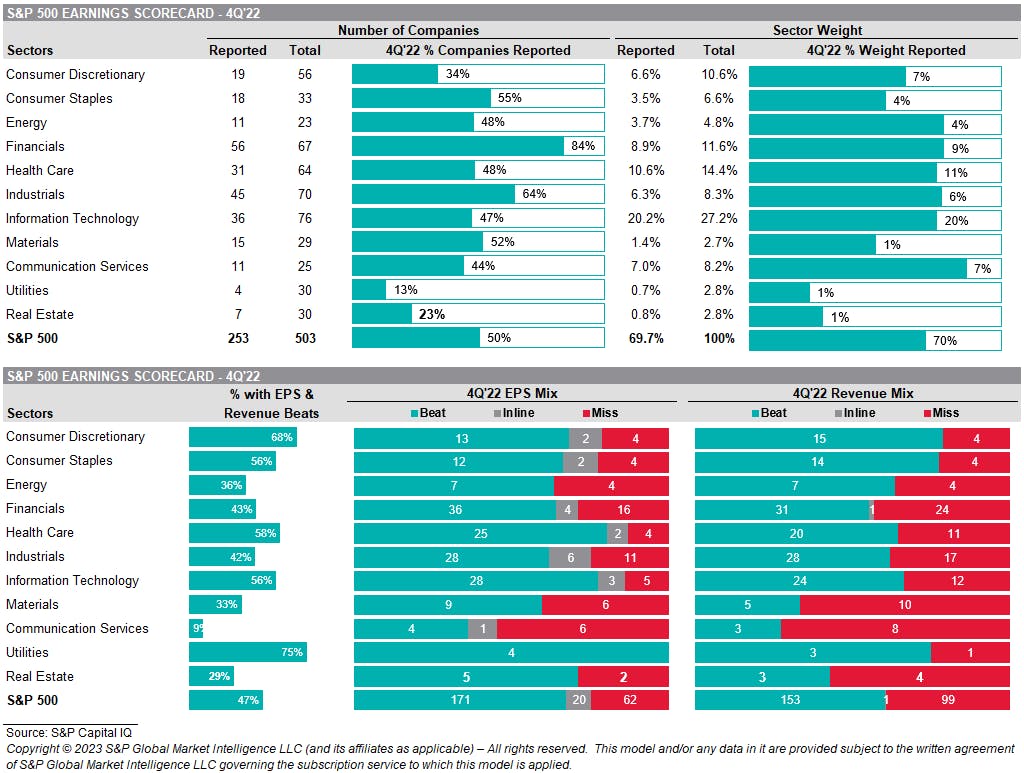
4Q22 EARNINGS DASHBOARD
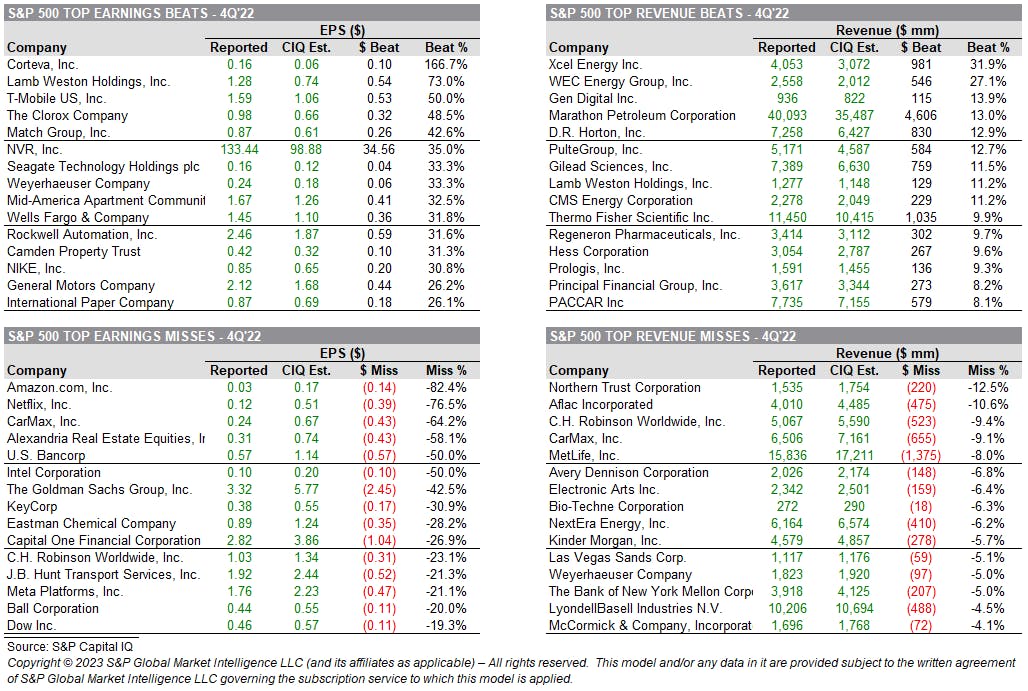
4Q22 EARNINGS: TOP BEATS & MISSES
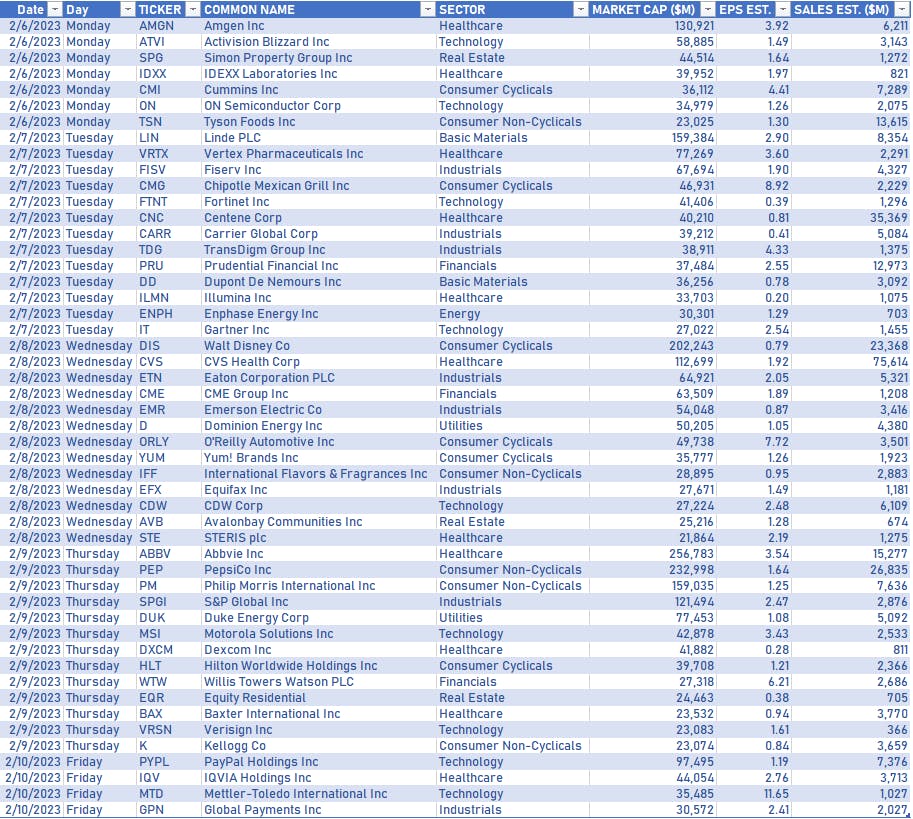
US EARNINGS IN THE WEEK AHEAD
NOTABLE US EARNINGS RELEASES TODAY
- Cigna Corp (CI | Healthcare): beat EPS median estimate (4.96 act. vs. 4.85 est.) and beat revenue median estimate (45,743m act. vs. 45,724m est.), down -2.96% today, closed at $ 292.59 / share and traded at $ 291.50 (-0.37%) after hours
- Regeneron Pharmaceuticals Inc (REGN | Healthcare): beat EPS median estimate (12.56 act. vs. 10.54 est.) and beat revenue median estimate (3,414m act. vs. 3,136m est.), up 4.25% today, closed at $ 783.13 / share and traded at $ 784.15 (+0.13%) after hours
- Zimmer Biomet Holdings Inc (ZBH | Healthcare): beat EPS median estimate (1.88 act. vs. 1.83 est.) and beat revenue median estimate (1,825m act. vs. 1,759m est.), up 1.60% today, closed at $ 129.45 / share and traded at $ 128.79 (-0.51%) after hours
- Church & Dwight Co Inc (CHD | Consumer Non-Cyclicals): beat EPS median estimate (0.62 act. vs. 0.60 est.) and beat revenue median estimate (1,436m act. vs. 1,399m est.), up 3.87% today, closed at $ 82.90 / share and traded at $ 83.15 (+0.30%) after hours
- Avantor Inc (AVTR | Healthcare): beat EPS median estimate (0.32 act. vs. 0.30 est.) and beat revenue median estimate (1,795m act. vs. 1,793m est.), down -7.36% today, closed at $ 23.05 / share and traded at $ 23.06 (+0.04%) after hours
- Cboe Global Markets Inc (CBOE | Financials): beat EPS median estimate (1.80 act. vs. 1.76 est.) and missed revenue median estimate (457m act. vs. 457m est.), up 2.85% today, closed at $ 124.26 / share and traded at $ 124.42 (+0.13%) after hours
- Saia Inc (SAIA | Industrials): missed EPS median estimate (2.65 act. vs. 2.83 est.) and beat revenue median estimate (656m act. vs. 653m est.), down -0.43% today, closed at $ 286.36 / share and traded at $ 286.36 (unchanged) after hours
- Brookfield Renewable Corp (BEPC | Utilities): missed EPS median estimate (-0.15 act. vs. -0.15 est.) and missed revenue median estimate (956m act. vs. 1,214m est.), down -3.45% today, closed at $ 30.19 / share and traded at $ 30.07 (-0.40%) after hours
TOP WINNERS TODAY
- BigBear.ai Holdings Inc (BBAI), up 44.2% to $5.19 / YTD price return: +670.4% / 12-Month Price Range: $ 0.58-16.12 / Short interest (% of float): 15.7%; days to cover: 0.1
- SoundHound AI Inc (SOUN), up 43.9% to $2.82 / YTD price return: +59.3% / 12-Month Price Range: $ 0.93-18.14 / Short interest (% of float): 4.2%; days to cover: 4.3
- 2U Inc (TWOU), up 29.7% to $12.81 / YTD price return: +104.3% / 12-Month Price Range: $ 4.70-18.24 / Short interest (% of float): 8.7%; days to cover: 9.9
- Nordstrom Inc (JWN), up 24.8% to $26.38 / YTD price return: +63.4% / 12-Month Price Range: $ 15.53-29.59
- Bright Scholar Education Holdings Ltd (BEDU), up 21.0% to $3.40 / YTD price return: +40.8% / 12-Month Price Range: $ 2.04-4.80 / Short interest (% of float): 0.1%; days to cover: 2.1
- C3.ai Inc (AI), up 18.1% to $25.88 / YTD price return: +131.3% / 12-Month Price Range: $ 10.16-27.62 / Short interest (% of float): 9.1%; days to cover: 3.9
- Doma Holdings Inc (DOMA), up 17.5% to $0.88 / YTD price return: +94.5% / 12-Month Price Range: $ 0.34-3.89 / Short interest (% of float): 4.1%; days to cover: 9.6
- Nutex Health Inc (NUTX), up 16.3% to $1.50 / YTD price return: -21.1% / 12-Month Price Range: $ 0.50-52.80 / Short interest (% of float): 2.2%; days to cover: 2.8
- Monte Rosa Therapeutics Inc (GLUE), up 15.1% to $8.21 / YTD price return: +7.9% / 12-Month Price Range: $ 6.05-15.54 / Short interest (% of float): 7.8%; days to cover: 24.5
- Getty Images Holdings Inc (GETY), up 13.9% to $7.03 / YTD price return: +26.7% / 12-Month Price Range: $ 4.51-37.88 / Short interest (% of float): 0.3%; days to cover: 3.8
BIGGEST LOSERS TODAY
- Bill.com Holdings Inc (BILL), down 26.7% to $94.51 / YTD price return: -13.3% / 12-Month Price Range: $ 89.87-262.17 / Short interest (% of float): 9.1%; days to cover: 5.3 (the stock is currently on the short sale restriction list)
- Summit Therapeutics Inc (SMMT), down 19.1% to $3.14 / YTD price return: -26.1% / 12-Month Price Range: $ .66-5.78 / Short interest (% of float): 11.3%; days to cover: 0.2 (the stock is currently on the short sale restriction list)
- Twist Bioscience Corp (TWST), down 18.1% to $25.31 / YTD price return: +6.3% / 12-Month Price Range: $ 21.78-66.15 / Short interest (% of float): 16.2%; days to cover: 9.1 (the stock is currently on the short sale restriction list)
- C4 Therapeutics Inc (CCCC), down 15.4% to $6.91 / YTD price return: +17.1% / 12-Month Price Range: $ 4.84-26.80 / Short interest (% of float): 8.4%; days to cover: 7.7 (the stock is currently on the short sale restriction list)
- SkyWest Inc (SKYW), down 15.3% to $18.53 / YTD price return: +12.2% / 12-Month Price Range: $ 14.76-39.16 (the stock is currently on the short sale restriction list)
- GrafTech International Ltd (EAF), down 15.3% to $5.58 / YTD price return: +17.2% / 12-Month Price Range: $ 4.07-12.03 / Short interest (% of float): 2.1%; days to cover: 3.7 (the stock is currently on the short sale restriction list)
- ZeroFox Holdings Inc (ZFOX), down 14.8% to $3.28 / YTD price return: -34.1% / 12-Month Price Range: $ 3.26-15.73 / Short interest (% of float): 0.3%; days to cover: 4.2 (the stock is currently on the short sale restriction list)
- 1-800-Flowers.Com Inc (FLWS), down 14.4% to $11.24 / YTD price return: +17.5% / 12-Month Price Range: $ 5.82-16.65 / Short interest (% of float): 4.9%; days to cover: 2.3 (the stock is currently on the short sale restriction list)
- Affirm Holdings Inc (AFRM), down 14.1% to $18.15 / YTD price return: +87.7% / 12-Month Price Range: $ 8.62-83.57 (the stock is currently on the short sale restriction list)
- Minerals Technologies Inc (MTX), down 13.1% to $63.15 / YTD price return: +4.0% / 12-Month Price Range: $ 49.38-73.57 (the stock is currently on the short sale restriction list)
TOP S&P 500 PERFORMERS THIS WEEK
- Align Technology Inc (ALGN), up 27.5% to $343.10 / YTD price return: +62.7% / 12-Month Price Range: $ 172.29-551.82 / Short interest (% of float): 3.1%; days to cover: 2.4
- Meta Platforms Inc (META), up 22.9% to $186.53 / YTD price return: +55.0% / 12-Month Price Range: $ 88.10-248.00 / Short interest (% of float): 1.3%; days to cover: 1.0
- WW Grainger Inc (GWW), up 18.2% to $675.81 / YTD price return: +21.5% / 12-Month Price Range: $ 440.56-676.06 / Short interest (% of float): 2.8%; days to cover: 4.5
- Pentair PLC (PNR), up 15.2% to $59.37 / YTD price return: +32.0% / 12-Month Price Range: $ 38.55-62.60 / Short interest (% of float): 4.4%; days to cover: 5.5
- A O Smith Corp (AOS), up 14.4% to $69.05 / YTD price return: +20.6% / 12-Month Price Range: $ 46.59-75.52 / Short interest (% of float): 5.2%; days to cover: 6.2
- Advanced Micro Devices Inc (AMD), up 14.2% to $86.09 / YTD price return: +32.9% / 12-Month Price Range: $ 54.58-132.96 / Short interest (% of float): 1.9%; days to cover: 0.6
- Carmax Inc (KMX), up 13.2% to $78.19 / YTD price return: +28.4% / 12-Month Price Range: $ 52.87-114.36 / Short interest (% of float): 13.9%; days to cover: 6.5
- FedEx Corp (FDX), up 12.7% to $214.67 / YTD price return: +23.9% / 12-Month Price Range: $ 141.95-251.32 / Short interest (% of float): 2.0%; days to cover: 1.9
- Pultegroup Inc (PHM), up 11.7% to $58.80 / YTD price return: +29.1% / 12-Month Price Range: $ 35.04-60.88 / Short interest (% of float): 3.7%; days to cover: 4.4
- Stryker Corp (SYK), up 11.4% to $283.14 / YTD price return: +15.8% / 12-Month Price Range: $ 188.89-283.14 / Short interest (% of float): 1.5%; days to cover: 4.2
BOTTOM S&P 500 PERFORMERS THIS WEEK
- Conocophillips (COP), down 12.5% to $108.11 / YTD price return: -8.4% / 12-Month Price Range: $ 78.32-138.45 / Short interest (% of float): 0.8%; days to cover: 1.8
- Hess Corp (HES), down 12.0% to $137.57 / YTD price return: -3.0% / 12-Month Price Range: $ 89.29-160.52 / Short interest (% of float): 2.0%; days to cover: 3.6
- Electronic Arts Inc (EA), down 11.6% to $113.92 / YTD price return: -6.8% / 12-Month Price Range: $ 109.28-142.78 / Short interest (% of float): 1.6%; days to cover: 2.6
- Marathon Petroleum Corp (MPC), down 11.0% to $118.20 / YTD price return: +1.6% / 12-Month Price Range: $ 72.78-136.41 / Short interest (% of float): 2.7%; days to cover: 3.1
- Match Group Inc (MTCH), down 9.7% to $48.45 / YTD price return: +16.8% / 12-Month Price Range: $ 38.65-118.95 / Short interest (% of float): 3.3%; days to cover: 2.0
- Air Products and Chemicals Inc (APD), down 9.3% to $285.02 / YTD price return: -7.5% / 12-Month Price Range: $ 216.24-328.37 / Short interest (% of float): 0.9%; days to cover: 2.0
- Phillips 66 (PSX), down 9.1% to $98.81 / YTD price return: -5.1% / 12-Month Price Range: $ 73.85-113.52 / Short interest (% of float): 2.1%; days to cover: 3.3
- Moderna Inc (MRNA), down 8.5% to $173.25 / YTD price return: -3.5% / 12-Month Price Range: $ 115.06-217.20 / Short interest (% of float): 4.0%; days to cover: 2.3
- Diamondback Energy Inc (FANG), down 8.3% to $138.40 / YTD price return: +1.2% / 12-Month Price Range: $ 101.92-168.95 / Short interest (% of float): 3.7%; days to cover: 2.4
- Westrock Co (WRK), down 8.2% to $34.89 / YTD price return: -.8% / 12-Month Price Range: $ 30.10-54.78 / Short interest (% of float): 1.2%; days to cover: 1.8
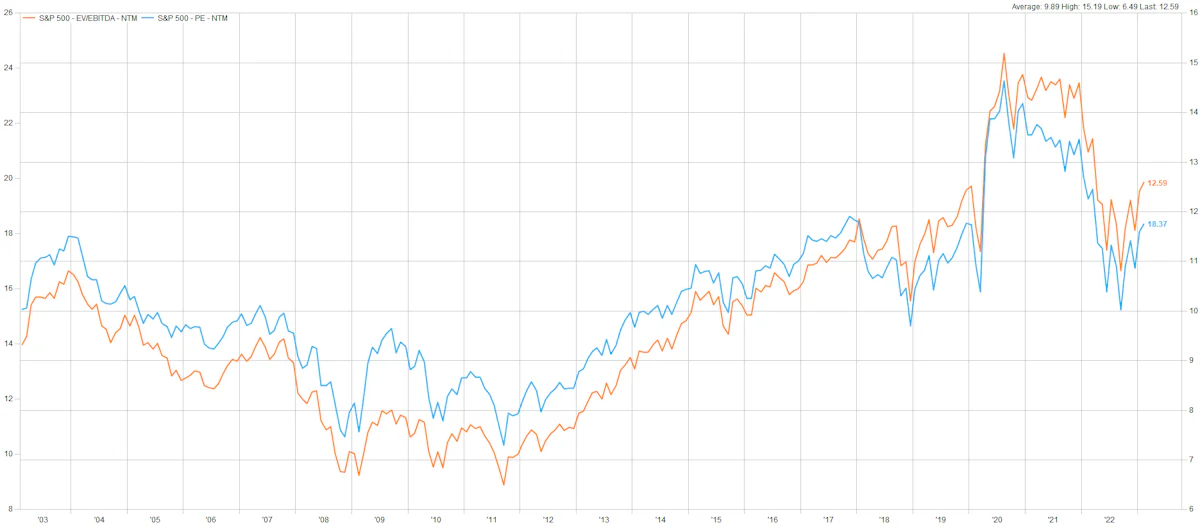
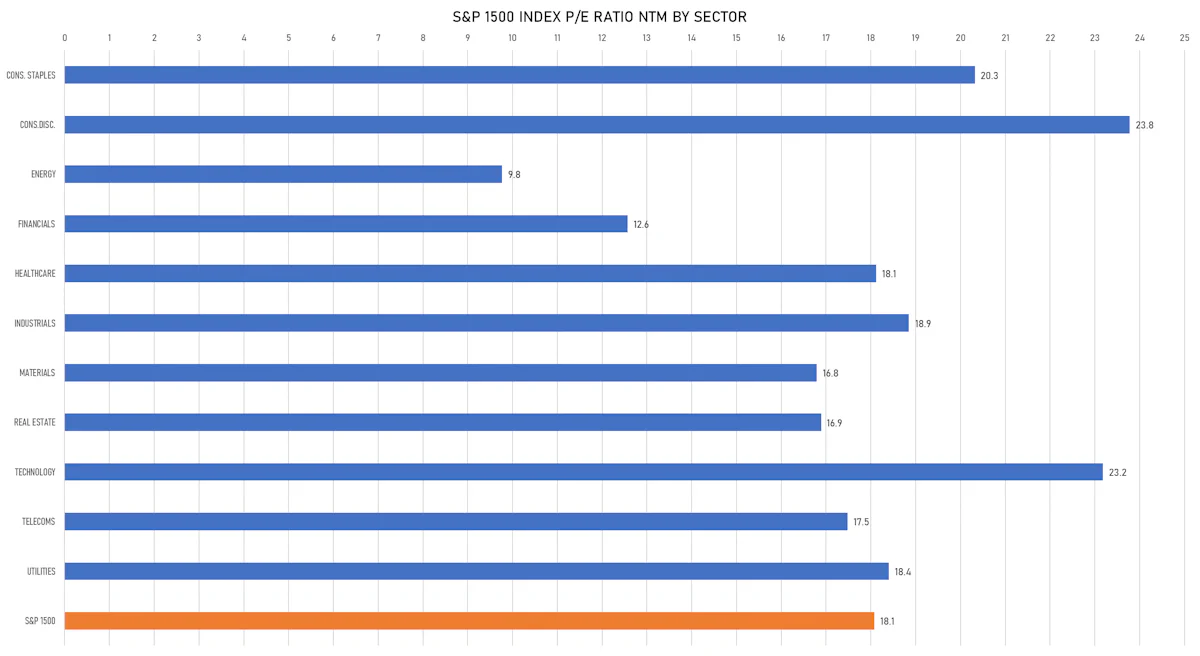
VALUATION MULTIPLES BY SECTORS
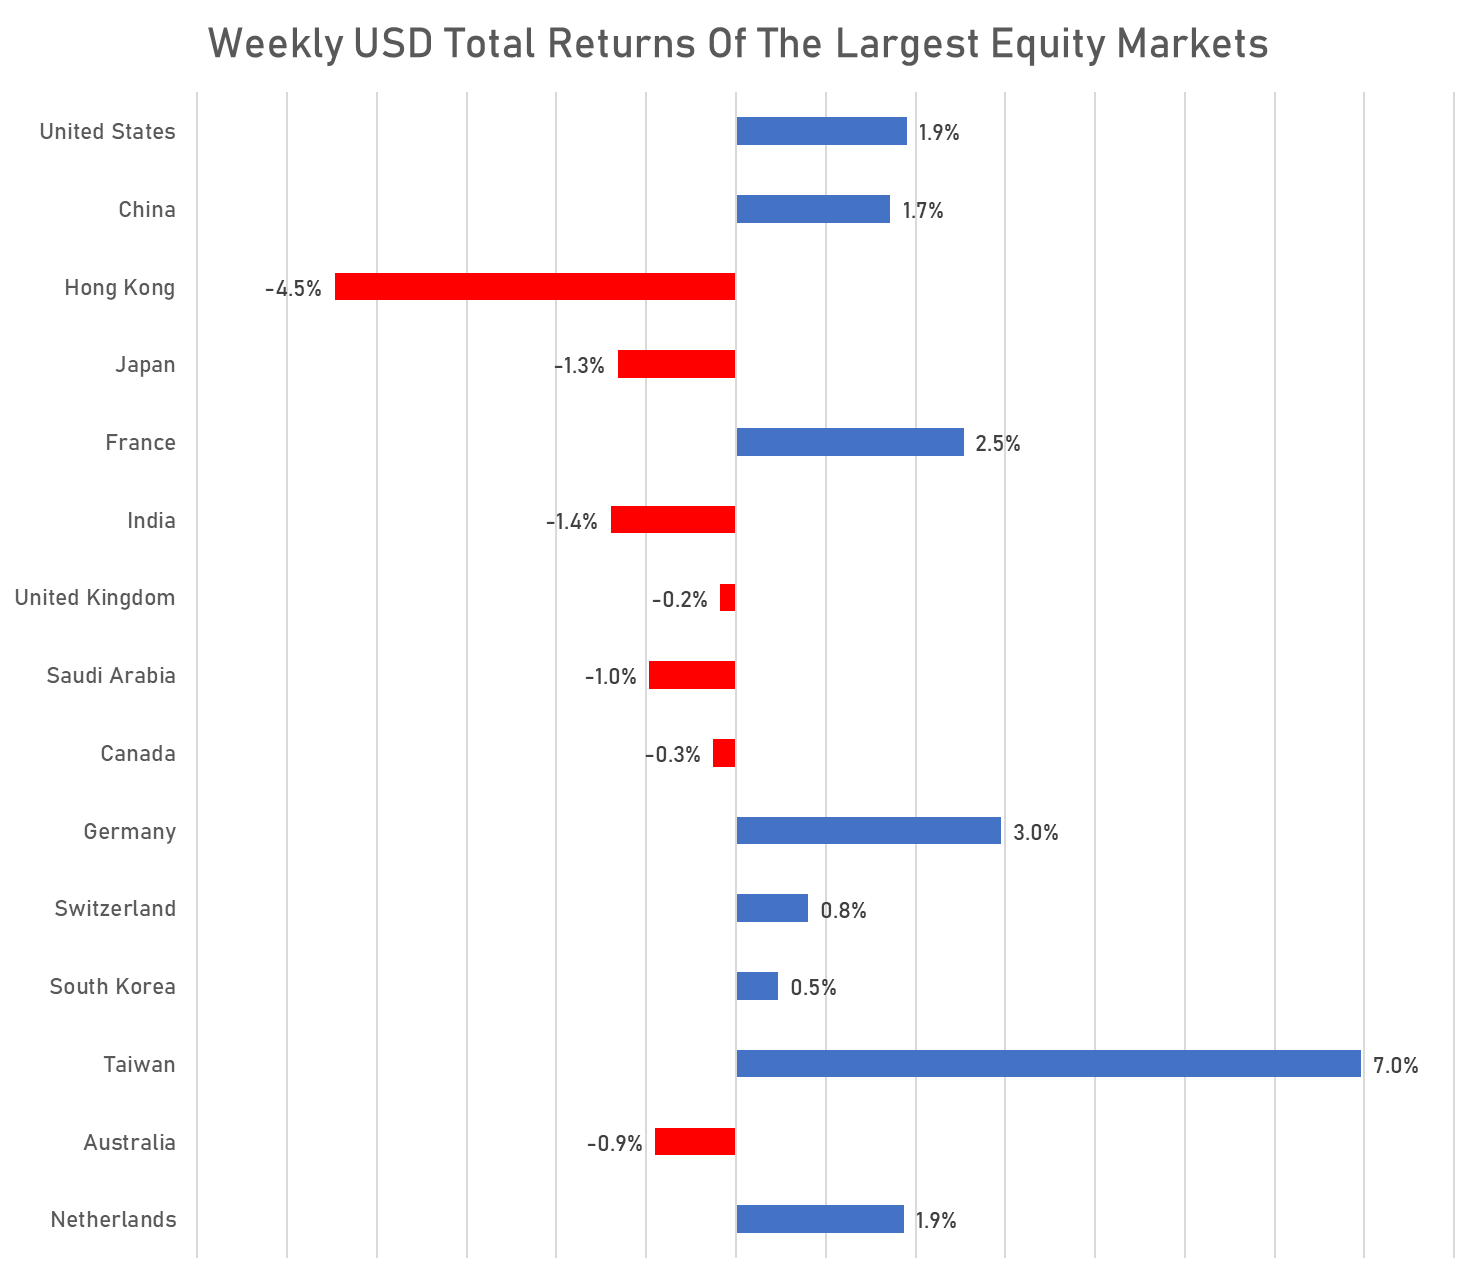
WEEKLY TOTAL RETURNS OF MAJOR GLOBAL EQUITY MARKETS
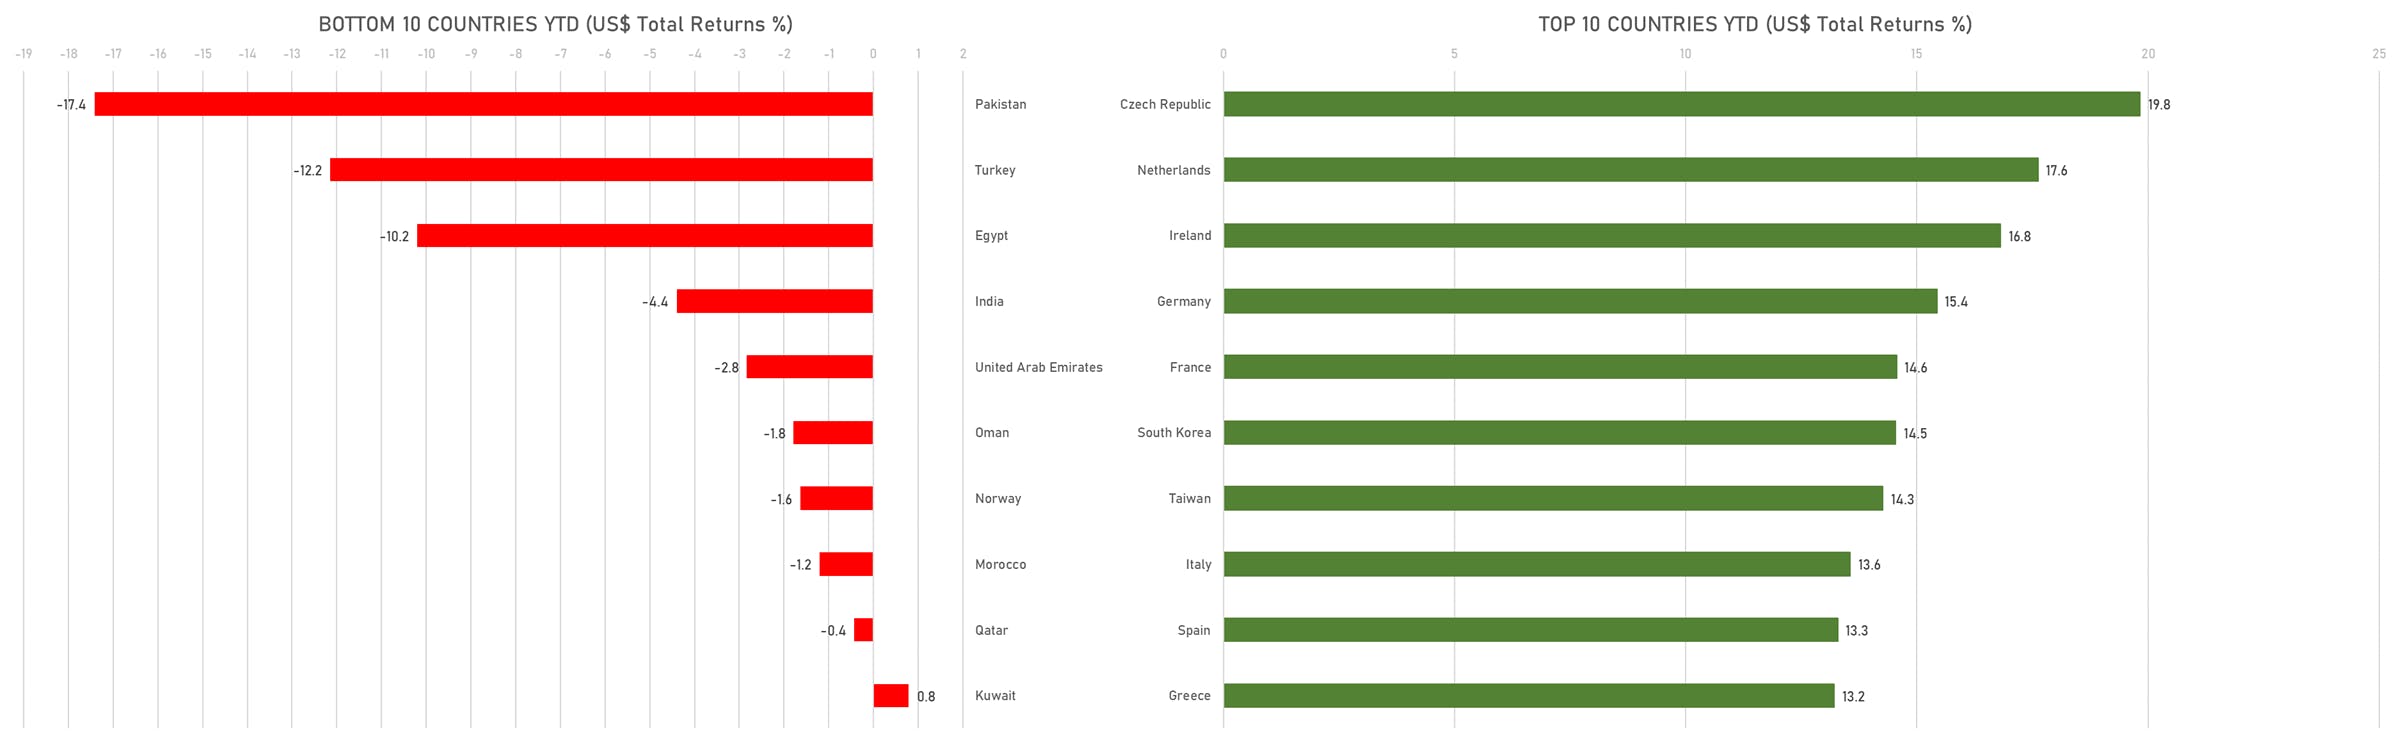
TOP / BOTTOM PERFORMING WORLD MARKETS YTD
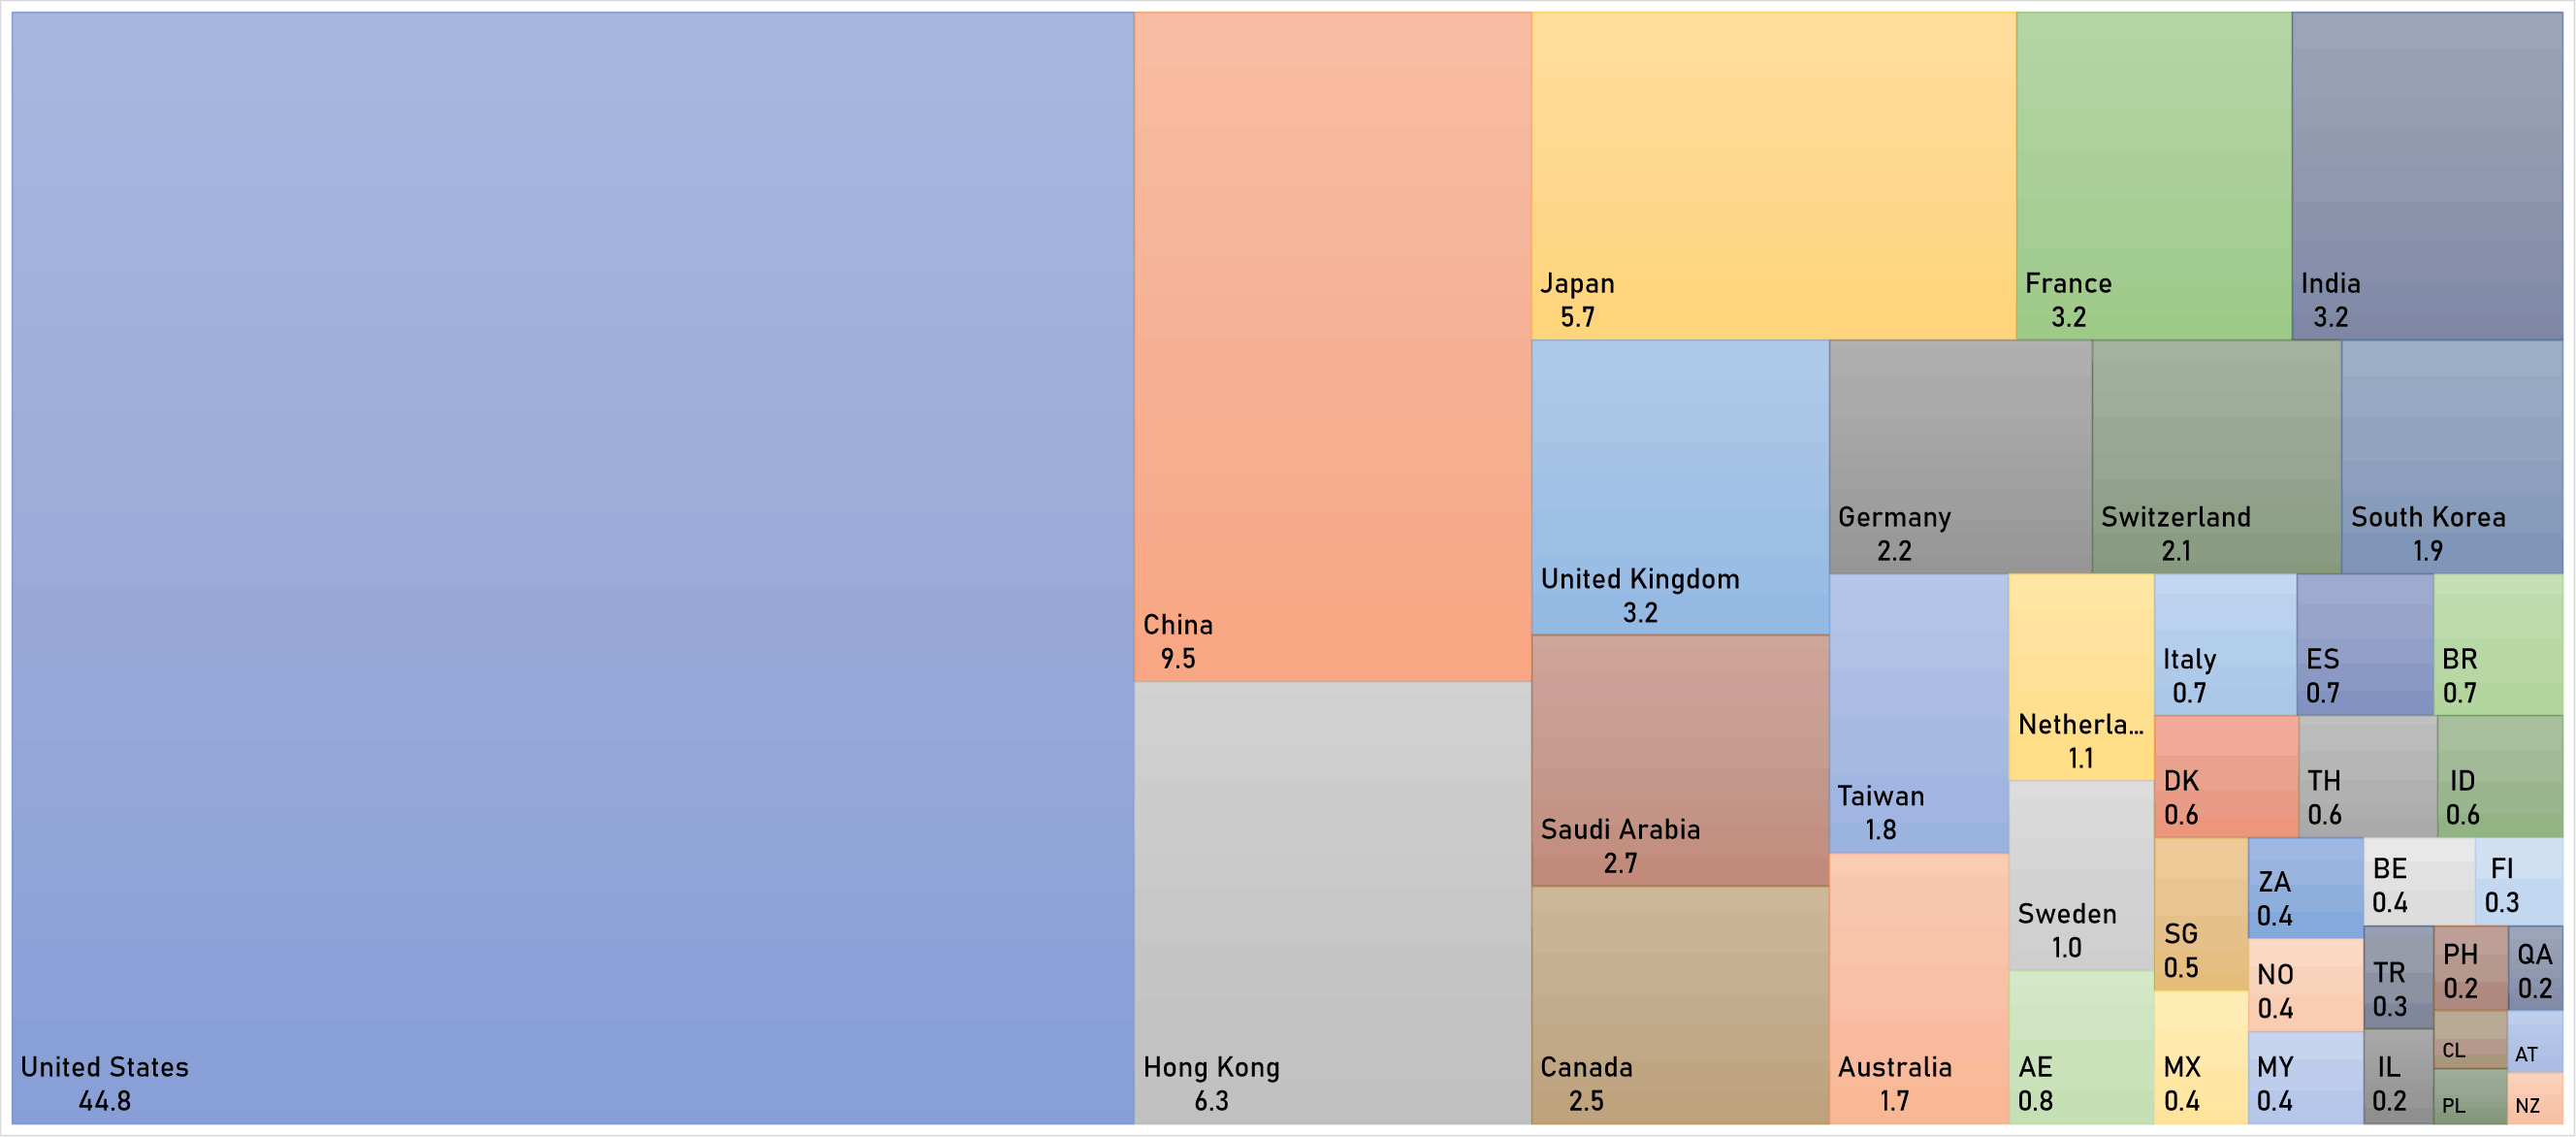
WORLD MARKET CAPITALIZATION (US$ Trillion)