Equities
Derisking Ahead Of Much-Awaited CPI Data After US Equities Start The Year Up 10%
Expectations for FY2023 S&P 500 EPS continue to come down: they were around $250 last year and the median estimate now stands at $227 according to S&P Capital IQ (the consensus still sees around 2.5% EPS growth YoY)
Published ET
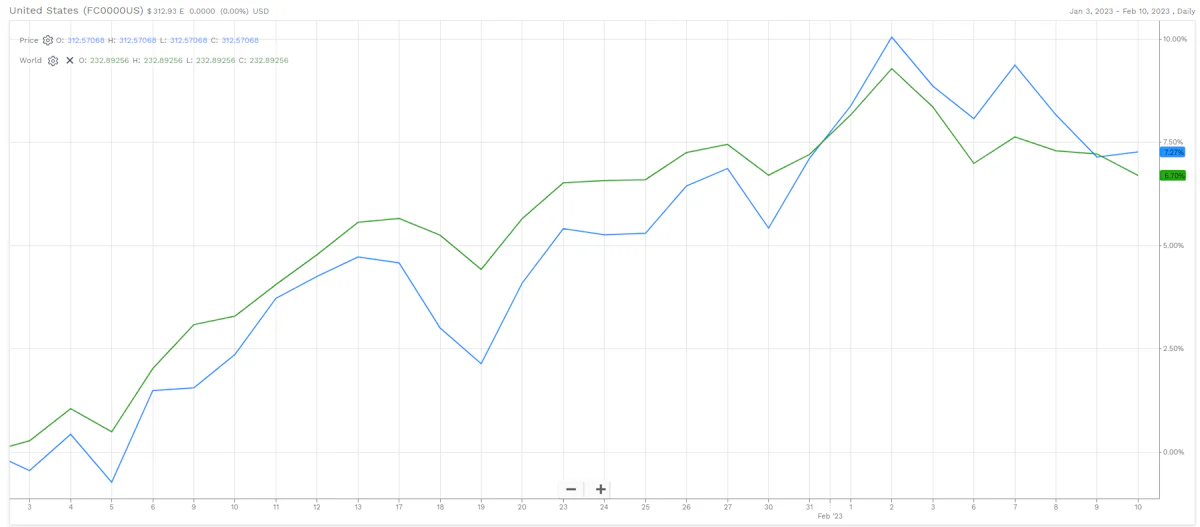
FactSet USA & World Total Returns Indices YTD Performance | Source: FactSet
DAILY SUMMARY
- Daily performance of US indices: S&P 500 up 0.22%; Nasdaq Composite down -0.61%; Wilshire 5000 down -0.31%
- 63.0% of S&P 500 stocks were up today, with 68.2% of stocks above their 200-day moving average (DMA) and 65.4% above their 50-DMA
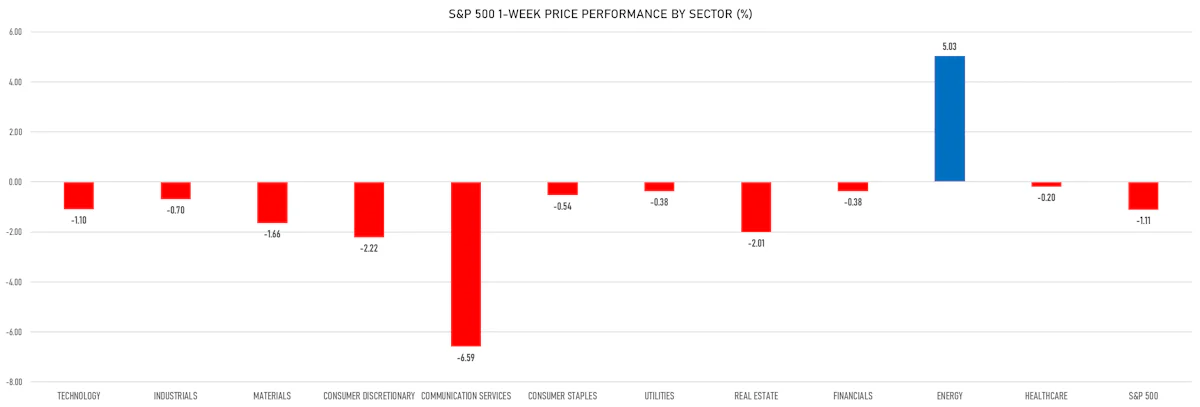
- Top performing sectors in the S&P 500: energy up 3.92% and utilities up 2.00%
- Bottom performing sectors in the S&P 500: consumer discretionary down -1.22% and communication services down -0.89%
- The number of shares in the S&P 500 traded today was 615m for a total turnover of US$ 63 bn
- The volume on CME's INX (S&P 500 Index) was 2312.2m (3-month z-score: -0.2); the 3-month average volume is 2420.8m and the 12-month range is 903.0 - 5089.5m
- Daily performance of international indices: Europe Stoxx 600 down -0.96%; UK FTSE 100 down -0.36%; Hang Seng SH-SZ-HK 300 Index down -1.34%; Japan's TOPIX 500 up 0.13%
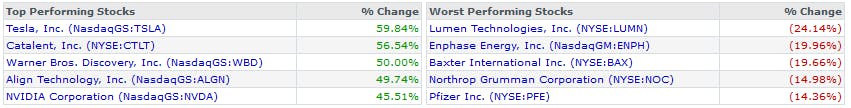
Top / Bottom S&P 500 Stocks YTD| Source: S&P Capital IQ
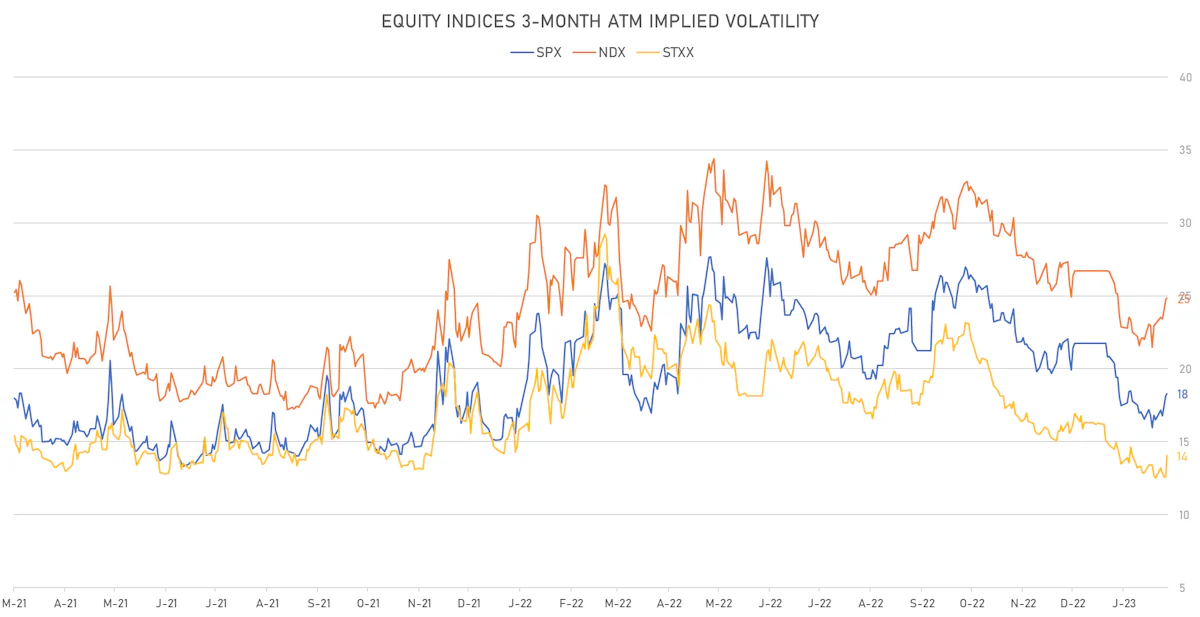
VOLATILITY TODAY
- 3-month at-the-money implied volatility on the S&P 500 at 18.3%, up from 18.2%
- 3-month at-the-money implied volatility on the STOXX Europe 600 at 14.4%, up from 12.9%
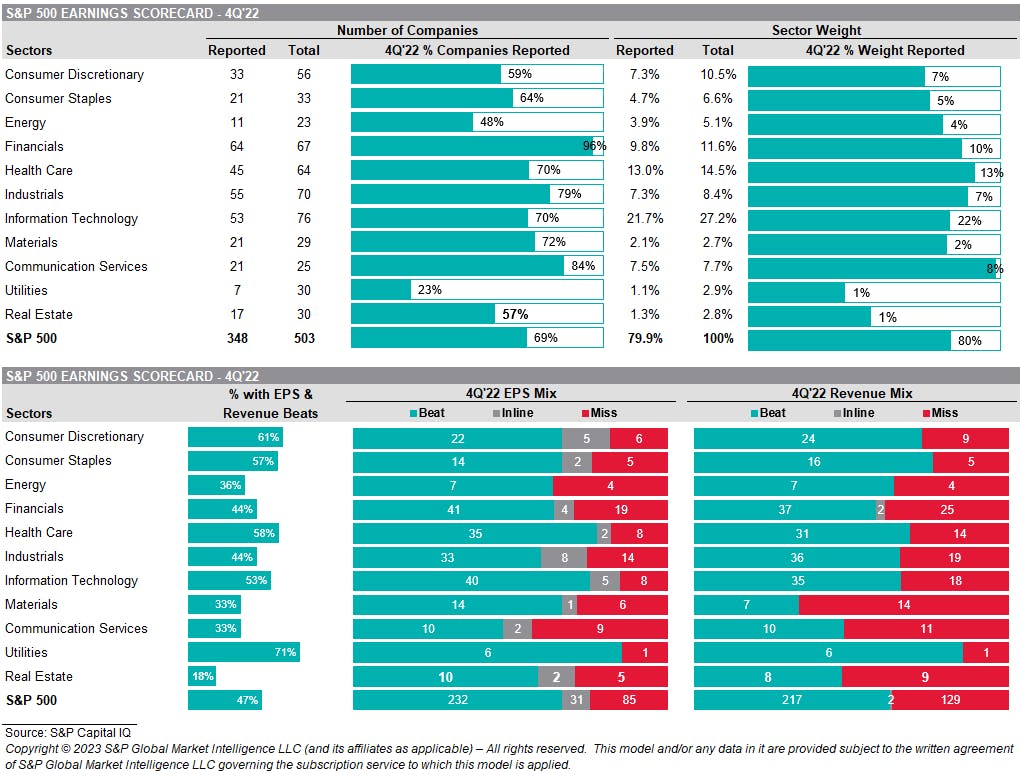
S&P 500 EARNINGS DASHBOARD
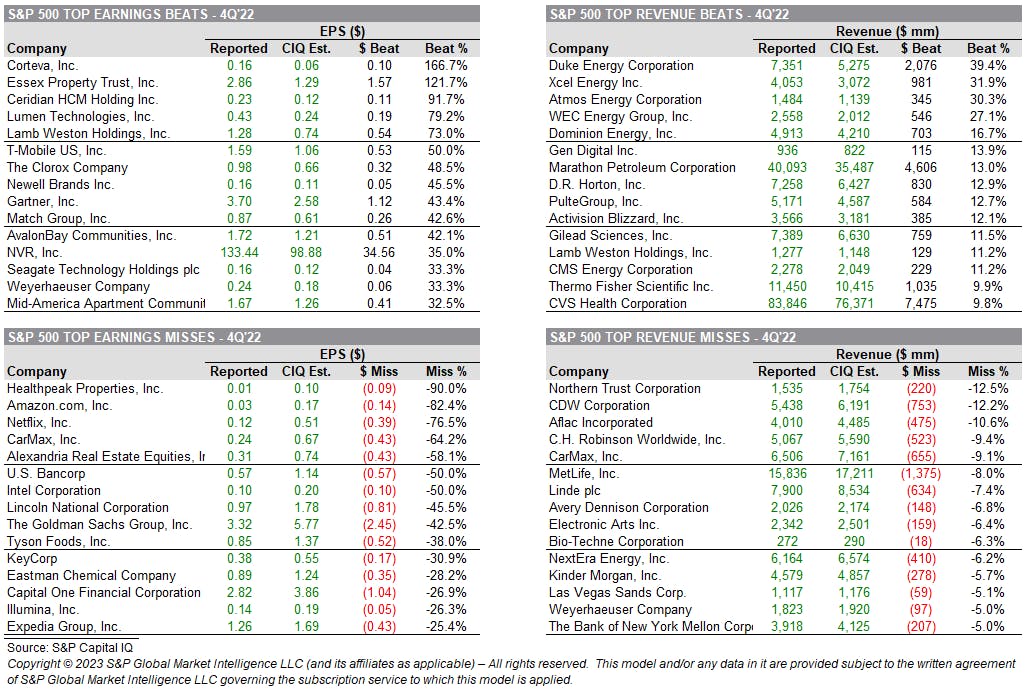
TOP EARNINGS BEATS & MISSES
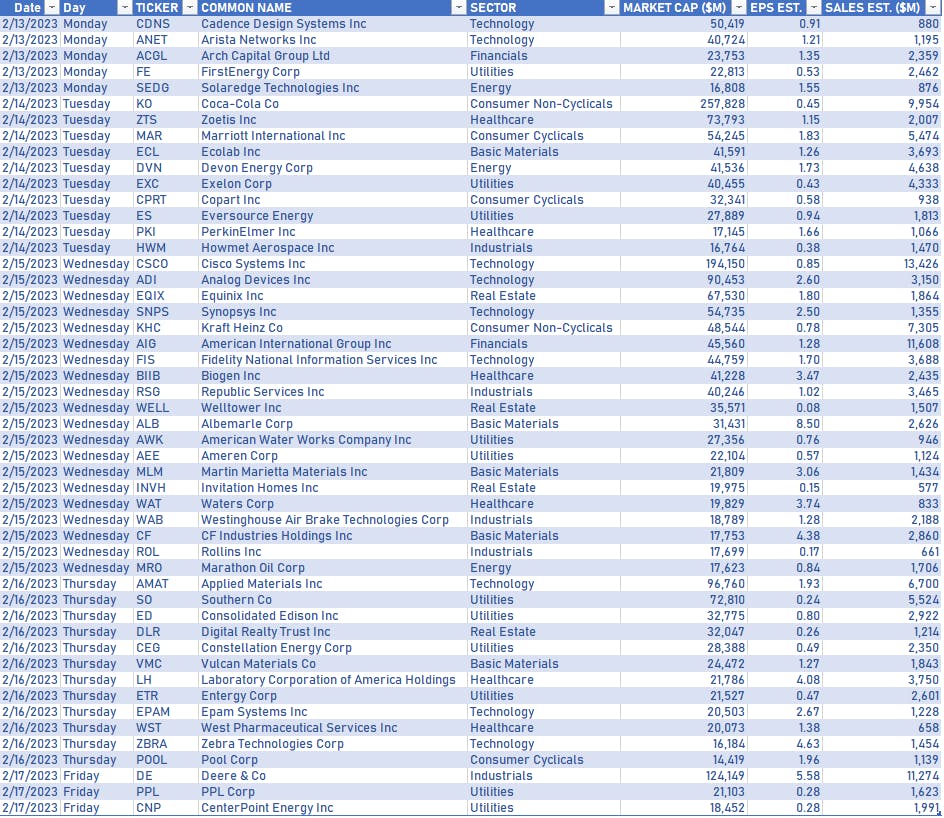
US EARNINGS IN THE WEEK AHEAD
FY 2023 S&P 500 EPS MEDIAN ESTIMATE
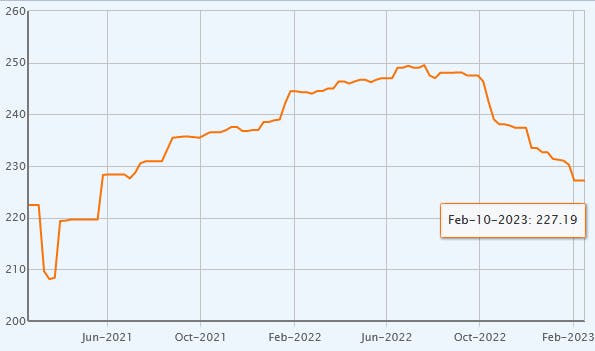
Source: S&P Capital IQ
TOP S&P 500 PERFORMERS THIS WEEK
- Catalent Inc (CTLT), up 25.7% to $70.46 / YTD price return: +56.5% / 12-Month Price Range: $ 40.70-115.26 / Short interest (% of float): 3.8%; days to cover: 2.7
- Fortinet Inc (FTNT), up 12.5% to $59.61 / YTD price return: +21.9% / 12-Month Price Range: $ 42.69-71.41 / Short interest (% of float): 2.1%; days to cover: 2.6
- Everest Re Group Ltd (RE), up 10.8% to $379.48 / YTD price return: +14.6% / 12-Month Price Range: $ 244.68-392.75 / Short interest (% of float): 0.9%; days to cover: 1.3
- Cincinnati Financial Corp (CINF), up 8.7% to $125.17 / YTD price return: +22.2% / 12-Month Price Range: $ 88.67-143.22 / Short interest (% of float): 2.4%; days to cover: 6.6
- Dexcom Inc (DXCM), up 8.7% to $117.89 / YTD price return: +4.1% / 12-Month Price Range: $ 66.94-134.50 / Short interest (% of float): 2.9%; days to cover: 4.7
- Phillips 66 (PSX), up 8.7% to $107.38 / YTD price return: +3.2% / 12-Month Price Range: $ 73.85-113.52 / Short interest (% of float): 2.0%; days to cover: 3.1
- Fiserv Inc (FISV), up 8.5% to $115.64 / YTD price return: +14.4% / 12-Month Price Range: $ 87.04-117.43 / Short interest (% of float): 0.9%; days to cover: 2.0
- Diamondback Energy Inc (FANG), up 7.9% to $149.29 / YTD price return: +9.1% / 12-Month Price Range: $ 101.92-168.95 / Short interest (% of float): 2.6%; days to cover: 2.0
- Monolithic Power Systems Inc (MPWR), up 7.8% to $492.02 / YTD price return: +39.1% / 12-Month Price Range: $ 303.30-540.95 / Short interest (% of float): 6.2%; days to cover: 5.3
- EOG Resources Inc (EOG), up 7.6% to $134.14 / YTD price return: +3.6% / 12-Month Price Range: $ 90.02-149.10
BOTTOM S&P 500 PERFORMERS THIS WEEK
- Lumen Technologies Inc (LUMN), down 24.7% to $3.96 / YTD price return: -24.1% / 12-Month Price Range: $ 3.74-12.54 / Short interest (% of float): 13.9%; days to cover: 6.5
- International Flavors & Fragrances Inc (IFF), down 16.3% to $94.82 / YTD price return: -9.6% / 12-Month Price Range: $ 83.18-143.14 / Short interest (% of float): 1.5%; days to cover: 2.3 (the stock is currently on the short sale restriction list)
- VF Corp (VFC), down 14.2% to $26.27 / YTD price return: -4.9% / 12-Month Price Range: $ 25.06-64.30 / Short interest (% of float): 4.9%; days to cover: 3.2
- Baxter International Inc (BAX), down 12.3% to $40.95 / YTD price return: -19.7% / 12-Month Price Range: $ 38.59-89.22 (the stock is currently on the short sale restriction list)
- Paramount Global (PARA), down 12.2% to $21.59 / YTD price return: +27.9% / 12-Month Price Range: $ 15.29-39.21 / Short interest (% of float): 14.9%; days to cover: 7.7
- News Corp (NWS), down 12.1% to $18.81 / YTD price return: +2.0% / 12-Month Price Range: $ 15.16-24.00 / Short interest (% of float): 2.0%; days to cover: 2.8 (the stock is currently on the short sale restriction list)
- STERIS plc (STE), down 11.9% to $192.87 / YTD price return: +4.4% / 12-Month Price Range: $ 159.47-255.78 / Short interest (% of float): 2.5%; days to cover: 5.7 (the stock is currently on the short sale restriction list)
- News Corp (NWSA), down 11.9% to $18.66 / YTD price return: +2.5% / 12-Month Price Range: $ 14.88-23.69 / Short interest (% of float): 1.5%; days to cover: 2.4
- ETSY Inc (ETSY), down 10.4% to $132.13 / YTD price return: +10.3% / 12-Month Price Range: $ 67.06-163.84 / Short interest (% of float): 10.3%; days to cover: 4.8
- Sealed Air Corp (SEE), down 10.4% to $49.30 / YTD price return: -1.2% / 12-Month Price Range: $ 41.32-70.69 / Short interest (% of float): 1.9%; days to cover: 3.0
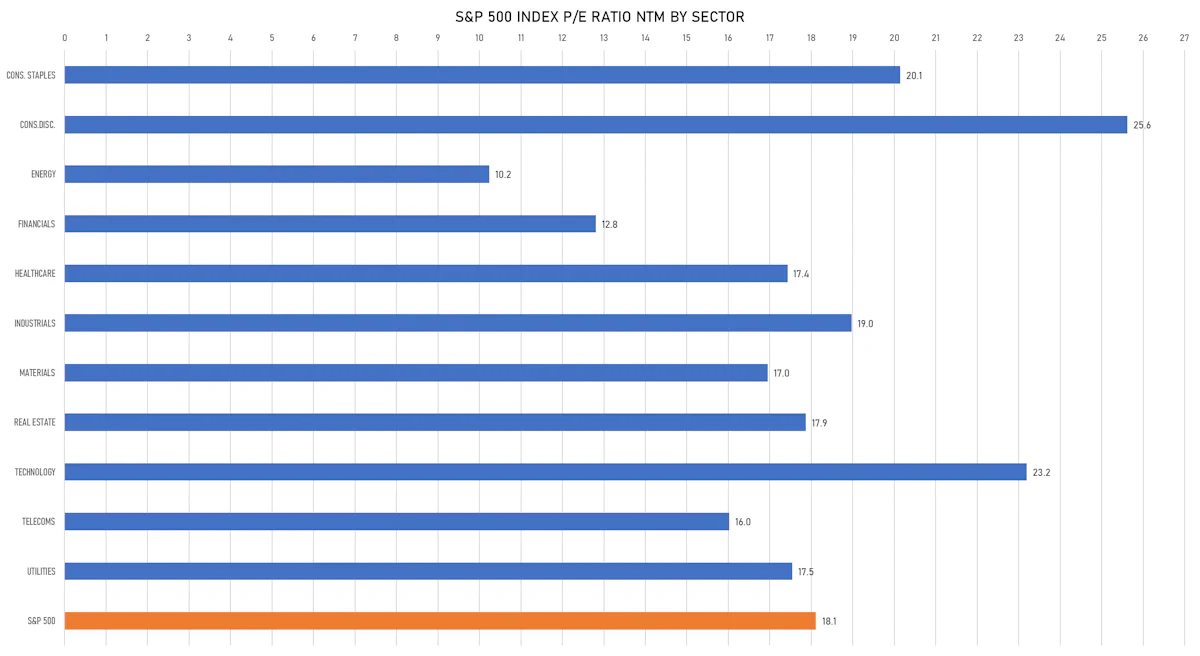
VALUATION MULTIPLES BY SECTORS
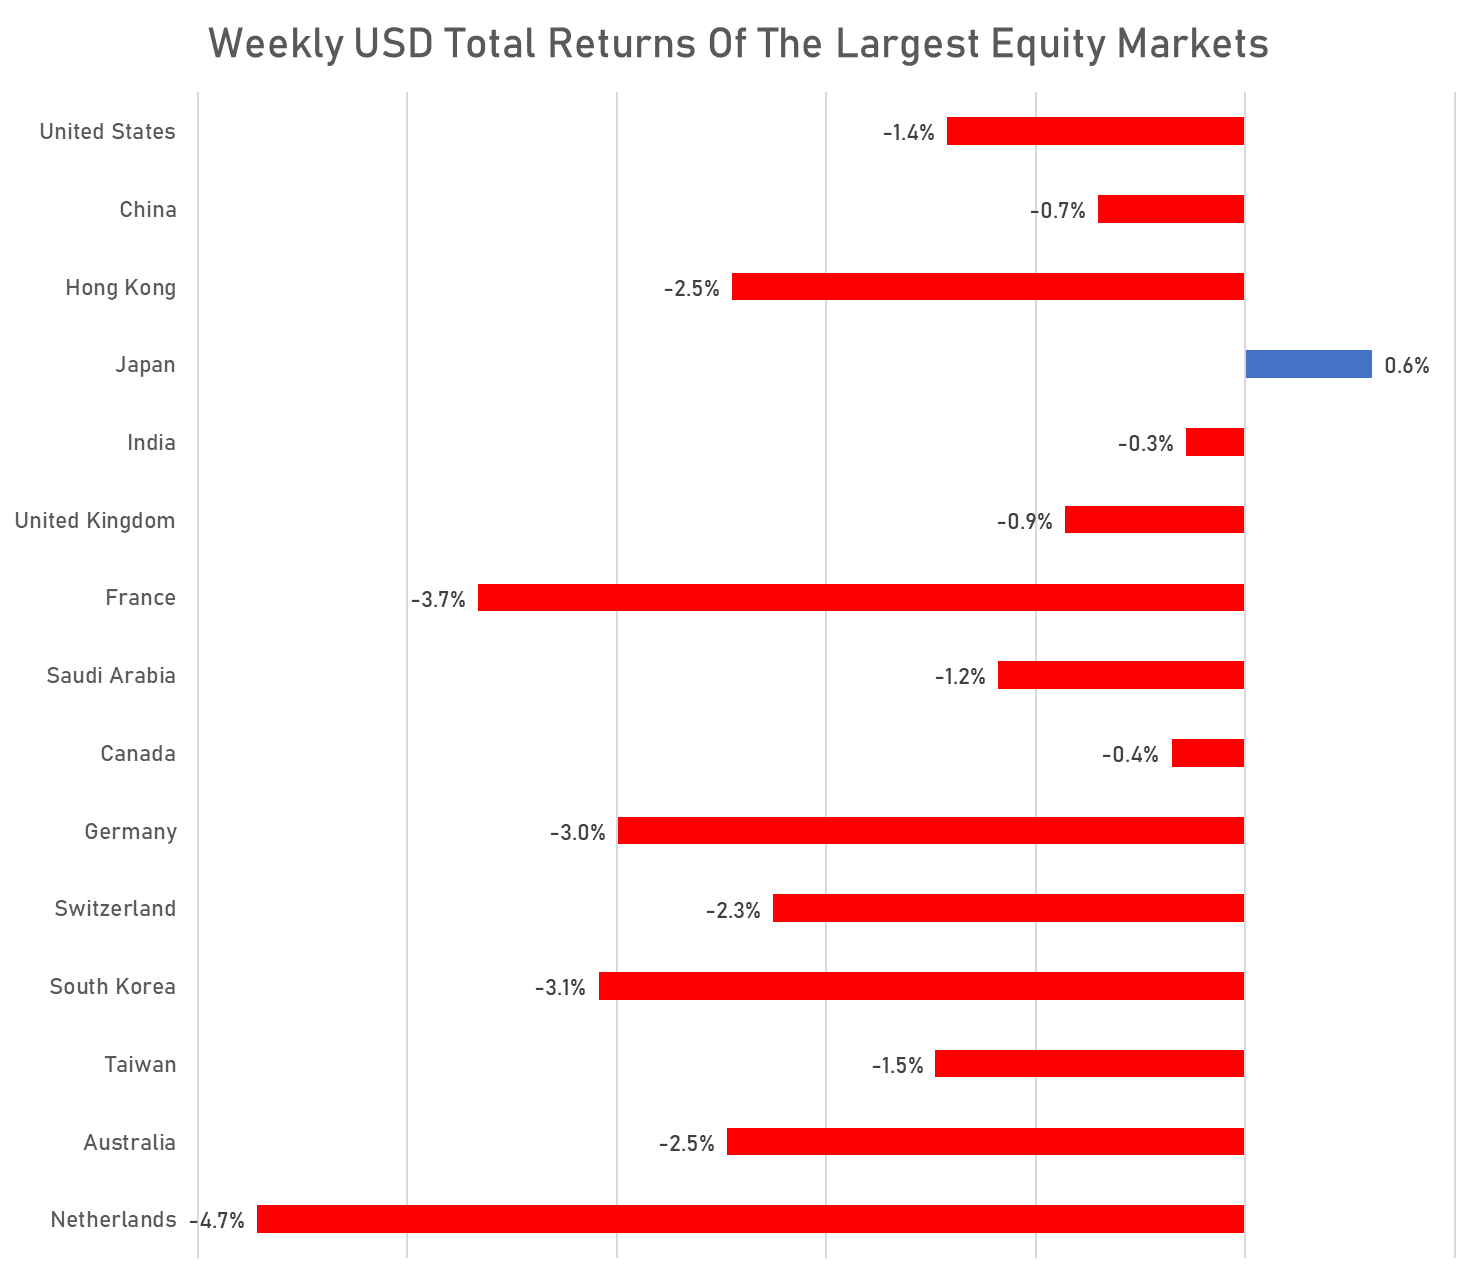
WEEKLY TOTAL RETURNS OF MAJOR GLOBAL EQUITY MARKETS
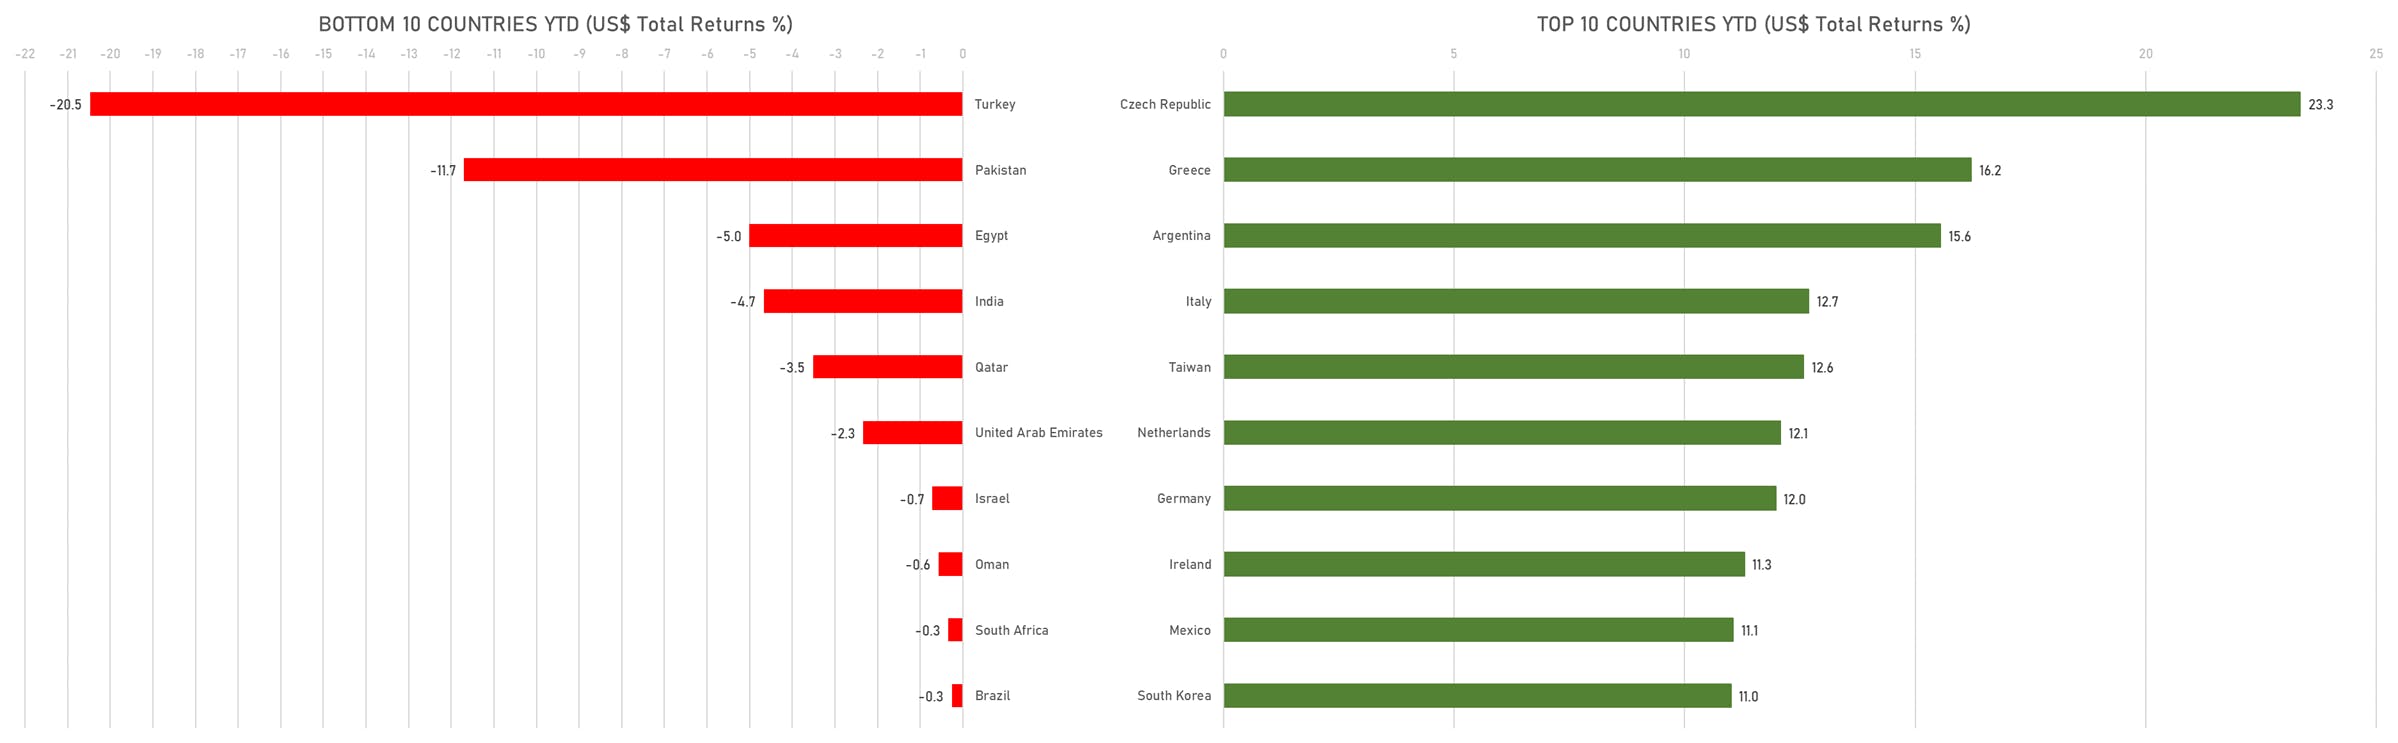
TOP / BOTTOM PERFORMING WORLD MARKETS YTD
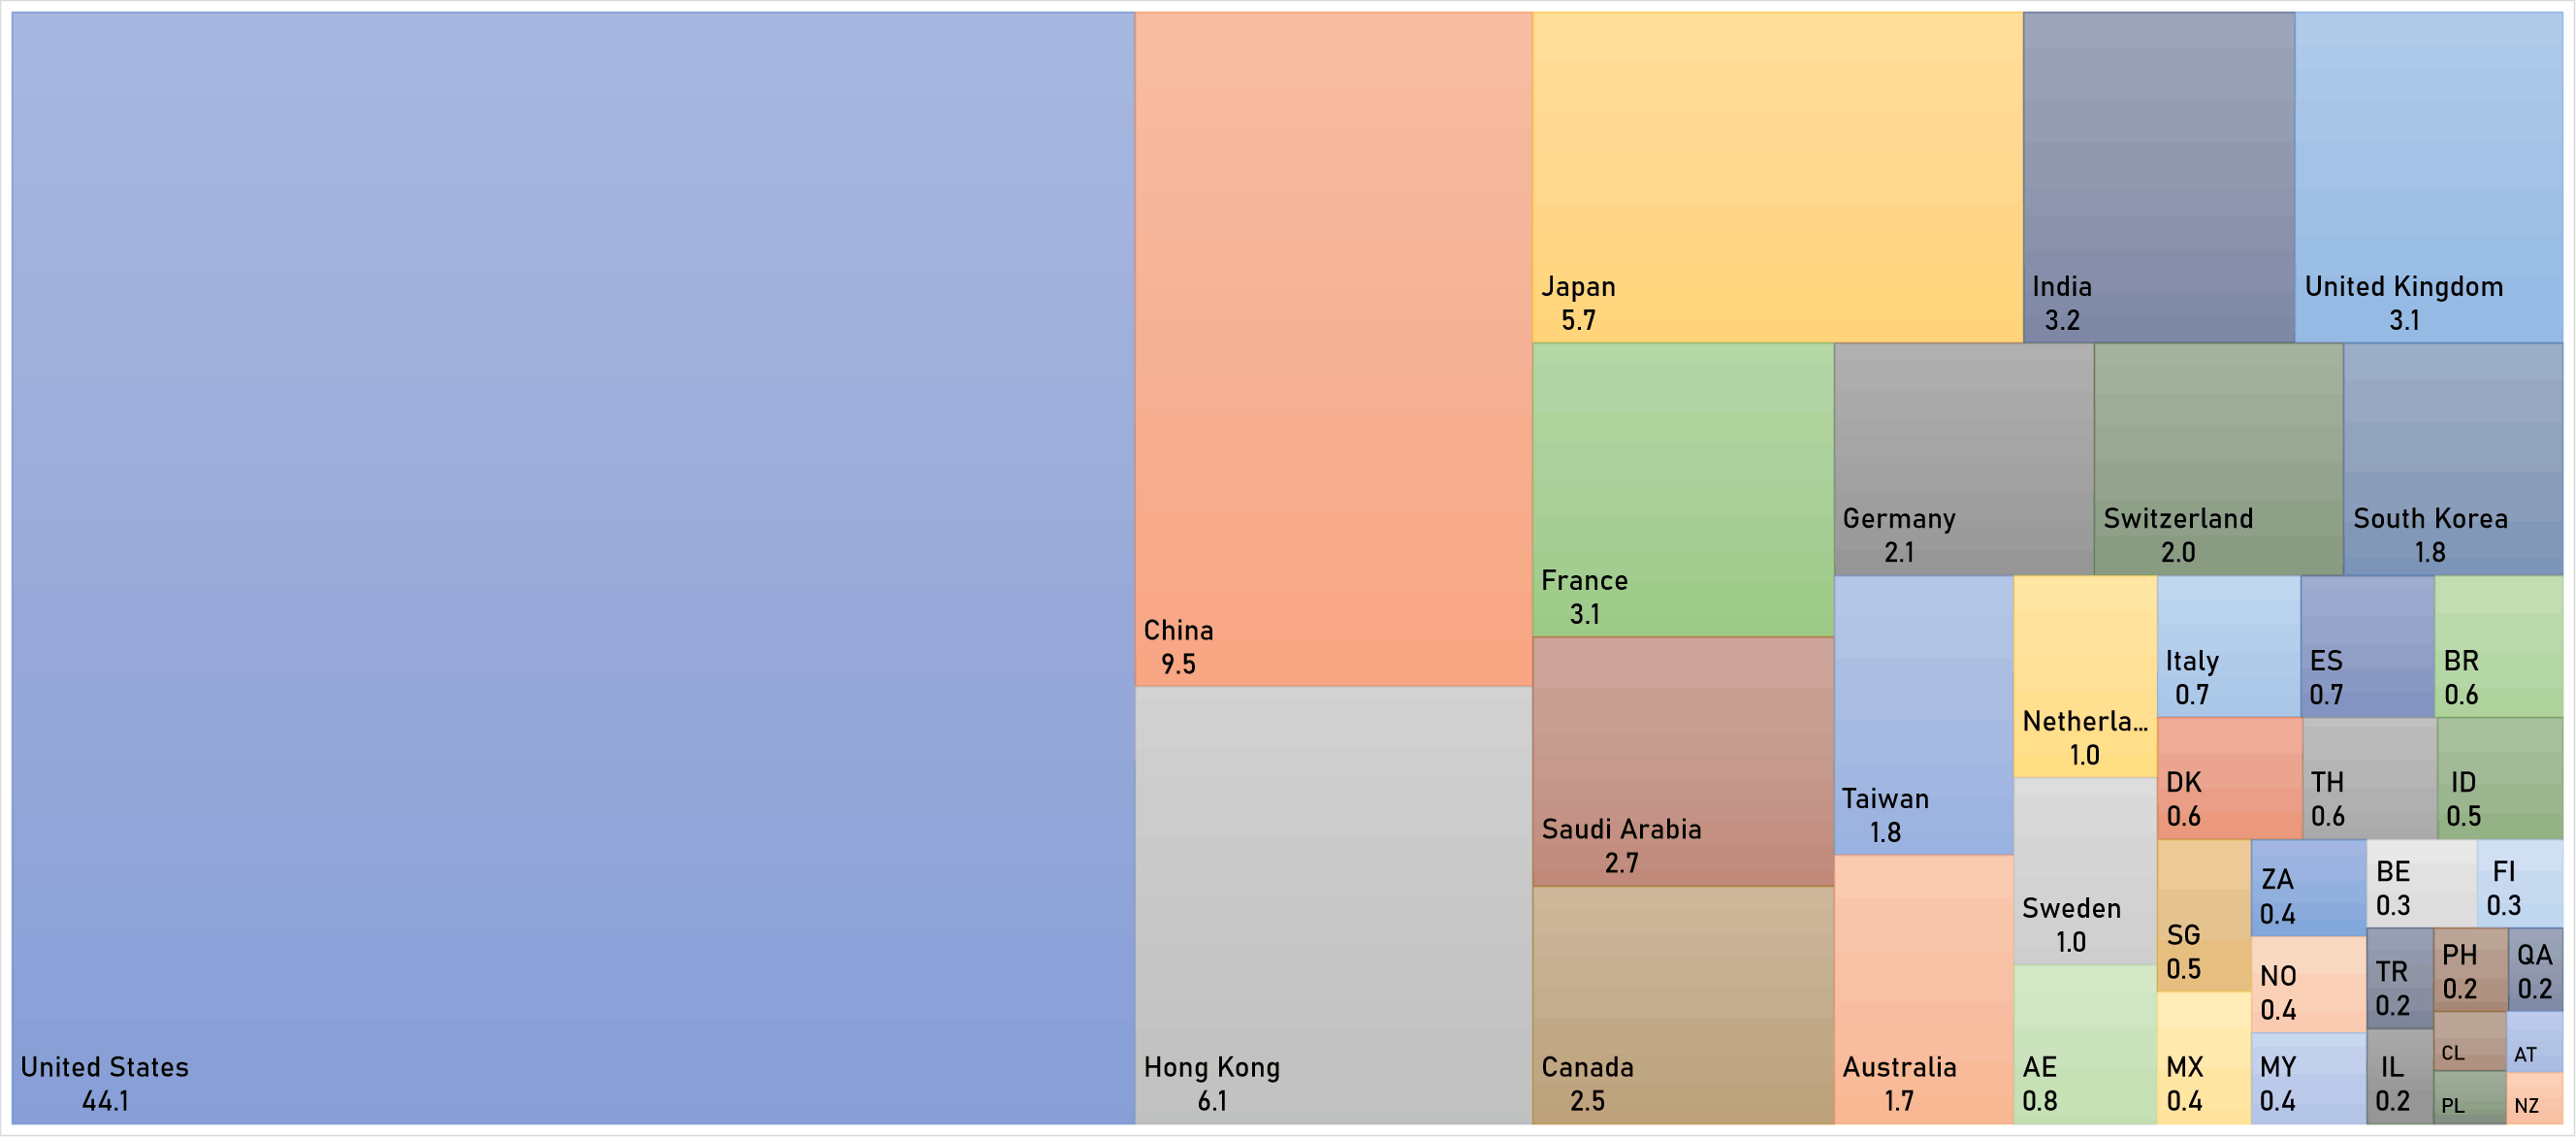
WORLD MARKET CAPITALIZATION (US$ Trillion)