Equities
US Equities Fairly Resilient Through Recent Rates Repricing, But Hard To See A Lot Of Upside Given Current Valuations
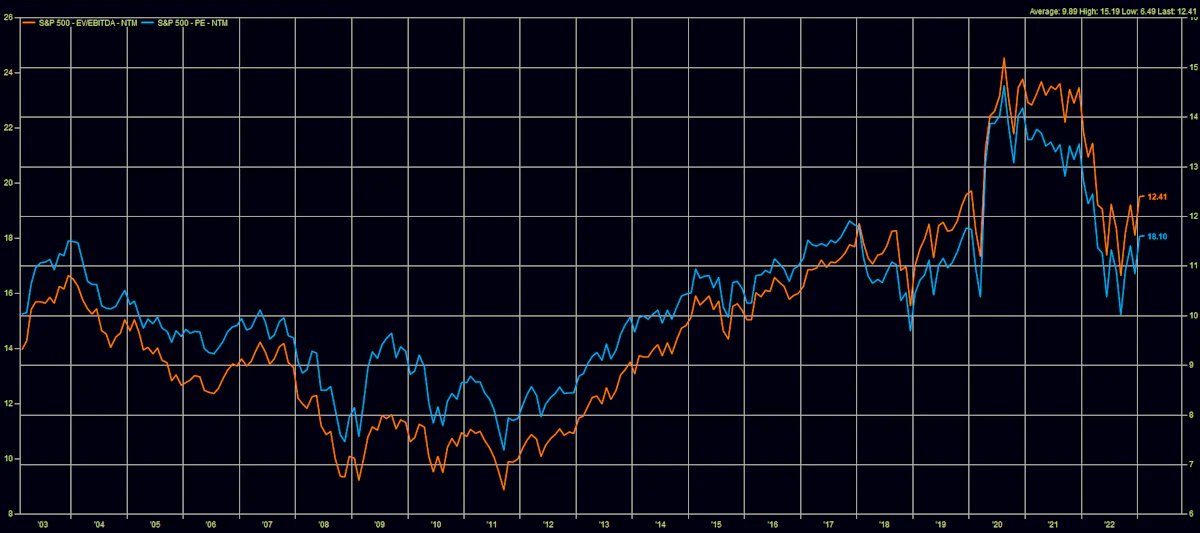
Despite the tremendous rebound in Chinese equities since October, the valuation levels remain reasonable compared to US and European large-cap equivalents
Published ET
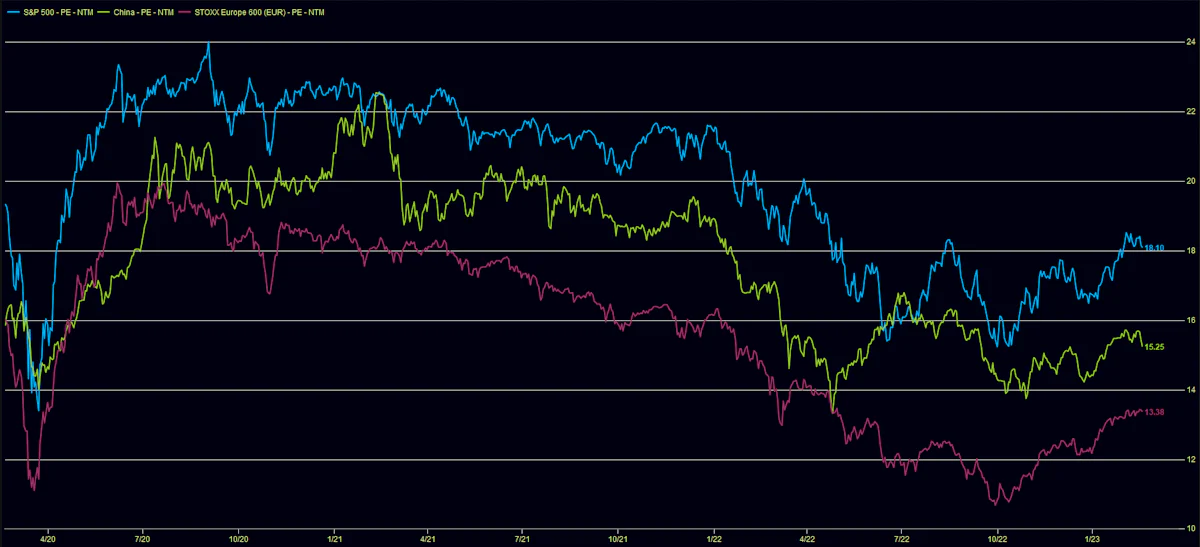
Forward P/E Multiples in US, Chinese, European Equities | Source: FactSet
DAILY SUMMARY
- Daily performance of US indices: S&P 500 down -0.28%; Nasdaq Composite down -0.58%; Wilshire 5000 down -0.46%
- 51.7% of S&P 500 stocks were up today, with 66.2% of stocks above their 200-day moving average (DMA) and 62.8% above their 50-DMA
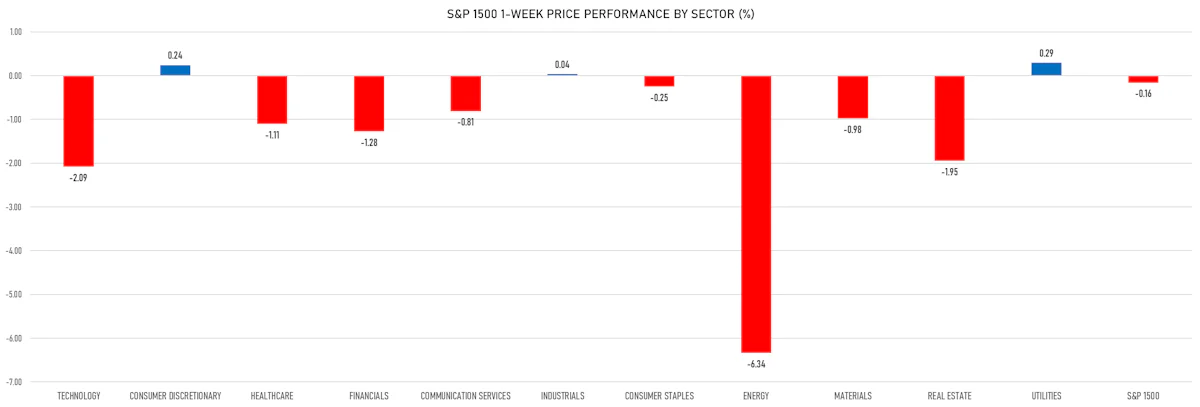
- Top performing sectors in the S&P 500: consumer staples up 1.29% and utilities up 1.00%
- Bottom performing sectors in the S&P 500: energy down -3.65% and technology down -1.19%
- The number of shares in the S&P 500 traded today was 673m for a total turnover of US$ 68 bn
- The S&P 500 Value Index Index was down -0.1%, while the S&P 500 Growth Index Index was down -0.4%; the S&P small caps index was up 0.1% and mid caps were down -0.1%
- The volume on CME's INX (S&P 500 Index) was 2,380.1m (3-month z-score: 0.0); the 3-month average volume is 2370.1m and the 12-month range is 903.0 - 5,089.5m
- Daily performance of international indices: Europe Stoxx 600 down -0.20%; UK FTSE 100 down -0.10%; Hang Seng SH-SZ-HK 300 Index down -1.43%; Japan's TOPIX 500 down -0.46%
VOLATILITY TODAY
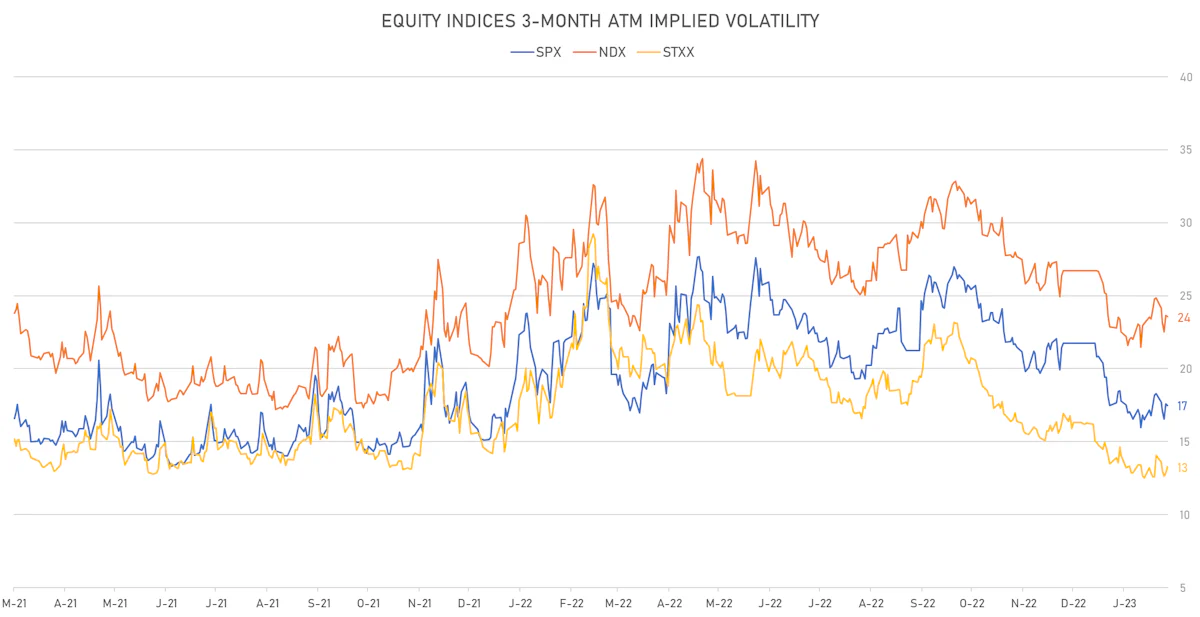
- 3-month at-the-money implied volatility on the S&P 500 at 17.5%, down from 17.6%
- 3-month at-the-money implied volatility on the STOXX Europe 600 at 13.5%, up from 13.2%
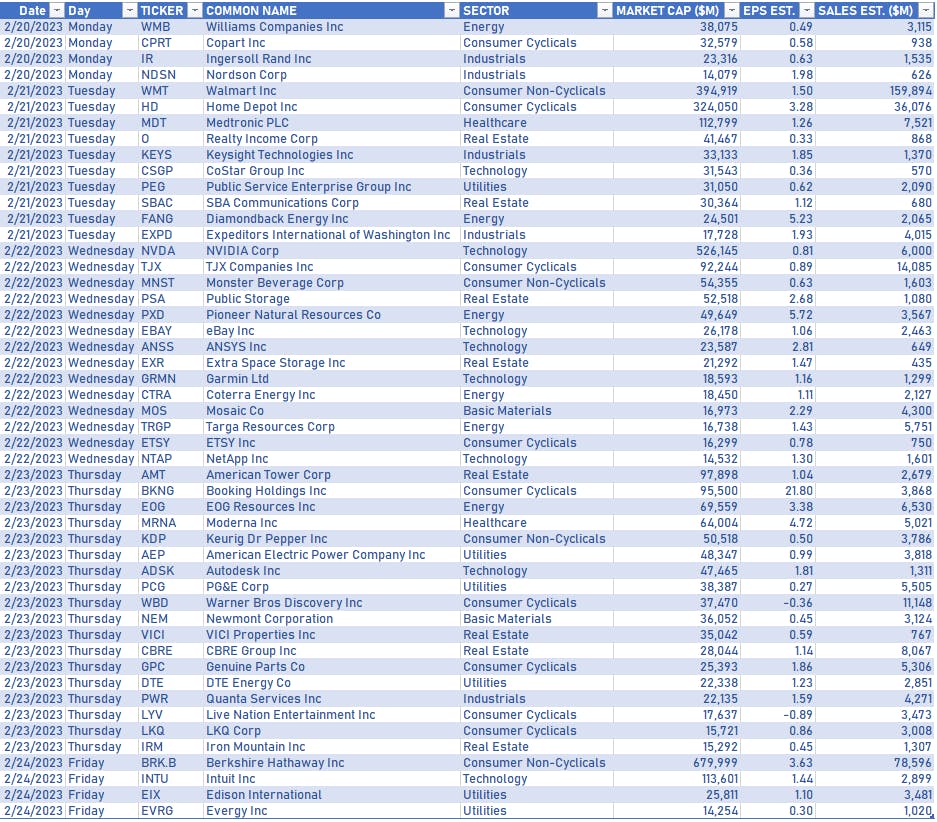
NOTABLE US EARNINGS RELEASES IN THE WEEK AHEAD
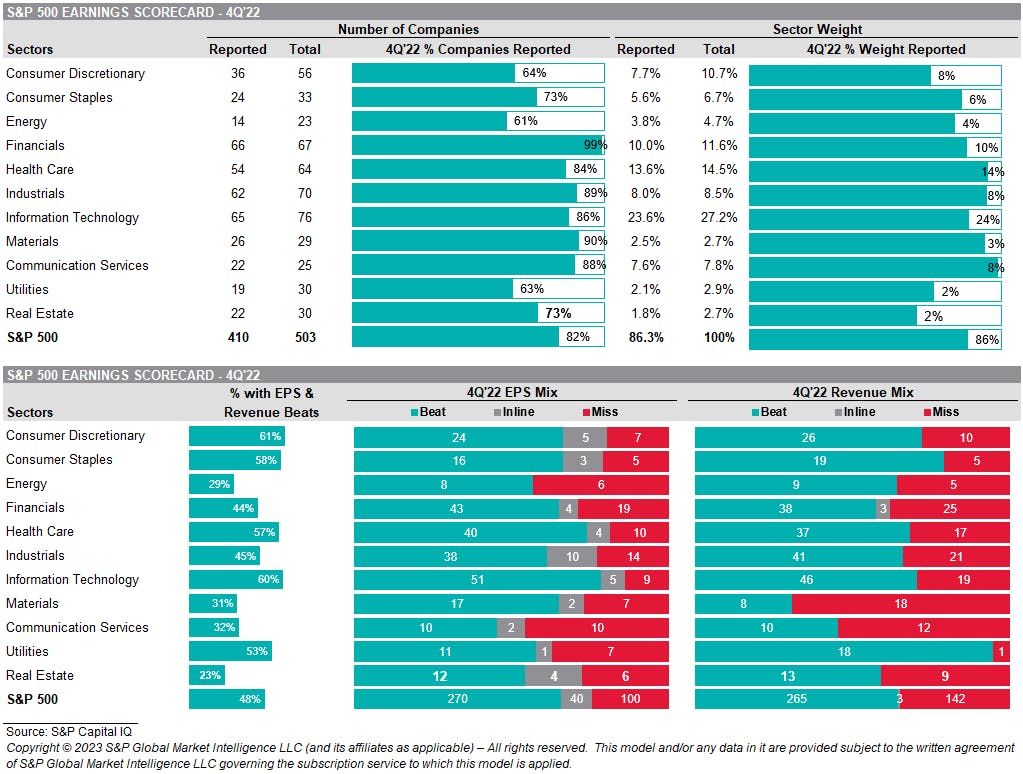
4Q22 EARNINGS DASHBOARD (S&P CAPITAL IQ)
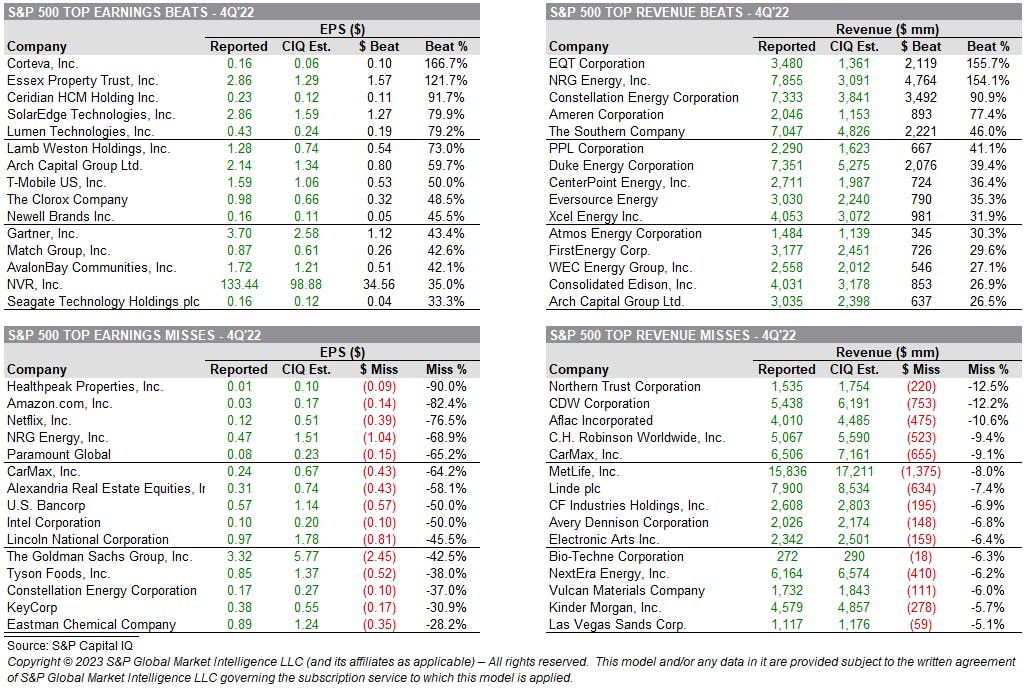
TOP EARNINGS BEATS & MISSES (S&P CAPITAL IQ)
TOP S&P 500 PERFORMERS THIS WEEK
- West Pharmaceutical Services Inc (WST), up 15.7% to $313.72 / YTD price return: +33.3% / 12-Month Price Range: $ 207.37-424.00 / Short interest (% of float): 1.8%; days to cover: 2.4
- Ecolab Inc (ECL), up 11.2% to $162.41 / YTD price return: +11.6% / 12-Month Price Range: $ 131.04-185.46 / Short interest (% of float): 0.7%; days to cover: 1.8
- Paramount Global (PARA), up 9.7% to $23.69 / YTD price return: +40.3% / 12-Month Price Range: $ 15.29-39.21 / Short interest (% of float): 14.9%; days to cover: 7.7
- Generac Holdings Inc (GNRC), up 8.7% to $126.77 / YTD price return: +25.9% / 12-Month Price Range: $ 86.33-328.60 / Short interest (% of float): 11.2%; days to cover: 4.2
- Zoetis Inc (ZTS), up 8.7% to $172.03 / YTD price return: +17.4% / 12-Month Price Range: $ 124.46-201.29 / Short interest (% of float): 0.9%; days to cover: 1.9
- Norwegian Cruise Line Holdings Ltd (NCLH), up 8.6% to $17.63 / YTD price return: +44.0% / 12-Month Price Range: $ 10.31-23.42 / Short interest (% of float): 10.0%; days to cover: 3.1
- Warner Bros Discovery Inc (WBD), up 8.5% to $15.43 / YTD price return: +62.8% / 12-Month Price Range: $ 8.83-30.74 / Short interest (% of float): 3.5%; days to cover: 2.5
- Analog Devices Inc (ADI), up 8.0% to $192.71 / YTD price return: +17.5% / 12-Month Price Range: $ 133.48-196.41 / Short interest (% of float): 1.0%; days to cover: 1.6
- Illumina Inc (ILMN), up 7.8% to $211.83 / YTD price return: +4.8% / 12-Month Price Range: $ 173.48-370.98 / Short interest (% of float): 2.5%; days to cover: 3.1
- Cisco Systems Inc (CSCO), up 7.4% to $50.77 / YTD price return: +6.6% / 12-Month Price Range: $ 38.61-57.69 / Short interest (% of float): 1.0%; days to cover: 2.4
BOTTOM S&P 500 PERFORMERS THIS WEEK
- Devon Energy Corp (DVN), down 16.1% to $53.33 / YTD price return: -13.3% / 12-Month Price Range: $ 48.89-79.40 / Short interest (% of float): 1.8%; days to cover: 1.5
- APA Corp (US) (APA), down 12.6% to $38.09 / YTD price return: -18.4% / 12-Month Price Range: $ 29.97-51.95 / Short interest (% of float): 2.7%; days to cover: 1.6
- EOG Resources Inc (EOG), down 11.7% to $118.42 / YTD price return: -8.6% / 12-Month Price Range: $ 90.02-149.10 / Short interest (% of float): 1.2%; days to cover: 2.2
- Organon & Co (OGN), down 10.3% to $26.02 / YTD price return: -6.8% / 12-Month Price Range: $ 22.88-39.47 / Short interest (% of float): 1.9%; days to cover: 2.3 (the stock is currently on the short sale restriction list)
- Diamondback Energy Inc (FANG), down 9.8% to $134.68 / YTD price return: -1.5% / 12-Month Price Range: $ 101.92-168.95 / Short interest (% of float): 2.6%; days to cover: 2.0
- Pioneer Natural Resources Co (PXD), down 9.7% to $208.96 / YTD price return: -8.5% / 12-Month Price Range: $ 200.13-288.32 / Short interest (% of float): 2.0%; days to cover: 2.8
- Akamai Technologies Inc (AKAM), down 9.6% to $77.30 / YTD price return: -8.3% / 12-Month Price Range: $ 76.37-123.19 / Short interest (% of float): 4.8%; days to cover: 5.9
- Conocophillips (COP), down 9.5% to $104.12 / YTD price return: -11.8% / 12-Month Price Range: $ 78.32-138.45 / Short interest (% of float): 0.9%; days to cover: 2.1
- CF Industries Holdings Inc (CF), down 9.0% to $82.35 / YTD price return: -3.3% / 12-Month Price Range: $ 72.54-119.57 / Short interest (% of float): 2.5%; days to cover: 1.8
- Valero Energy Corp (VLO), down 7.9% to $129.61 / YTD price return: +2.2% / 12-Month Price Range: $ 79.66-152.15 / Short interest (% of float): 2.5%; days to cover: 2.6
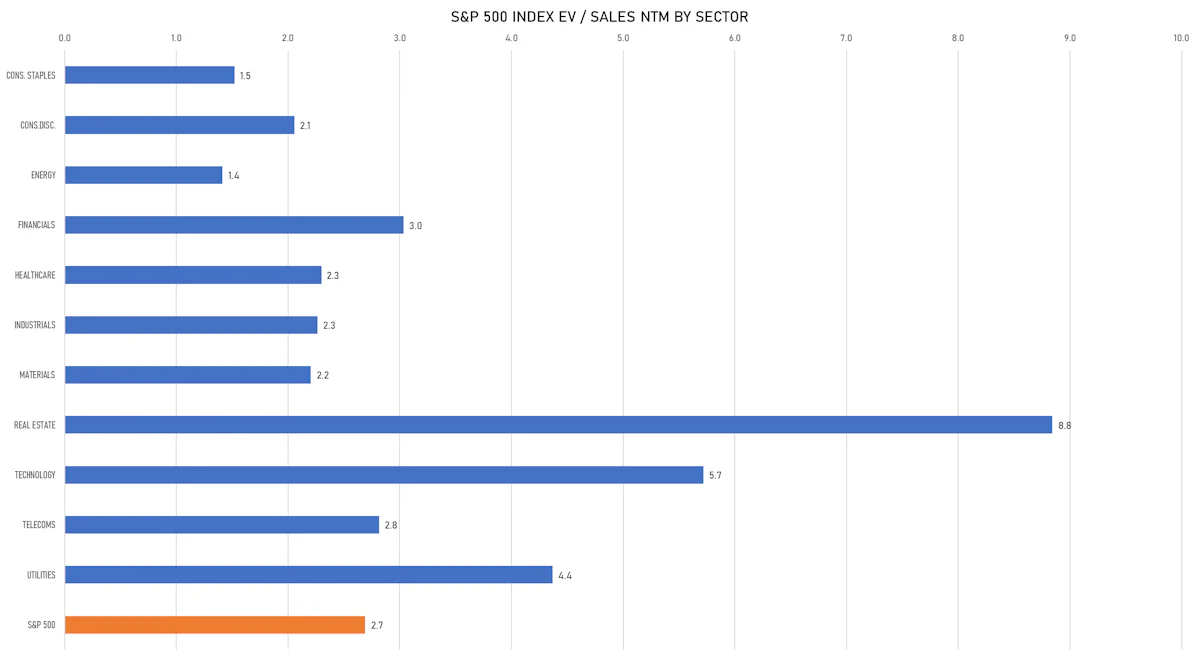
VALUATION MULTIPLES BY SECTORS
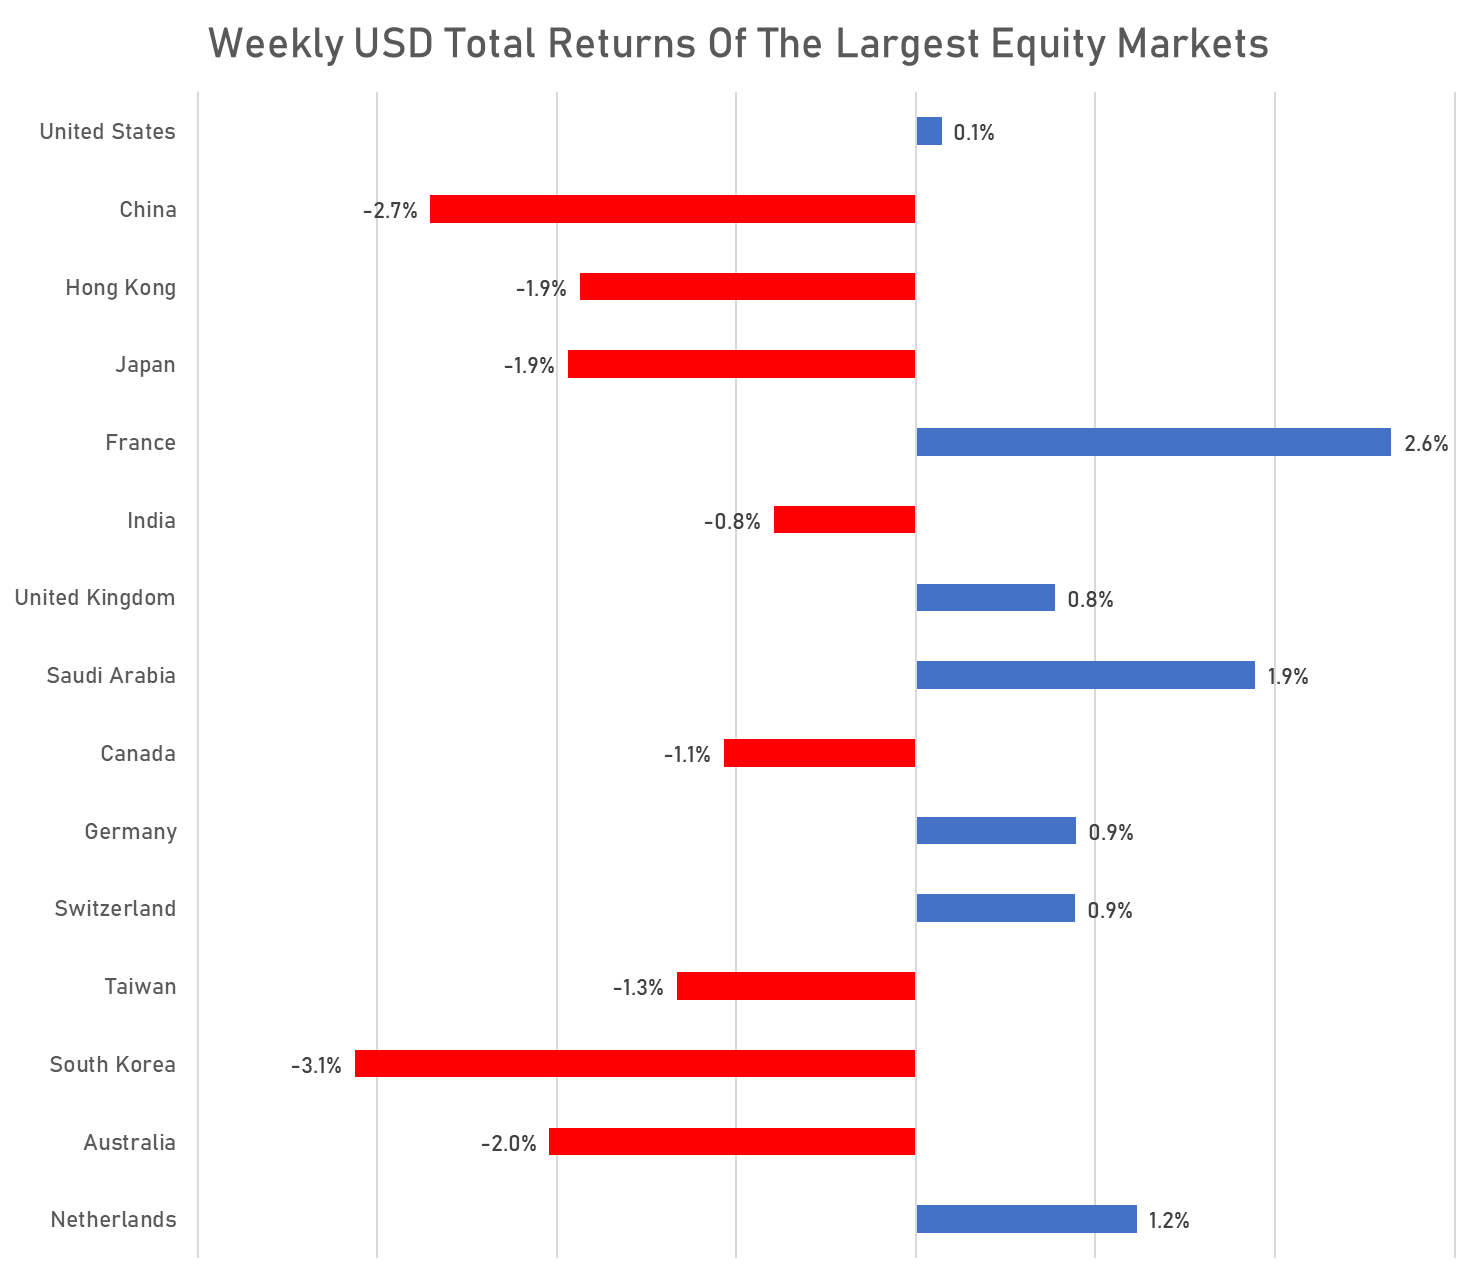
WEEKLY TOTAL RETURNS OF MAJOR GLOBAL EQUITY MARKETS
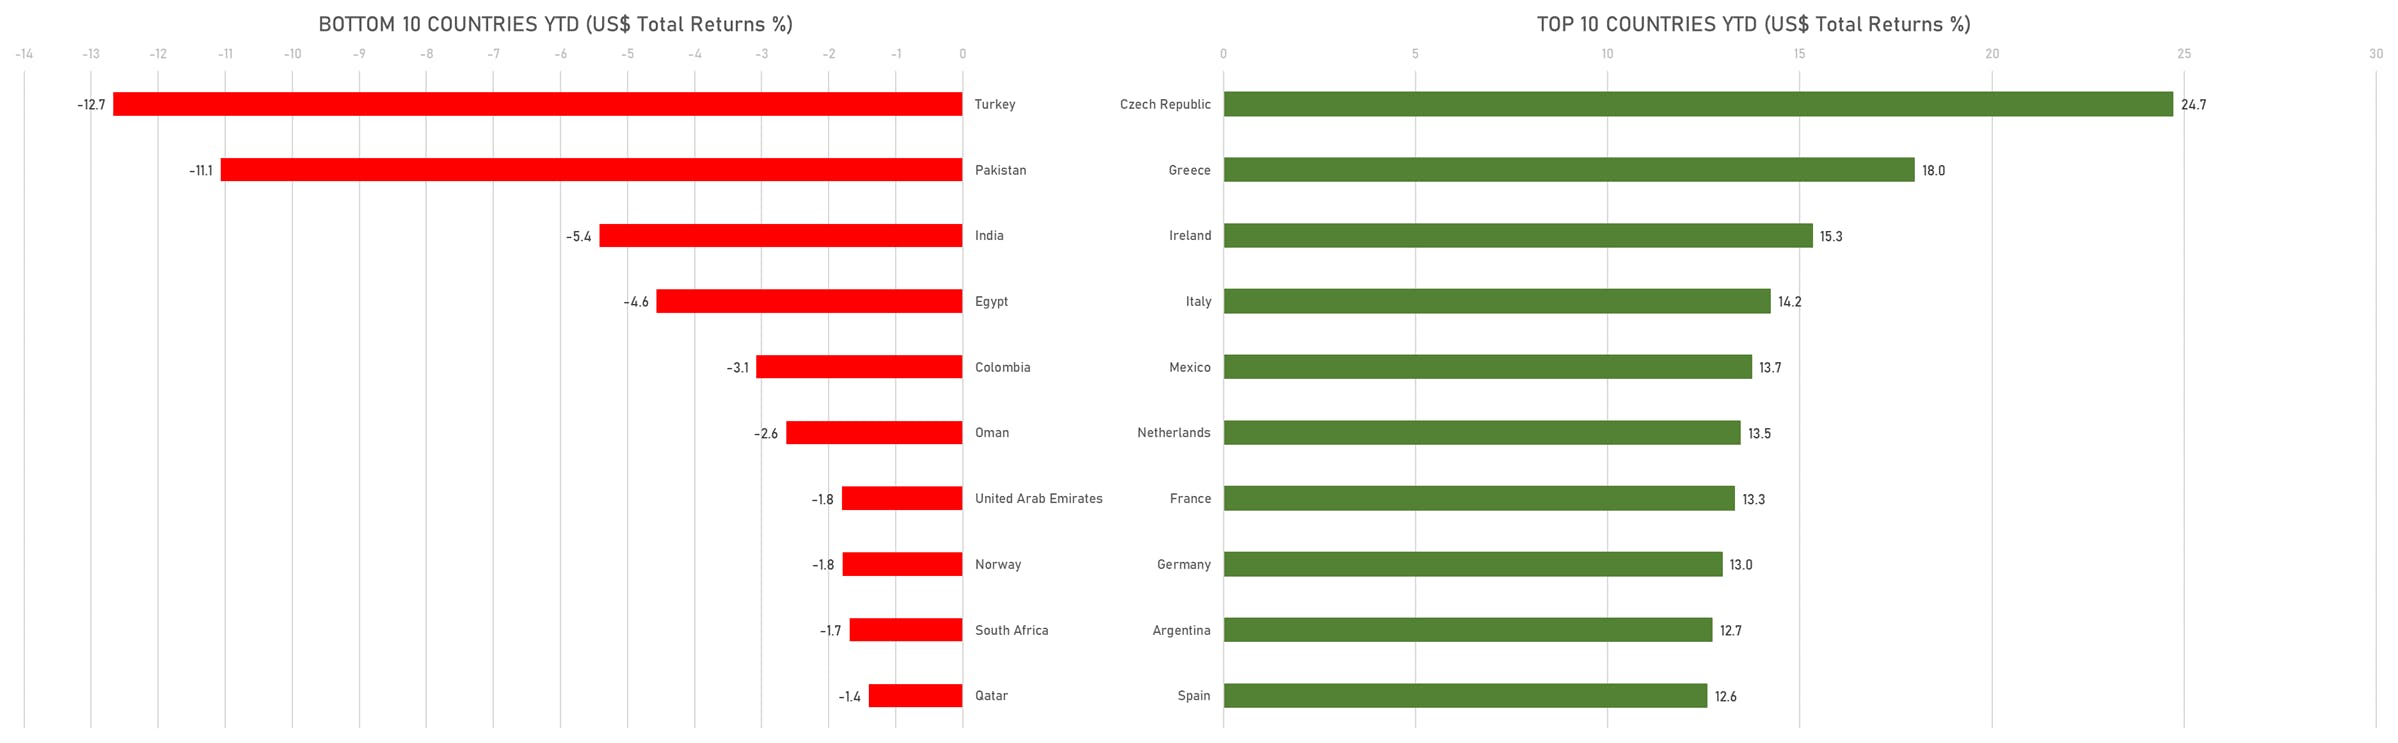
TOP / BOTTOM PERFORMING WORLD MARKETS YTD
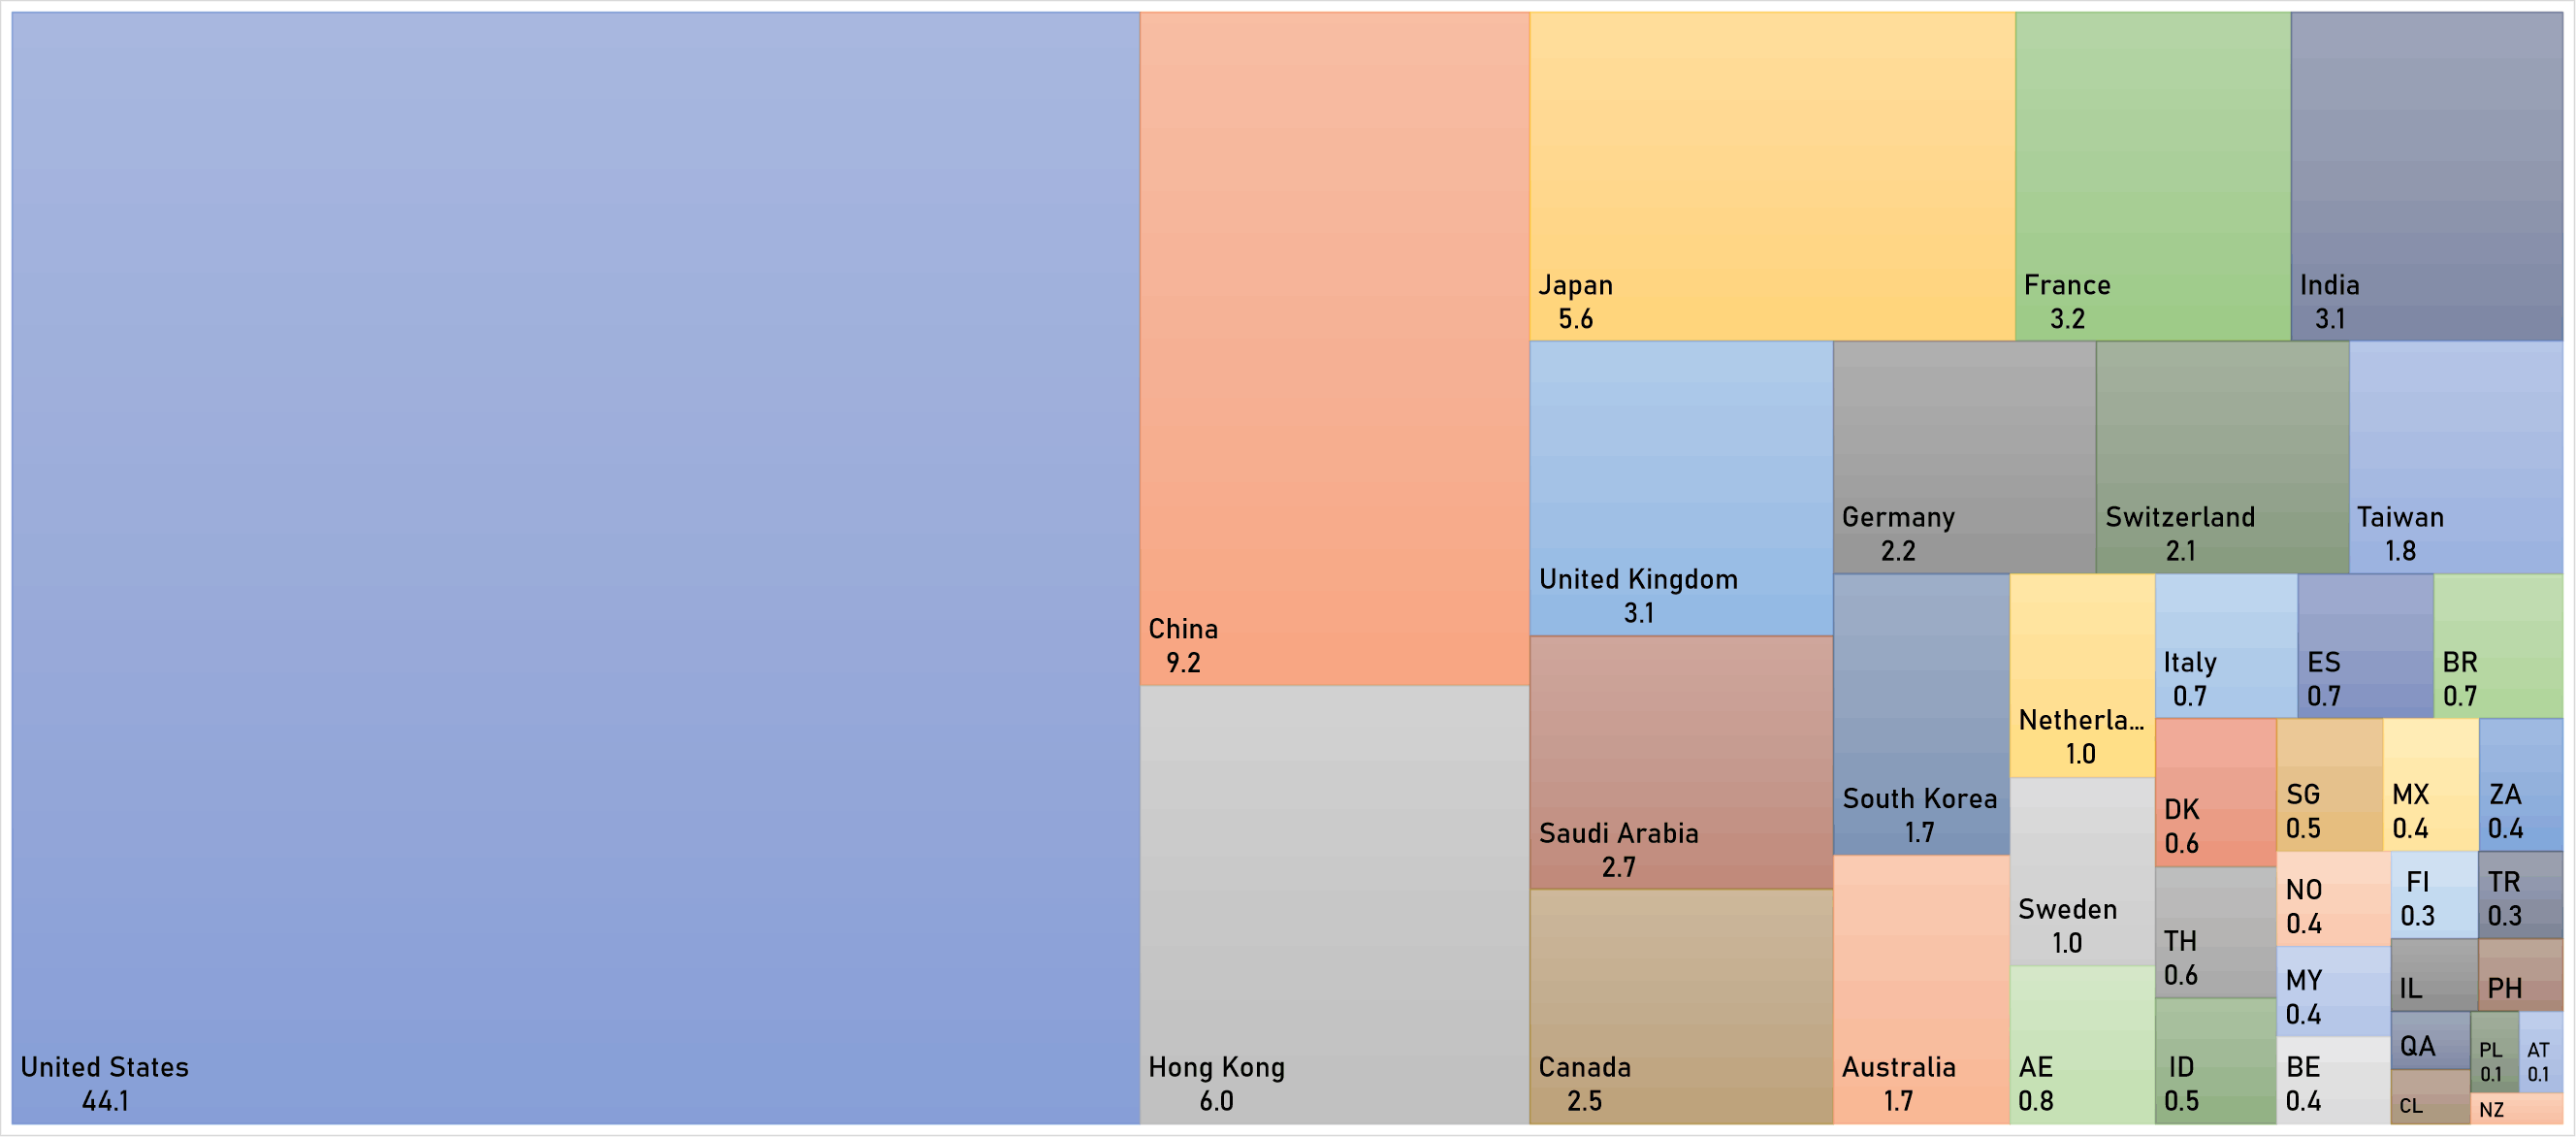
WORLD MARKET CAPITALIZATION (US$ Trillion)