Equities
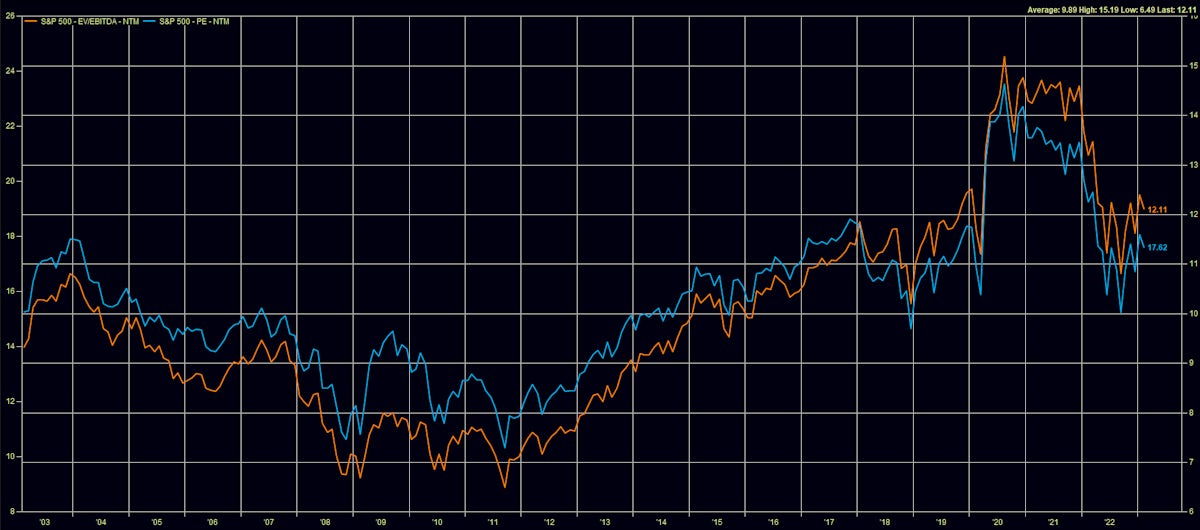
US Valuations Have Come Down Somewhat With Higher Rates, But The Equity Risk Premium Remains Low
In the absence of pressure on risk premia, the story of equities this month has been entirely driven by a shift in the economic narrative, with investors wondering how high rates will need to go for the Fed to achieve a landing
Published ET
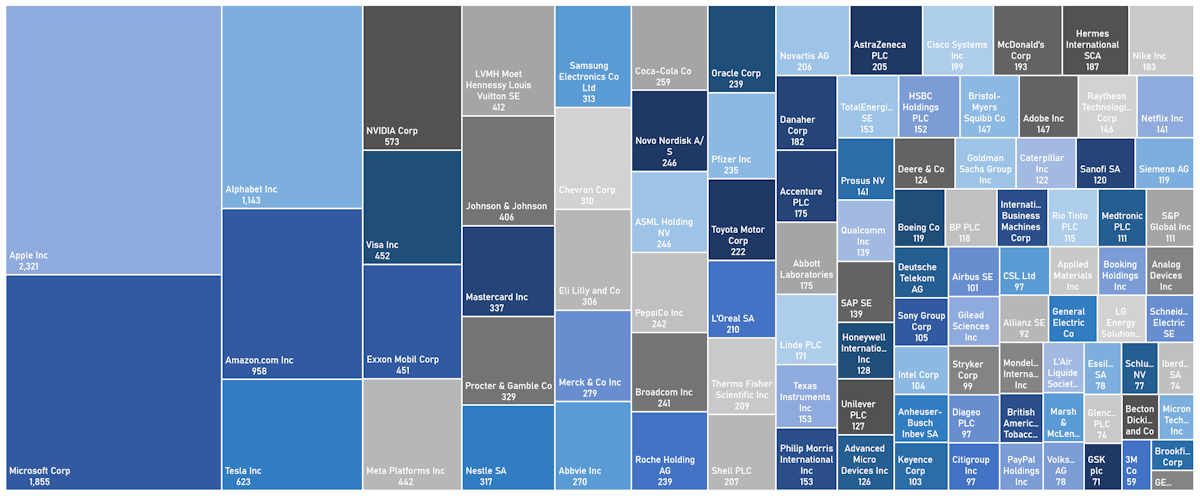
FTSE Global 100 Index | Sources: phipost.com, Refinitiv data
DAILY SUMMARY
- Daily performance of US indices: S&P 500 down -1.05%; Nasdaq Composite down -1.69%; Wilshire 5000 down -1.16%
- 21.7% of S&P 500 stocks were up today, with 56.9% of stocks above their 200-day moving average (DMA) and 43.7% above their 50-DMA
- Top performing sectors in the S&P 500: materials up 0.65% and financials up 0.11%
- Bottom performing sectors in the S&P 500: real estate down -1.81% and technology down -1.77%
- The number of shares in the S&P 500 traded today was 604m for a total turnover of US$ 61 bn
- The S&P 500 Value Index Index was down -0.8%, while the S&P 500 Growth Index Index was down -1.3%; the S&P small caps index was down -1.0% and mid caps were down -0.8%
- The volume on CME's INX (S&P 500 Index) was 2180.2m (3-month z-score: -0.4); the 3-month average volume is 2,372.3m and the 12-month range is 903.0 - 5,089.5m
- Daily performance of international indices: Europe Stoxx 600 down -1.04%; UK FTSE 100 down -0.37%; Hang Seng SH-SZ-HK 300 Index down -1.39%; Japan's TOPIX 500 up 0.65%
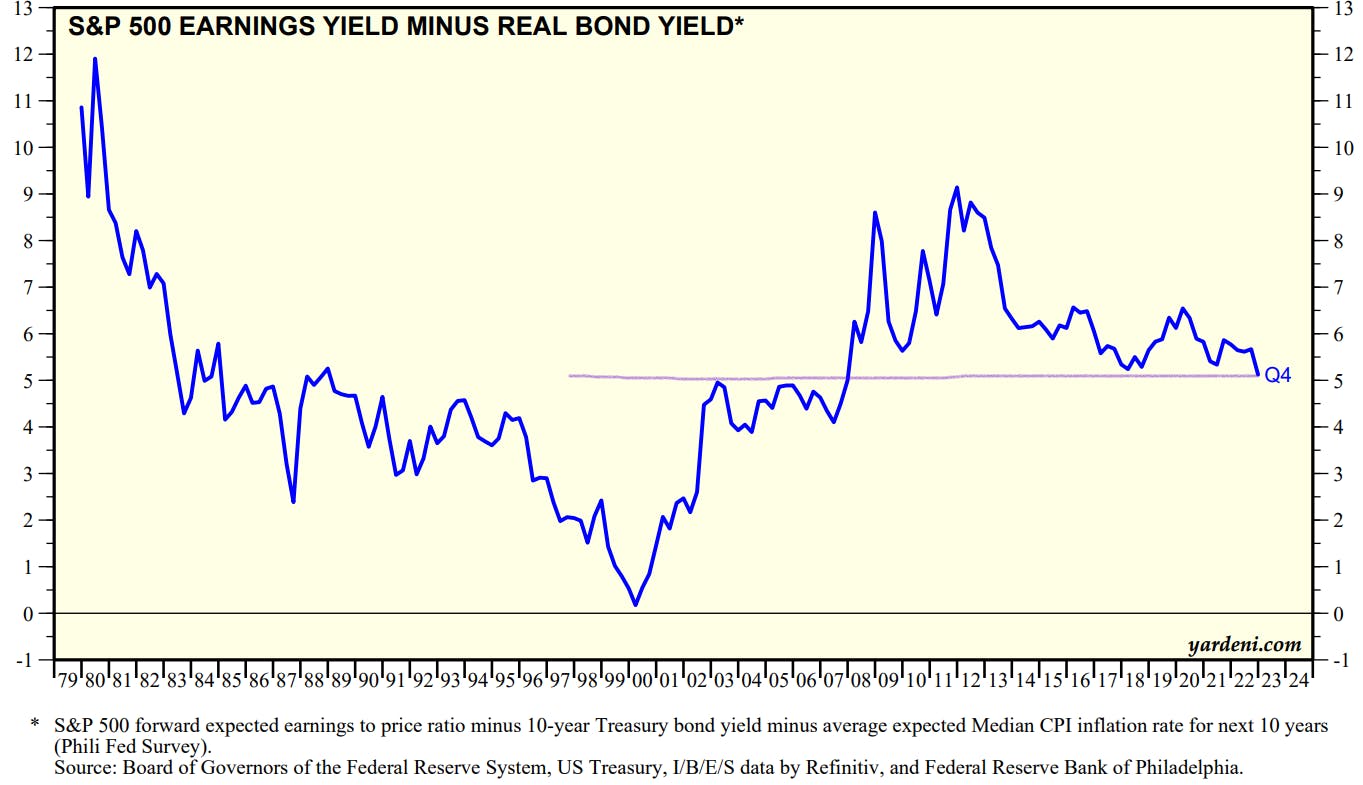
US Equity Risk Premium | Source: Yardeni.com
VOLATILITY TODAY
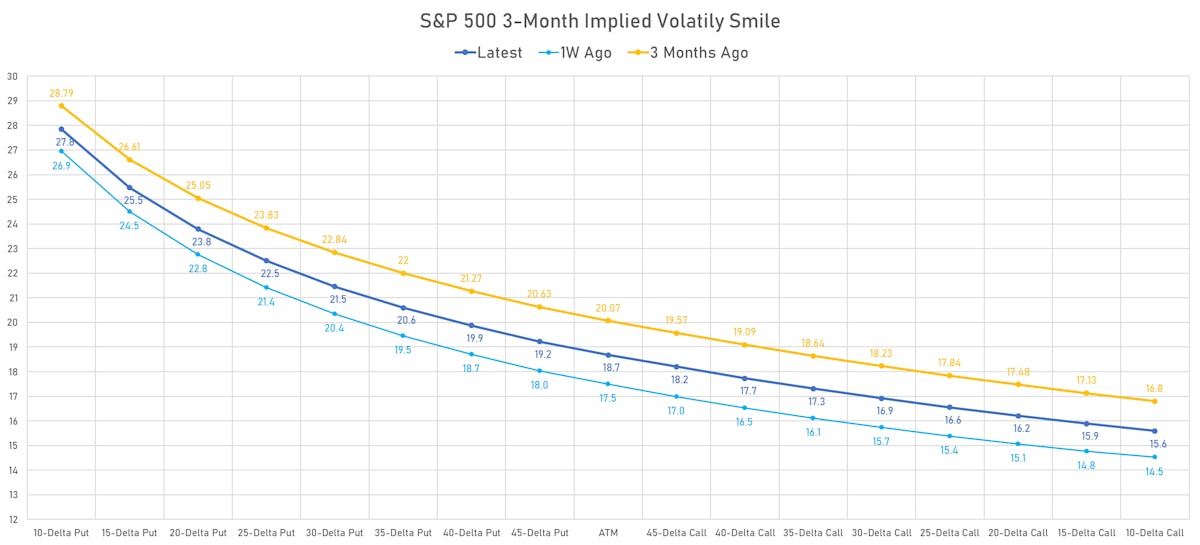
- 3-month at-the-money implied volatility on the S&P 500 at 18.7%, up from 18.0%
- 3-month at-the-money implied volatility on the STOXX Europe 600 at 14.5%, up from 13.9%
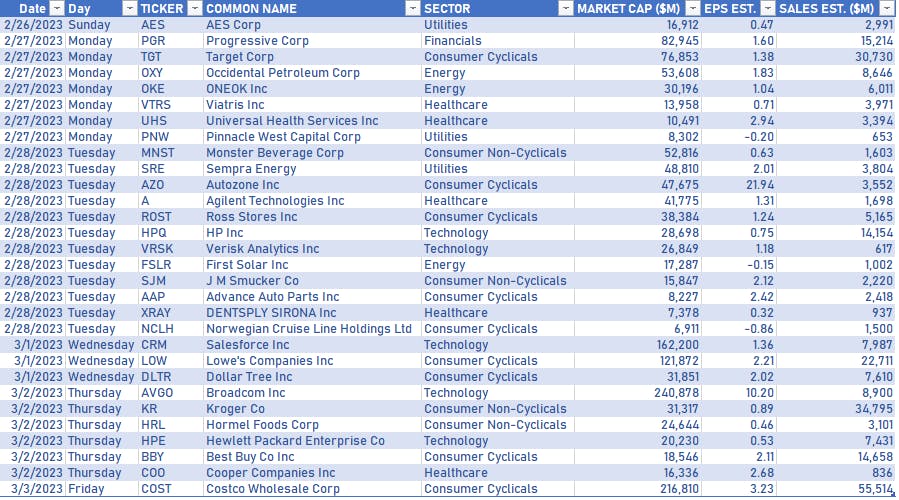
NOTABLE US EARNINGS RELEASES IN THE WEEK AHEAD
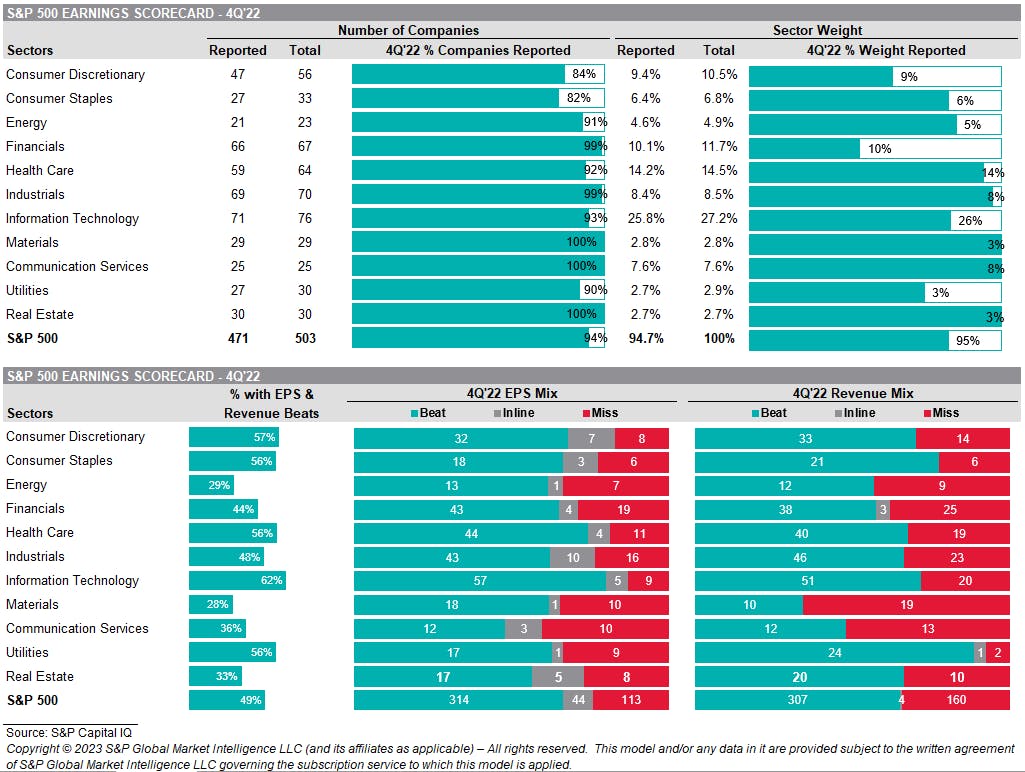
S&P 500 EARNINGS DASHBOARD
S&P 500 TOP EARNINGS BEATS / MISSES
![]()
TOP WINNERS TODAY
- Bridger Aerospace Group Holdings Inc (BAER), up 78.7% to $7.90 / YTD price return: -22.0% / 12-Month Price Range: $ 3.26-25.90 / Short interest (% of float): 0.3%; days to cover: 0.2
- Decarbonization Plus Acquisition Corporation IV (DCRD), up 40.5% to $14.15 / 12-Month Price Range: $ 8.98-14.15
- AVITA Medical Inc (RCEL), up 36.5% to $12.37 / YTD price return: +87.4% / 12-Month Price Range: $ 4.41-12.37 / Short interest (% of float): 7.9%; days to cover: 5.5
- Danimer Scientific Inc (DNMR), up 27.5% to $2.55 / YTD price return: +42.5% / 12-Month Price Range: $ 1.57-6.78 / Short interest (% of float): 18.7%; days to cover: 13.2
- Universal Insurance Holdings Inc (UVE), up 20.3% to $15.04 / YTD price return: +42.0% / 12-Month Price Range: $ 8.29-15.04 / Short interest (% of float): 1.9%; days to cover: 2.4
- Intuitive Machines Inc (LUNR), up 18.2% to $24.00 / YTD price return: +140.0% / 12-Month Price Range: $ 8.55-136.00 / Short interest (% of float): 0.0%; days to cover: 0.0
- Zeta Global Holdings Corp (ZETA), up 18.1% to $10.70 / YTD price return: +31.0% / 12-Month Price Range: $ 4.09-13.46 / Short interest (% of float): 5.7%; days to cover: 9.4
- Multiplan Corp (MPLN), up 16.4% to $1.05 / YTD price return: -8.7% / 12-Month Price Range: $ 0.87-6.19 / Short interest (% of float): 6.4%; days to cover: 12.6 (the stock is currently on the short sale restriction list)
- Kratos Defense and Security Solutions Inc (KTOS), up 13.2% to $12.98 / YTD price return: +25.8% / 12-Month Price Range: $ 8.91-22.26 / Short interest (% of float): 2.1%; days to cover: 3.3
- Altair Engineering Inc (ALTR), up 12.3% to $63.54 / YTD price return: +39.7% / 12-Month Price Range: $ 43.17-68.85 / Short interest (% of float): 4.4%; days to cover: 9.8
BIGGEST LOSERS TODAY
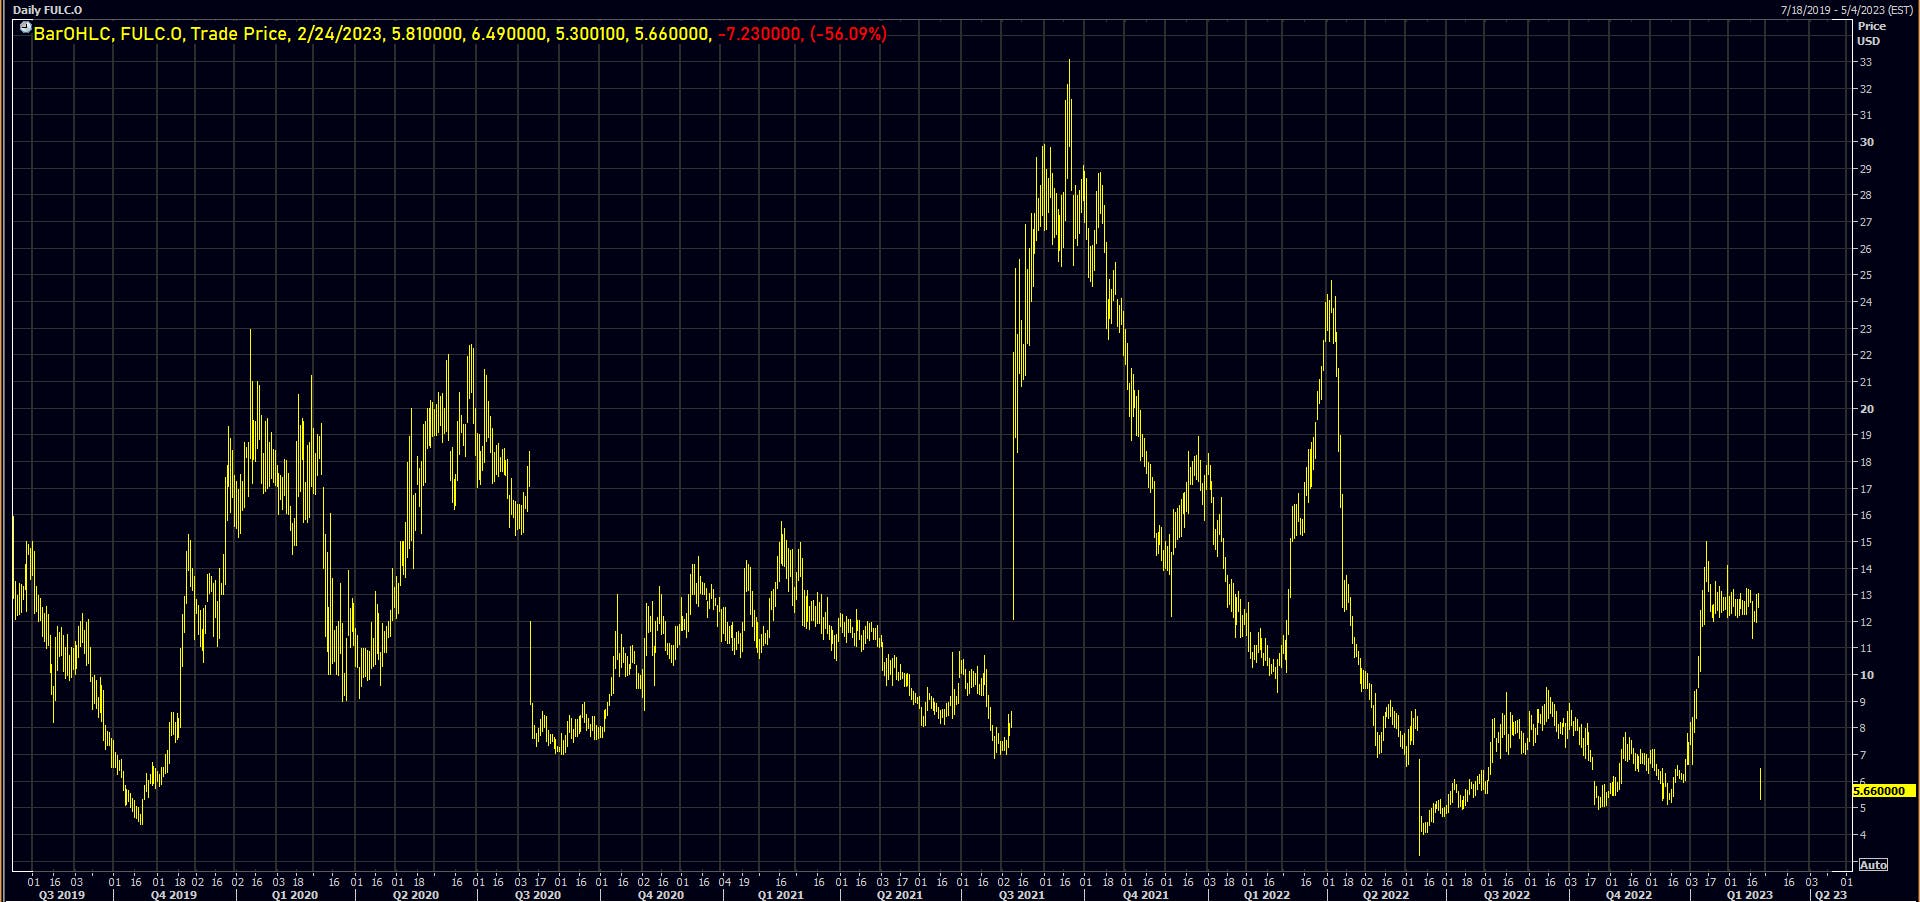
- Fulcrum Therapeutics Inc (FULC), down 56.1% to $5.66 / YTD price return: -22.3% / 12-Month Price Range: $ 3.21-24.79 / Short interest (% of float): 6.0%; days to cover: 3.2 (the stock is currently on the short sale restriction list)
- Nektar Therapeutics (NKTR), down 49.7% to $1.49 / YTD price return: -34.1% / 12-Month Price Range: $ 1.49-11.39 / Short interest (% of float): 5.4%; days to cover: 7.1 (the stock is currently on the short sale restriction list)
- Genesis Growth Tech Acquisition Corp (GGAA), down 34.2% to $11.22 / YTD price return: +8.3% / 12-Month Price Range: $ 9.91-27.37 / Short interest (% of float): 0.0%; days to cover: 0.1 (the stock is currently on the short sale restriction list)
- Inogen Inc (INGN), down 31.4% to $15.89 / YTD price return: -19.4% / 12-Month Price Range: $ 15.89-36.30 / Short interest (% of float): 4.7%; days to cover: 5.6 (the stock is currently on the short sale restriction list)
- CS Disco Inc (LAW), down 29.7% to $6.59 / YTD price return: +4.3% / 12-Month Price Range: $ 5.56-38.50 (the stock is currently on the short sale restriction list)
- ContextLogic Inc (WISH), down 28.7% to $.51 / YTD price return: +4.6% / 12-Month Price Range: $ .44-2.58 / Short interest (% of float): 8.0%; days to cover: 2.4 (the stock is currently on the short sale restriction list)
- Vicor Corp (VICR), down 27.5% to $40.85 / YTD price return: -24.0% / 12-Month Price Range: $ 40.85-100.40 / Short interest (% of float): 6.3%; days to cover: 6.6 (the stock is currently on the short sale restriction list)
- Open Lending Corp (LPRO), down 23.2% to $6.64 / YTD price return: -1.6% / 12-Month Price Range: $ 6.11-21.12 / Short interest (% of float): 7.4%; days to cover: 10.4 (the stock is currently on the short sale restriction list)
- Carvana Co (CVNA), down 20.5% to $8.01 / YTD price return: +69.0% / 12-Month Price Range: $ 3.55-156.68 / Short interest (% of float): 56.9%; days to cover: 2.1 (the stock is currently on the short sale restriction list)
- Bigcommerce Holdings Inc (BIGC), down 19.2% to $9.15 / YTD price return: +4.7% / 12-Month Price Range: $ 7.75-26.25 / Short interest (% of float): 5.5%; days to cover: 3.7 (the stock is currently on the short sale restriction list)
TOP S&P 500 PERFORMERS THIS WEEK
- EQT Corp (EQT), up 11.1% to $34.73 / YTD price return: +2.7% / 12-Month Price Range: $ 21.33-51.95 / Short interest (% of float): 5.7%; days to cover: 3.2
- Coterra Energy Inc (CTRA), up 9.2% to $25.56 / YTD price return: +4.0% / 12-Month Price Range: $ 21.22-36.55 / Short interest (% of float): 3.7%; days to cover: 3.4
- NVIDIA Corp (NVDA), up 8.9% to $232.86 / YTD price return: +59.3% / 12-Month Price Range: $ 108.14-289.34 / Short interest (% of float): 1.7%; days to cover: 0.9
- Linde PLC (LIN), up 8.1% to $347.66 / YTD price return: +6.6% / 12-Month Price Range: $ 262.52-347.66 / Short interest (% of float): 1.0%; days to cover: 2.7
- ANSYS Inc (ANSS), up 7.6% to $291.34 / YTD price return: +20.6% / 12-Month Price Range: $ 194.42-328.67 / Short interest (% of float): 0.9%; days to cover: 1.9
- Diamondback Energy Inc (FANG), up 5.7% to $142.38 / YTD price return: +4.1% / 12-Month Price Range: $ 101.92-168.95 / Short interest (% of float): 2.6%; days to cover: 2.0
- General Mills Inc (GIS), up 5.0% to $80.64 / YTD price return: -3.8% / 12-Month Price Range: $ 61.69-88.32 / Short interest (% of float): 2.4%; days to cover: 3.9
- CF Industries Holdings Inc (CF), up 3.9% to $85.59 / YTD price return: +.5% / 12-Month Price Range: $ 75.43-119.57 / Short interest (% of float): 2.5%; days to cover: 1.8
- Intuit Inc (INTU), up 3.8% to $419.81 / YTD price return: +7.9% / 12-Month Price Range: $ 339.36-507.61 / Short interest (% of float): 0.9%; days to cover: 1.7
- Quanta Services Inc (PWR), up 3.7% to $160.64 / YTD price return: +12.7% / 12-Month Price Range: $ 97.52-168.27 / Short interest (% of float): 3.1%; days to cover: 4.9
BOTTOM S&P 500 PERFORMERS THIS WEEK
- Domino's Pizza Inc (DPZ), down 16.8% to $297.47 / YTD price return: -14.1% / 12-Month Price Range: $ 297.47-447.01 / Short interest (% of float): 4.1%; days to cover: 2.6 (the stock is currently on the short sale restriction list)
- Moderna Inc (MRNA), down 16.4% to $139.26 / YTD price return: -22.5% / 12-Month Price Range: $ 115.06-217.20 / Short interest (% of float): 4.1%; days to cover: 3.0
- Keysight Technologies Inc (KEYS), down 15.1% to $157.81 / YTD price return: -7.8% / 12-Month Price Range: $ 127.96-189.28 / Short interest (% of float): 1.7%; days to cover: 3.3
- Autodesk Inc (ADSK), down 12.5% to $192.53 / YTD price return: +3.0% / 12-Month Price Range: $ 163.20-234.99 / Short interest (% of float): 1.1%; days to cover: 2.0 (the stock is currently on the short sale restriction list)
- Charles River Laboratories International Inc (CRL), down 12.0% to $219.81 / YTD price return: +.9% / 12-Month Price Range: $ 181.37-308.00 / Short interest (% of float): 2.3%; days to cover: 2.3
- Nordson Corp (NDSN), down 10.5% to $220.32 / YTD price return: -7.3% / 12-Month Price Range: $ 195.06-251.24 / Short interest (% of float): 2.1%; days to cover: 3.5
- VF Corp (VFC), down 10.4% to $24.18 / YTD price return: -12.4% / 12-Month Price Range: $ 24.18-60.09 / Short interest (% of float): 4.9%; days to cover: 3.2
- Adobe Inc (ADBE), down 10.2% to $320.54 / YTD price return: -4.8% / 12-Month Price Range: $ 274.80-479.18 / Short interest (% of float): 1.1%; days to cover: 1.8
- Live Nation Entertainment Inc (LYV), down 10.0% to $68.78 / YTD price return: -1.4% / 12-Month Price Range: $ 65.08-126.79 / Short interest (% of float): 8.2%; days to cover: 6.6 (the stock is currently on the short sale restriction list)
- Epam Systems Inc (EPAM), down 9.5% to $306.03 / YTD price return: -6.6% / 12-Month Price Range: $ 168.81-462.72 / Short interest (% of float): 1.2%; days to cover: 2.1
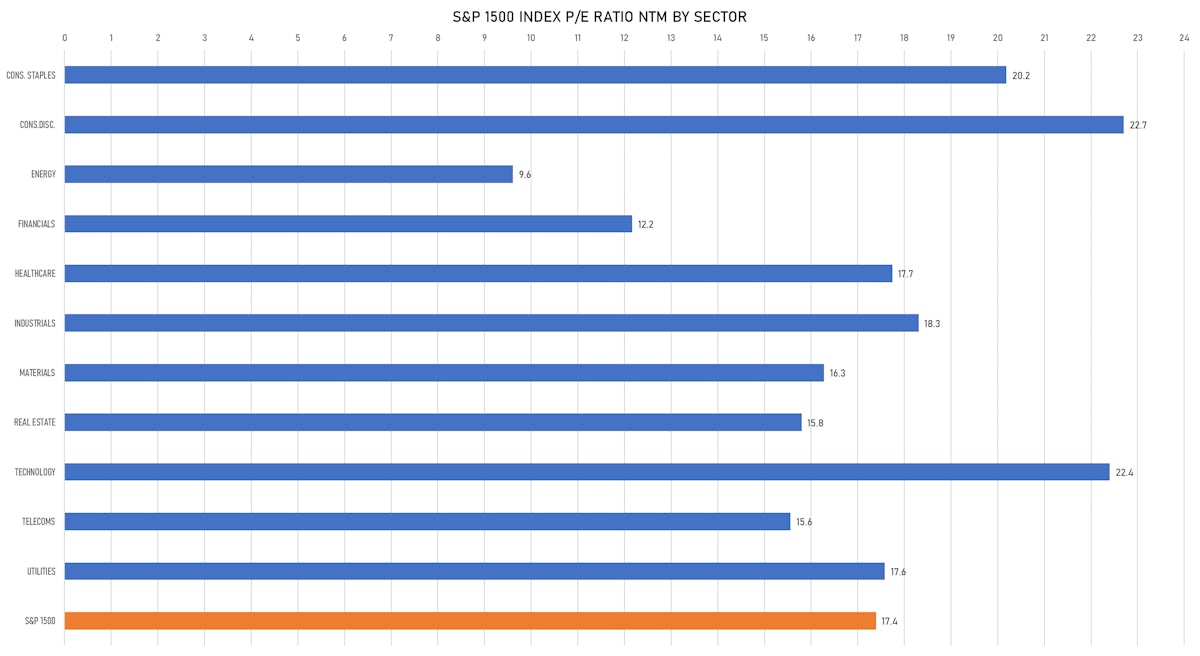
VALUATION MULTIPLES BY SECTORS
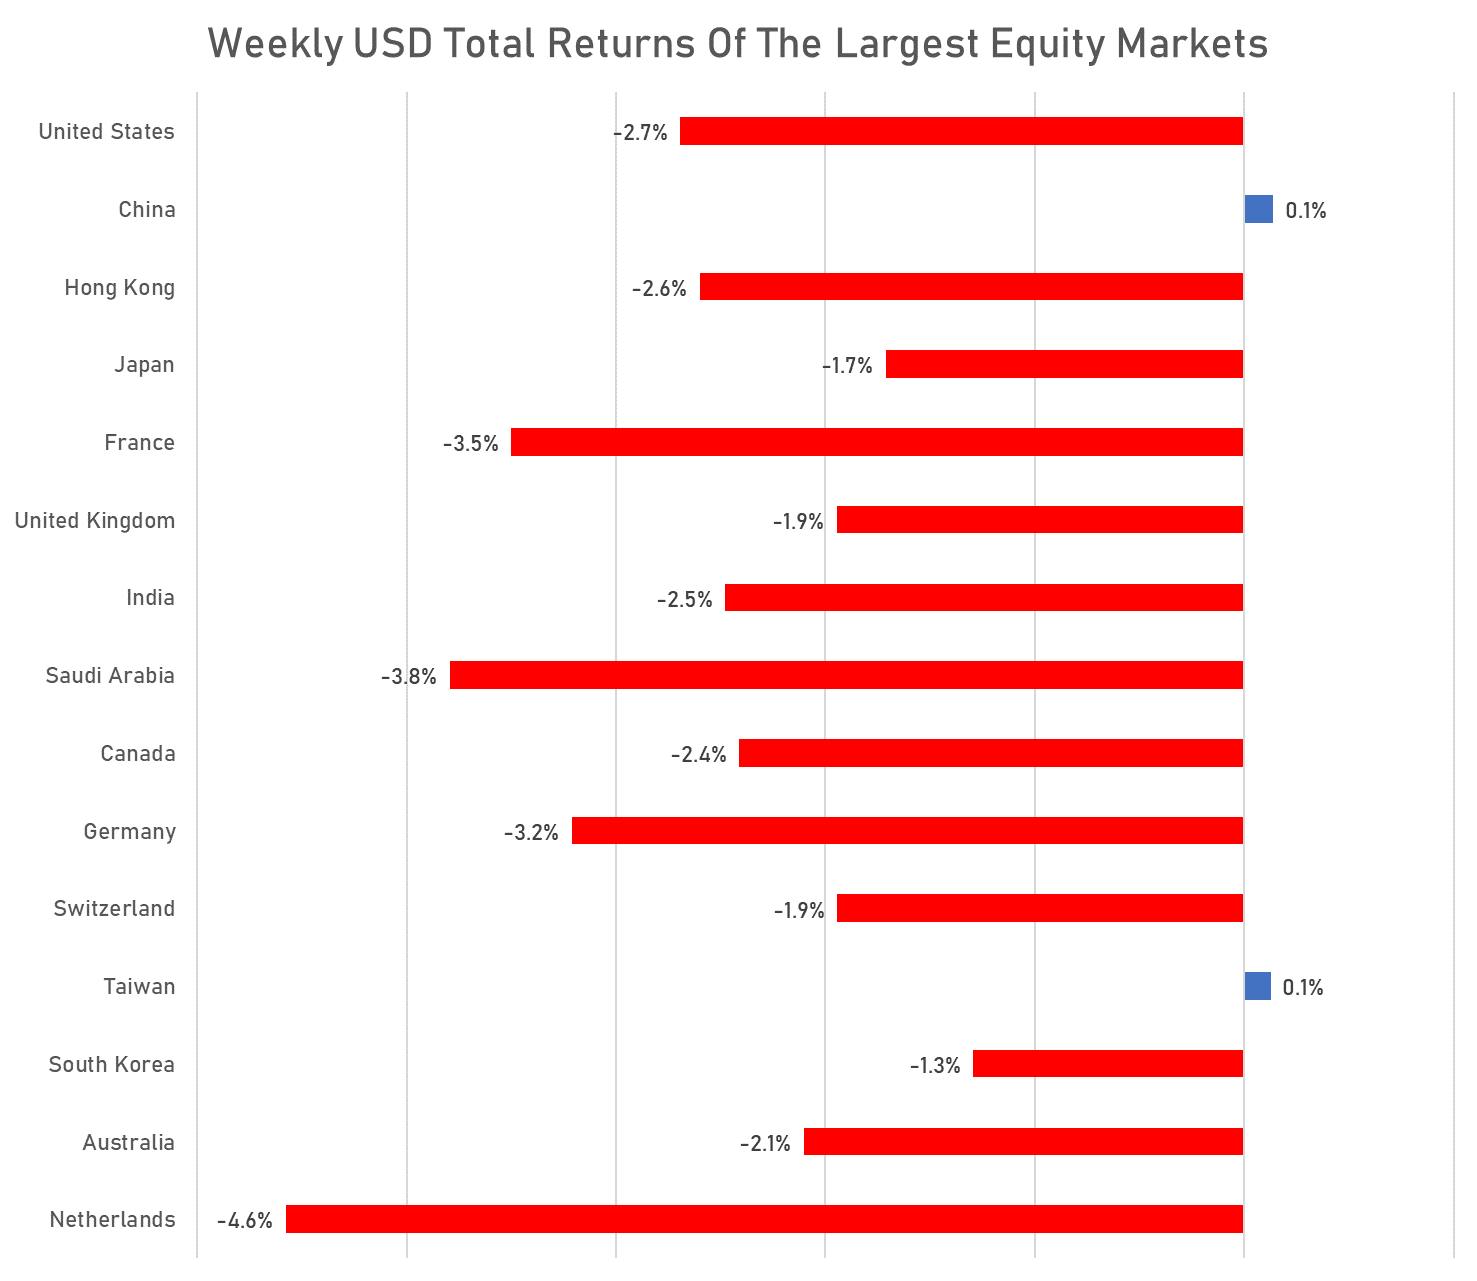
WEEKLY TOTAL RETURNS OF MAJOR GLOBAL EQUITY MARKETS
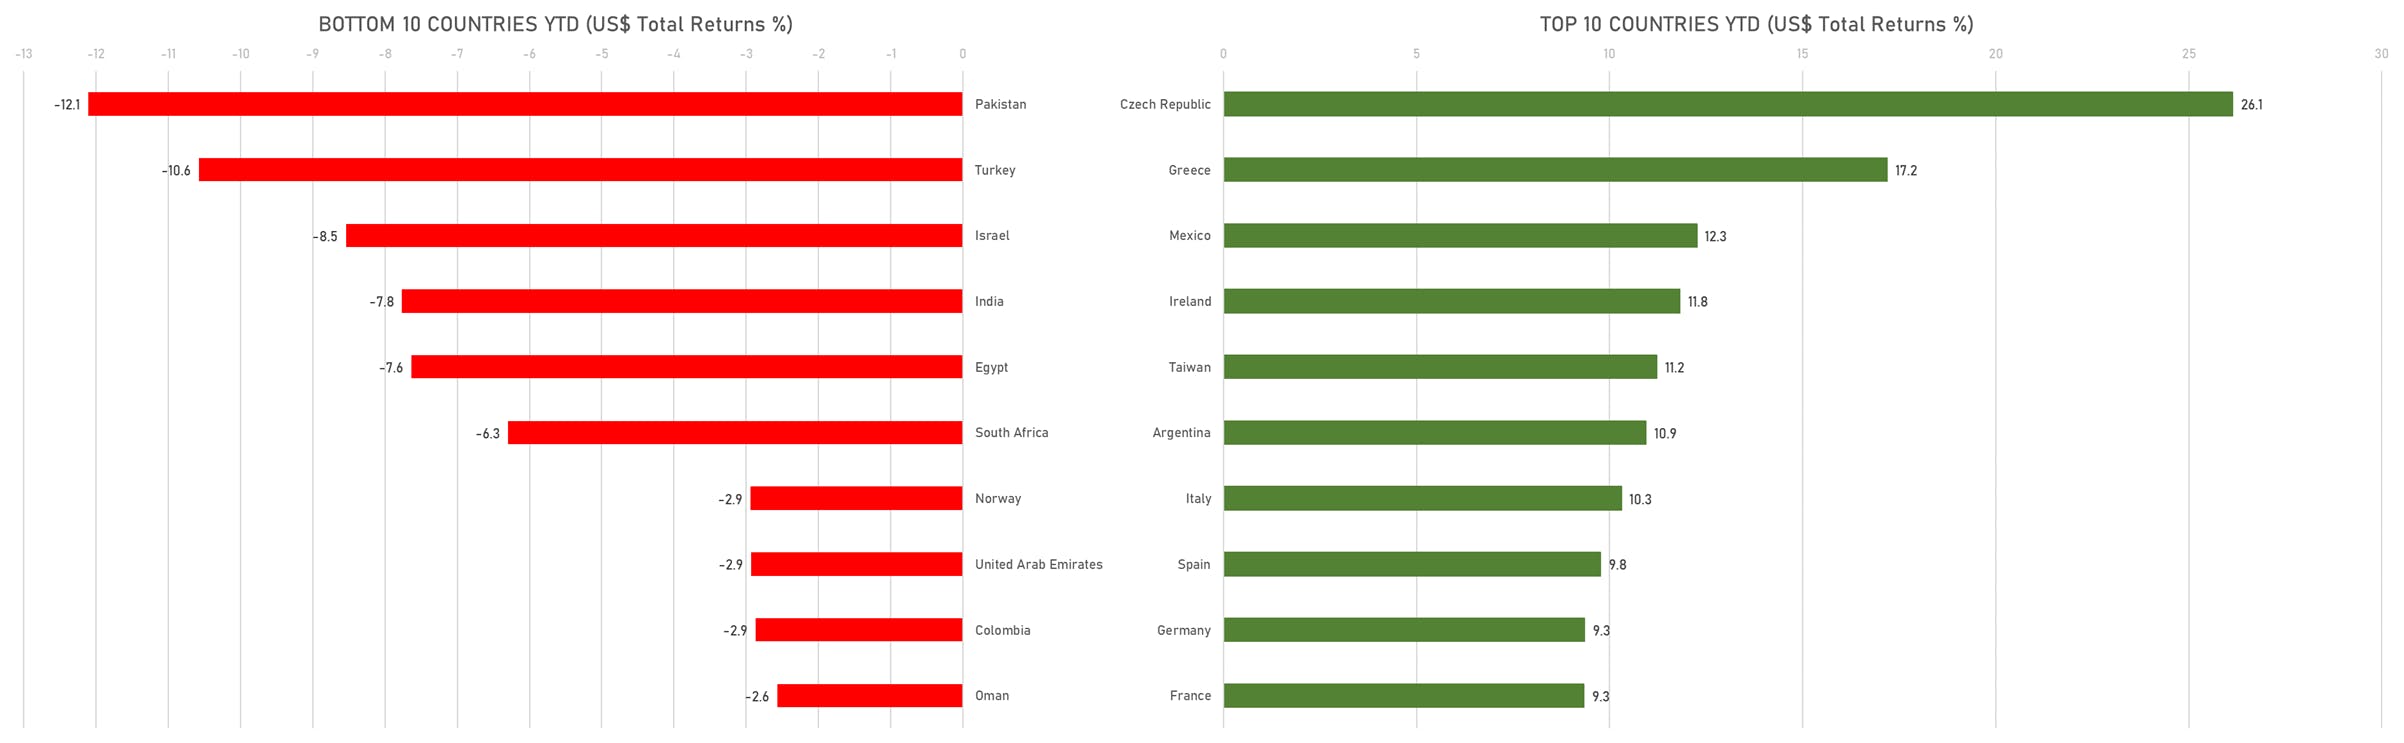
TOP / BOTTOM PERFORMING WORLD MARKETS YTD
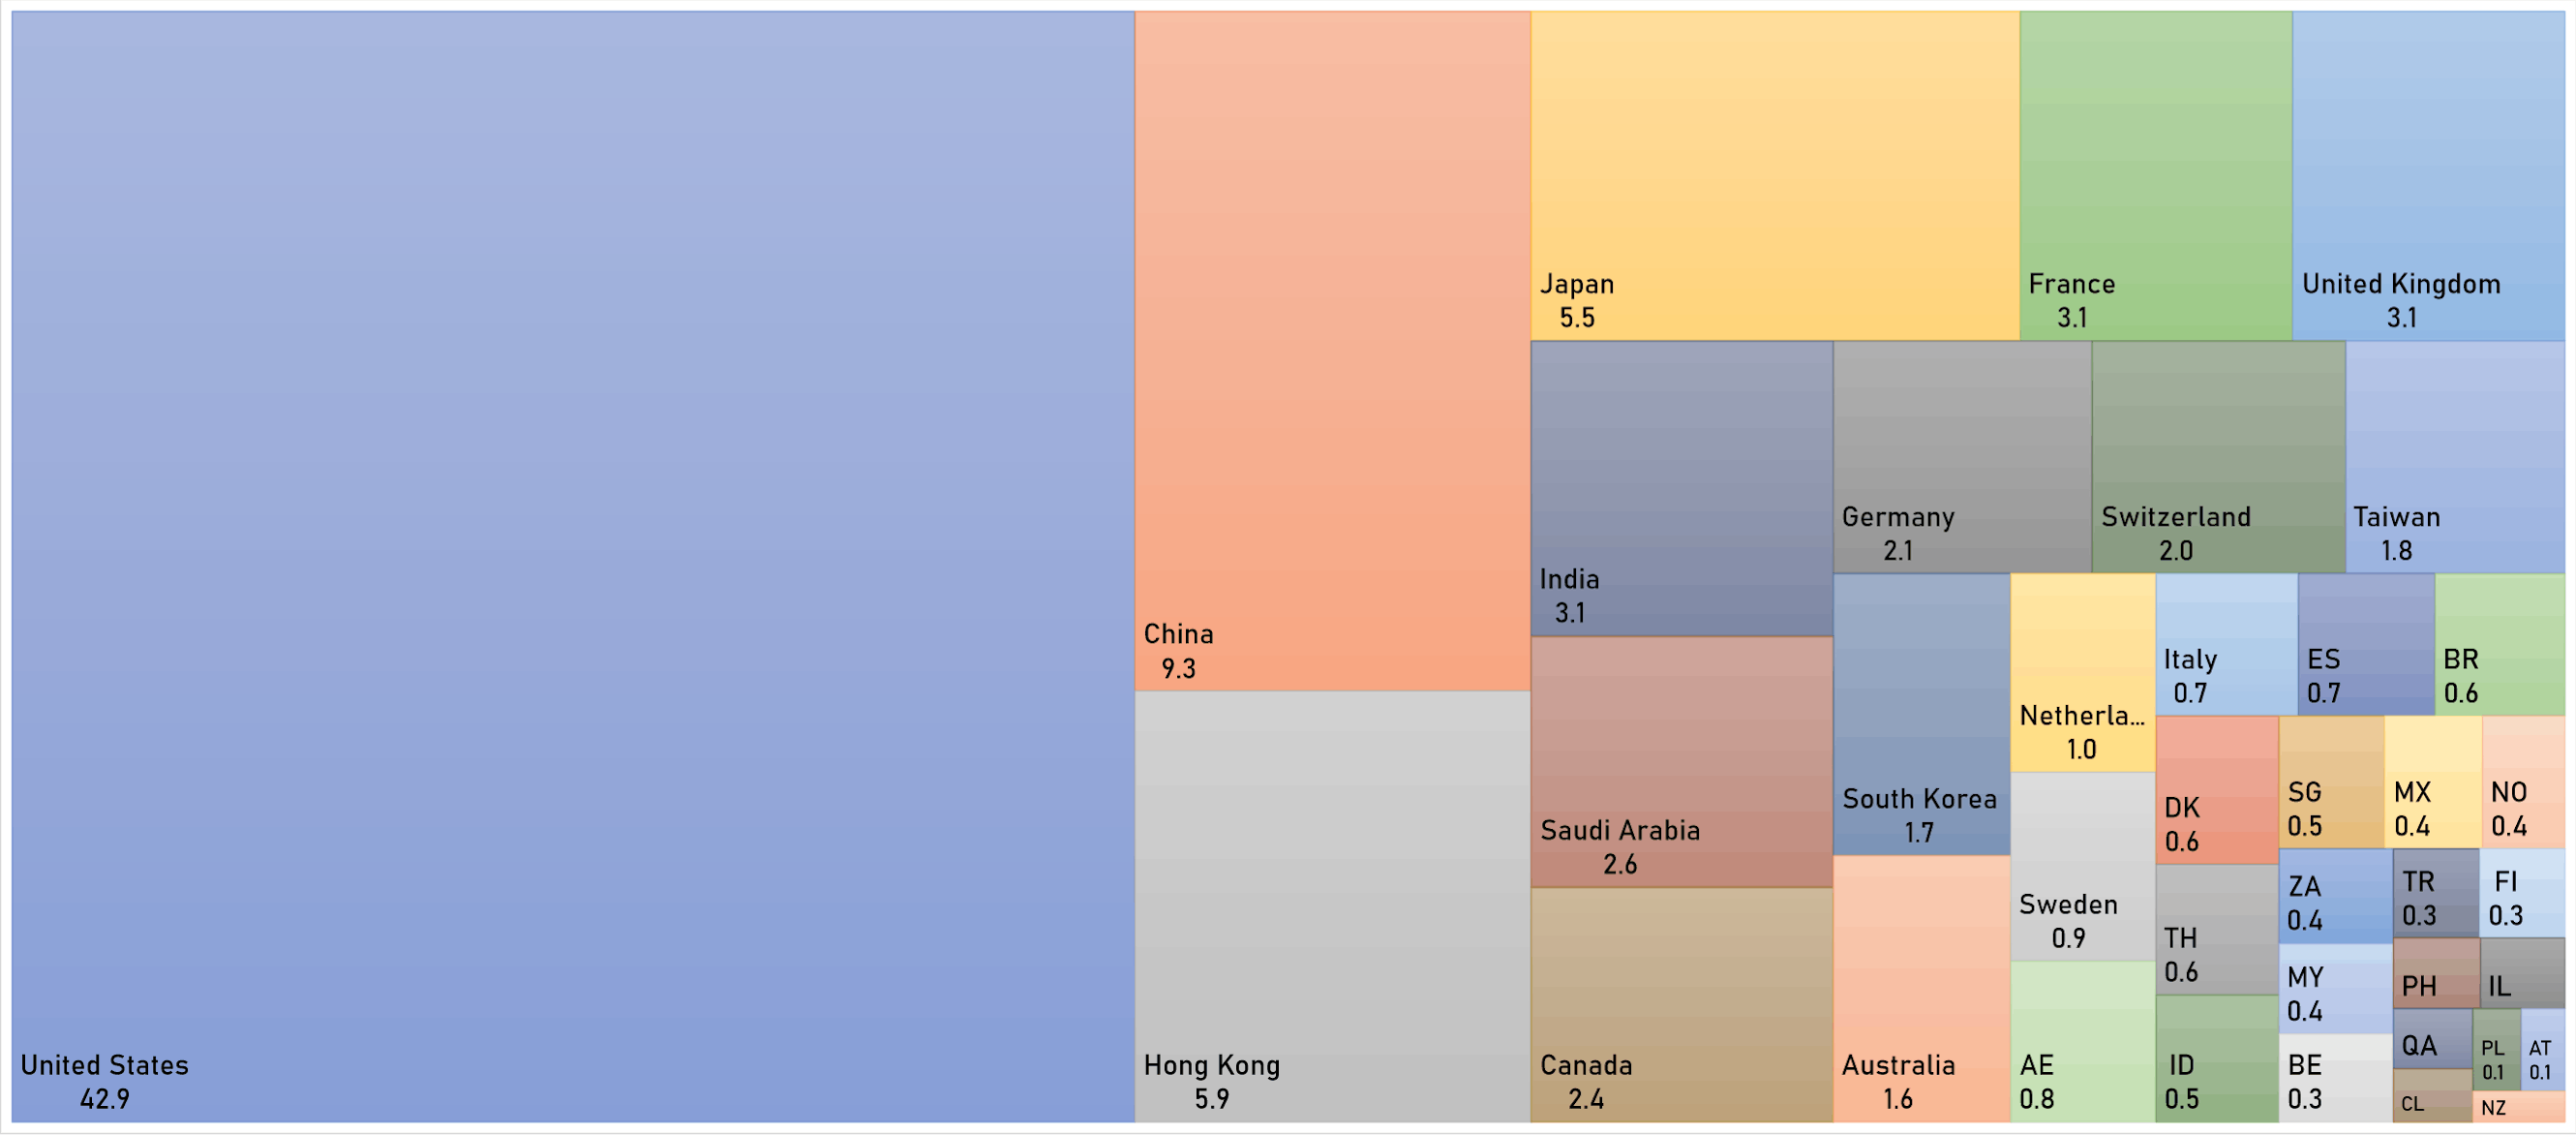
WORLD MARKET CAPITALIZATION (US$ Trillion)