Equities
US Equities Had A Difficult Week As Powell And Regional Financials Provide One-Two Punch
The speed at which things got out of hand with SVB is the worry for US regional banks, with short-term implied volatility on financials getting a little panicky while the broader market stays relatively calm
Published ET
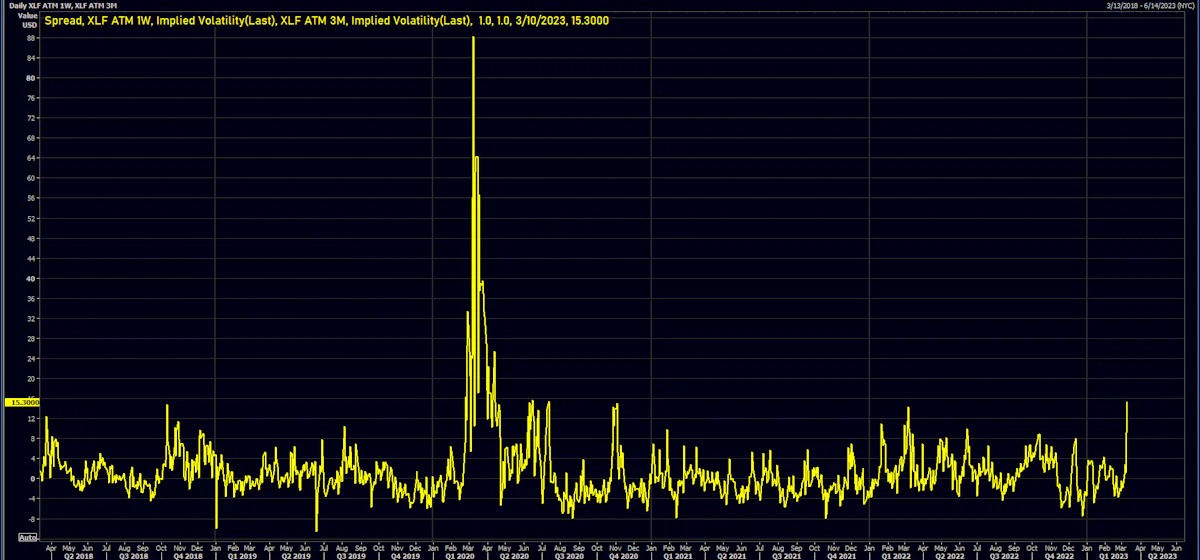
XLF 1-Week / 3-Month Implied Volatility Spread | Source: Refinitiv
DAILY SUMMARY
- Daily performance of US indices: S&P 500 down -1.45%; Nasdaq Composite down -1.76%; Wilshire 5000 down -1.26%
- 7.8% of S&P 500 stocks were up today, with 41.2% of stocks above their 200-day moving average (DMA) and 16.9% above their 50-DMA
- Top performing sectors in the S&P 500: consumer staples down -0.46% and healthcare down -0.74%
- Bottom performing sectors in the S&P 500: real estate down -3.25% and materials down -2.15%
- The number of shares in the S&P 500 traded today was 837m for a total turnover of US$ 74 bn
- The S&P 500 Value Index Index was down -1.5%, while the S&P 500 Growth Index Index was down -1.4%; the S&P small caps index was down -2.7% and mid caps were down -3.1%
- The volume on CME's INX (S&P 500 Index) was 3238.5m (3-month z-score: 1.7); the 3-month average volume is 2410.6m and the 12-month range is 903.0 - 5089.5m
- Daily performance of international indices: Europe Stoxx 600 down -1.35%; UK FTSE 100 down -1.67%; Hang Seng SH-SZ-HK 300 Index down -2.08%; Japan's TOPIX 500 down -1.93%
VOLATILITY TODAY
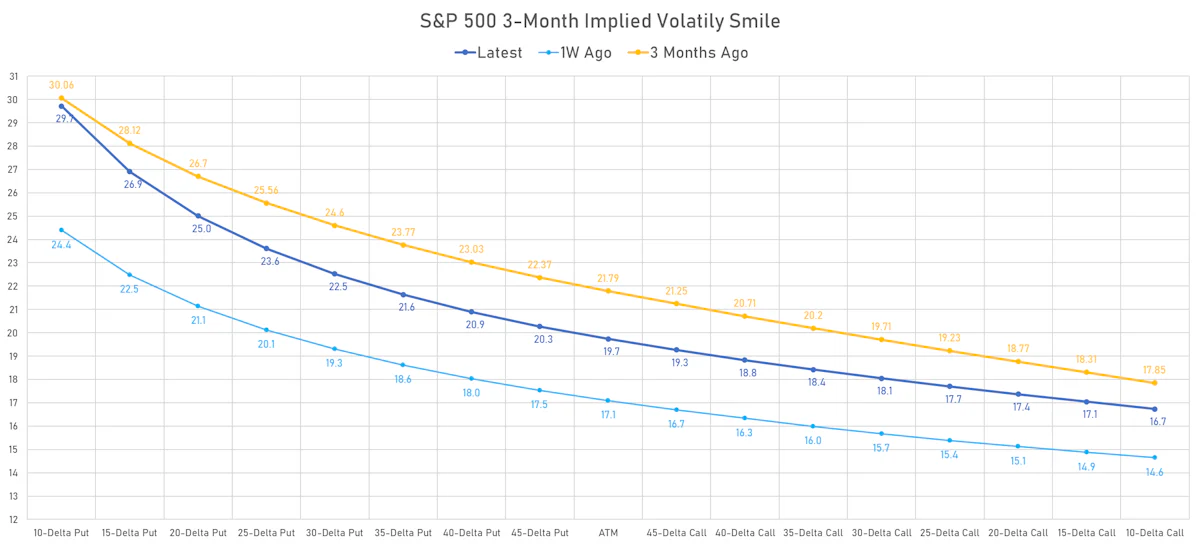
- 3-month at-the-money implied volatility on the S&P 500 at 19.7%, up from 19.2%
- 3-month at-the-money implied volatility on the STOXX Europe 600 at 15.5%, up from 13.1%
TOP WINNERS TODAY
- Solo Brands Inc (DTC), up 21.2% to $5.49 / YTD price return: +47.6% / 12-Month Price Range: $ 3.39-10.74 / Short interest (% of float): 19.7%; days to cover: 9.1
- RLX Technology Inc (RLX), up 15.1% to $2.52 / YTD price return: +9.6% / 12-Month Price Range: $ 0.90-3.06 / Short interest (% of float): 4.7%; days to cover: 2.1
- Playstudios Inc (MYPS), up 14.4% to $3.97 / YTD price return: +2.3% / 12-Month Price Range: $ 3.24-6.60 / Short interest (% of float): 1.8%; days to cover: 6.7
- Mondee Holdings Inc (MOND), up 11.4% to $10.86 / YTD price return: -0.2% / 12-Month Price Range: $ 6.74-16.98 / Short interest (% of float): 0.4%; days to cover: 1.3
- Industrias Bachoco SAB de CV (IBA), up 10.7% to $59.58 / YTD price return: +16.8% / 12-Month Price Range: $ 37.17-59.58 / Short interest (% of float): 0.0%; days to cover: 0.1
- Hci Group Inc (HCI), up 10.4% to $58.17 / YTD price return: +46.9% / 12-Month Price Range: $ 27.65-73.92 / Short interest (% of float): 22.2%; days to cover: 12.5
- IAA Inc (IAA), up 10.4% to $41.51 / YTD price return: +3.8% / 12-Month Price Range: $ 31.50-44.07 / Short interest (% of float): 7.3%; days to cover: 3.3
- Ambrx Biopharma Inc (AMAM), up 9.2% to $9.69 / YTD price return: +326.9% / 12-Month Price Range: $ 0.38-13.07 / Short interest (% of float): 4.3%; days to cover: 0.3 (the stock is currently on the short sale restriction list)
- Churchill Capital V Corp (CCV), up 9.2% to $11.00 / YTD price return: +10.7% / 12-Month Price Range: $ 9.75-11.00 / Short interest (% of float): 0.0%; days to cover: 0.1
- EVI Industries Inc (EVI), up 9.1% to $20.48 / YTD price return: -14.2% / 12-Month Price Range: $ 7.25-26.92
BIGGEST LOSERS TODAY
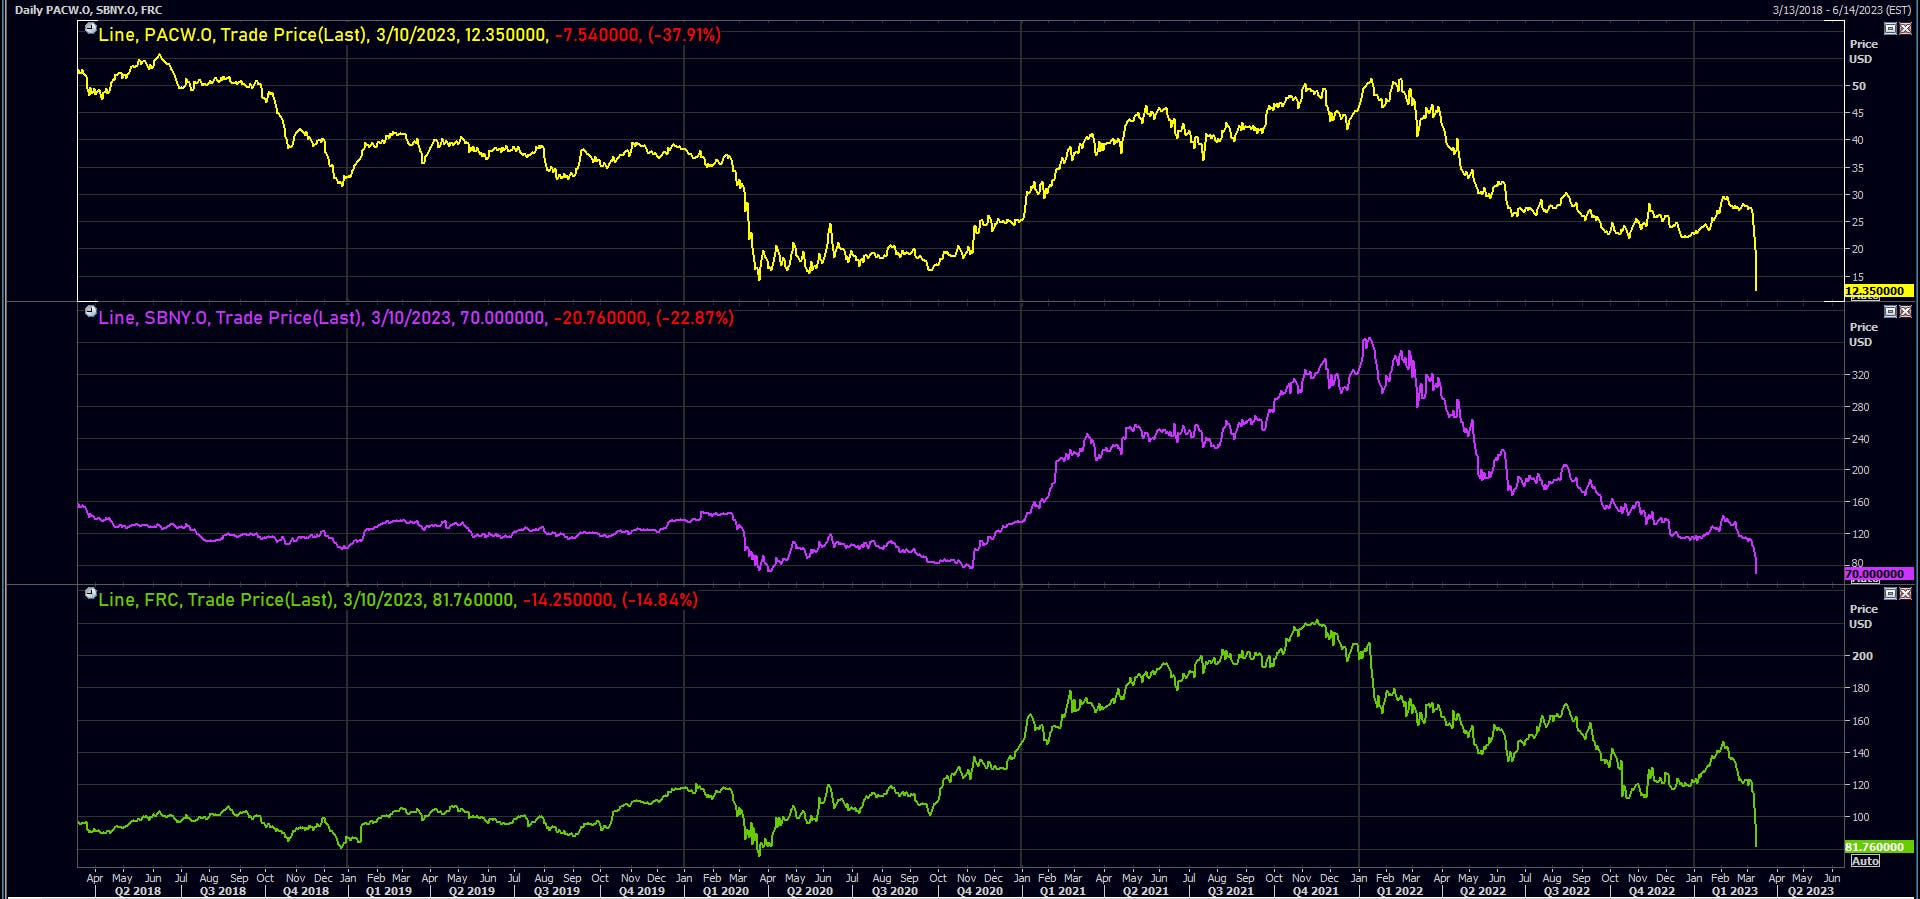
- PacWest Bancorp (PACW), down 37.9% to $12.35 / YTD price return: -46.2% / 12-Month Price Range: $ 12.35-46.84 / Short interest (% of float): 3.6%; days to cover: 2.7 (the stock is currently on the short sale restriction list)
- Meihua International Medical Technologies Co Ltd (MHUA), down 33.3% to $15.12 / YTD price return: +82.6% / 12-Month Price Range: $ 2.60-45.49 / Short interest (% of float): 0.5%; days to cover: 1.2 (the stock is currently on the short sale restriction list)
- Ocean Biomedical Inc (OCEA), down 24.2% to $8.00 / YTD price return: -23.1% / 12-Month Price Range: $ 3.06-26.60 / Short interest (% of float): 3.5%; days to cover: 0.1 (the stock is currently on the short sale restriction list)
- CareMax Inc (CMAX), down 23.2% to $3.01 / YTD price return: -17.5% / 12-Month Price Range: $ 2.77-9.23 / Short interest (% of float): 7.5%; days to cover: 13.8 (the stock is currently on the short sale restriction list)
- Signature Bank (SBNY), down 22.9% to $70.00 / YTD price return: -39.2% / 12-Month Price Range: $ 70.00-328.88 / Short interest (% of float): 6.1%; days to cover: 3.1 (the stock is currently on the short sale restriction list)
- DocuSign Inc (DOCU), down 22.9% to $49.69 / YTD price return: -10.3% / 12-Month Price Range: $ 39.57-113.67 / Short interest (% of float): 4.9%; days to cover: 2.6 (the stock is currently on the short sale restriction list)
- Western Alliance Bancorp (WAL), down 20.9% to $49.34 / YTD price return: -17.2% / 12-Month Price Range: $ 49.34-89.26 / Short interest (% of float): 2.5%; days to cover: 2.7 (the stock is currently on the short sale restriction list)
- Vigil Neuroscience Inc (VIGL), down 20.1% to $9.50 / YTD price return: -24.0% / 12-Month Price Range: $ 2.18-16.77 / Short interest (% of float): 1.3%; days to cover: 28.0 (the stock is currently on the short sale restriction list)
- Tyra Biosciences Inc (TYRA), down 19.9% to $12.08 / YTD price return: +58.9% / 12-Month Price Range: $ 4.93-15.25 / Short interest (% of float): 3.1%; days to cover: 18.7 (the stock is currently on the short sale restriction list)
- Poseida Therapeutics Inc (PSTX), down 18.8% to $4.10 / YTD price return: -22.6% / 12-Month Price Range: $ 1.82-8.82 / Short interest (% of float): 4.9%; days to cover: 4.9 (the stock is currently on the short sale restriction list)
TOP S&P 500 PERFORMERS THIS WEEK
- General Electric Co (GE), up 5.3% to $91.00 / YTD price return: +39.2% / 12-Month Price Range: $ 46.77-94.94 / Short interest (% of float): 1.2%; days to cover: 2.0
- Arista Networks Inc (ANET), up 4.1% to $146.46 / YTD price return: +20.7% / 12-Month Price Range: $ 89.13-152.03 / Short interest (% of float): 1.3%; days to cover: 1.3
- Intel Corp (INTC), up 3.1% to $27.22 / YTD price return: +3.0% / 12-Month Price Range: $ 24.59-52.51 / Short interest (% of float): 1.7%; days to cover: 1.5
- Chipotle Mexican Grill Inc (CMG), up 2.7% to $1,550.71 / YTD price return: +11.7% / 12-Month Price Range: $ 1,196.95-1,752.15 / Short interest (% of float): 3.1%; days to cover: 2.7
- Kroger Co (KR), up 2.4% to $47.10 / YTD price return: +5.7% / 12-Month Price Range: $ 41.82-62.77 / Short interest (% of float): 2.2%; days to cover: 3.6
- DR Horton Inc (DHI), up 1.4% to $94.10 / YTD price return: +5.6% / 12-Month Price Range: $ 59.26-104.14 / Short interest (% of float): 5.1%; days to cover: 5.2
- Advanced Micro Devices Inc (AMD), up 1.4% to $82.67 / YTD price return: +27.6% / 12-Month Price Range: $ 54.58-125.66 / Short interest (% of float): 2.1%; days to cover: 0.6
- CH Robinson Worldwide Inc (CHRW), up 1.3% to $102.32 / YTD price return: +11.8% / 12-Month Price Range: $ 86.63-121.23 / Short interest (% of float): 11.8%; days to cover: 7.8
- Merck & Co Inc (MRK), up 0.8% to $107.69 / YTD price return: -2.9% / 12-Month Price Range: $ 77.33-115.48 / Short interest (% of float): 0.8%; days to cover: 2.5
- Juniper Networks Inc (JNPR), up 0.4% to $30.80 / YTD price return: -3.6% / 12-Month Price Range: $ 25.18-38.14 / Short interest (% of float): 2.6%; days to cover: 2.0
BOTTOM S&P 500 PERFORMERS THIS WEEK
- SVB Financial Group (SIVB), down 62.7% to $.00 / YTD price return: -53.9% / 12-Month Price Range: $ .00-596.08 / Short interest (% of float): 5.4%; days to cover: 3.5
- Signature Bank (SBNY), down 38.4% to $70.00 / YTD price return: -39.2% / 12-Month Price Range: $ 70.00-328.82 / Short interest (% of float): 6.1%; days to cover: 3.1 (the stock is currently on the short sale restriction list)
- First Republic Bank (FRC), down 33.7% to $81.76 / YTD price return: -32.9% / 12-Month Price Range: $ 81.76-174.21 / Short interest (% of float): 2.8%; days to cover: 3.0 (the stock is currently on the short sale restriction list)
- Charles Schwab Corp (SCHW), down 24.2% to $58.70 / YTD price return: -29.5% / 12-Month Price Range: $ 58.70-93.14 / Short interest (% of float): 0.7%; days to cover: 1.3 (the stock is currently on the short sale restriction list)
- Lincoln National Corp (LNC), down 18.3% to $25.66 / YTD price return: -16.5% / 12-Month Price Range: $ 25.66-69.90 / Short interest (% of float): 4.1%; days to cover: 2.0
- Zions Bancorporation NA (ZION), down 18.0% to $40.35 / YTD price return: -17.9% / 12-Month Price Range: $ 40.35-71.17 / Short interest (% of float): 2.5%; days to cover: 2.4 (the stock is currently on the short sale restriction list)
- VF Corp (VFC), down 17.1% to $21.78 / YTD price return: -21.1% / 12-Month Price Range: $ 21.78-60.09 / Short interest (% of float): 5.7%; days to cover: 2.1
- Fifth Third Bancorp (FITB), down 16.2% to $30.37 / YTD price return: -7.4% / 12-Month Price Range: $ 30.37-48.03 / Short interest (% of float): 2.0%; days to cover: 2.6
- Truist Financial Corp (TFC), down 16.0% to $38.84 / YTD price return: -9.7% / 12-Month Price Range: $ 38.84-61.10 / Short interest (% of float): 1.1%; days to cover: 2.4
- Citizens Financial Group Inc (CFG), down 16.0% to $34.44 / YTD price return: -12.5% / 12-Month Price Range: $ 32.67-50.93 / Short interest (% of float): 2.2%; days to cover: 2.8
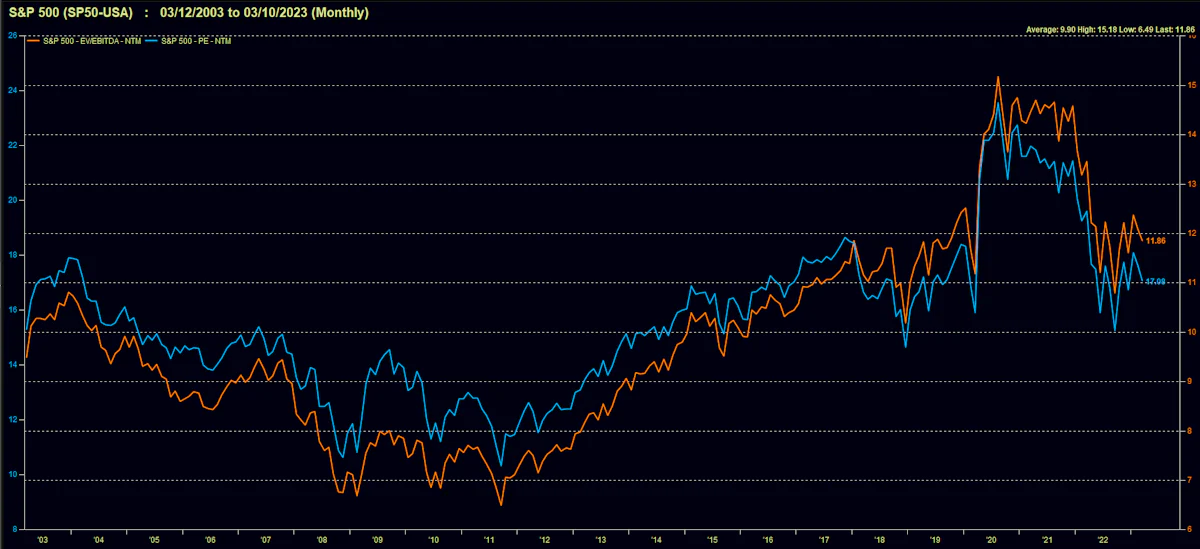
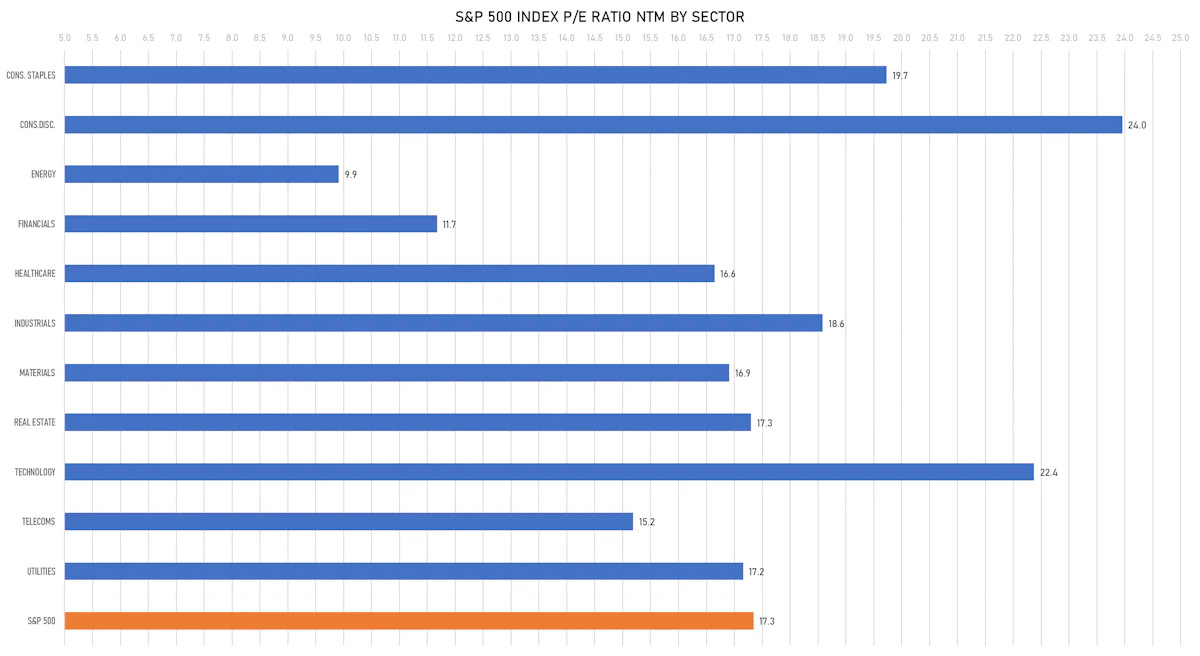
VALUATION MULTIPLES BY SECTORS
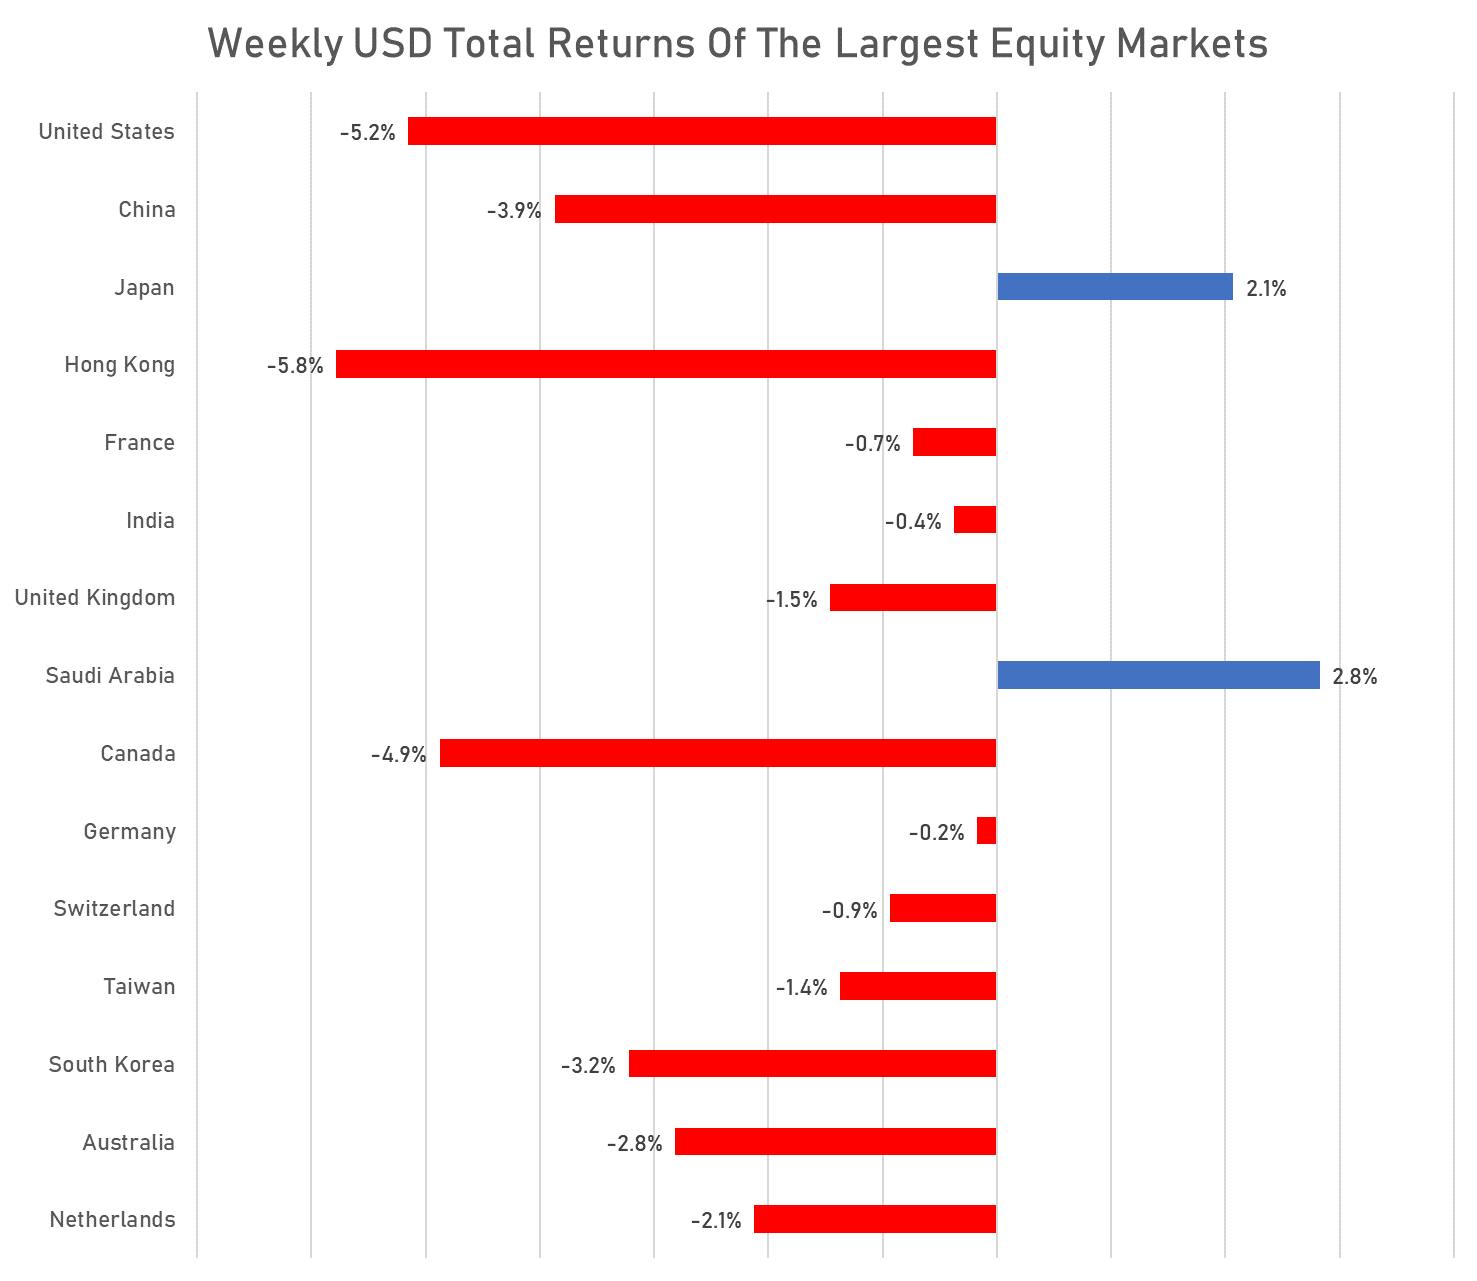
WEEKLY TOTAL RETURNS OF MAJOR GLOBAL EQUITY MARKETS
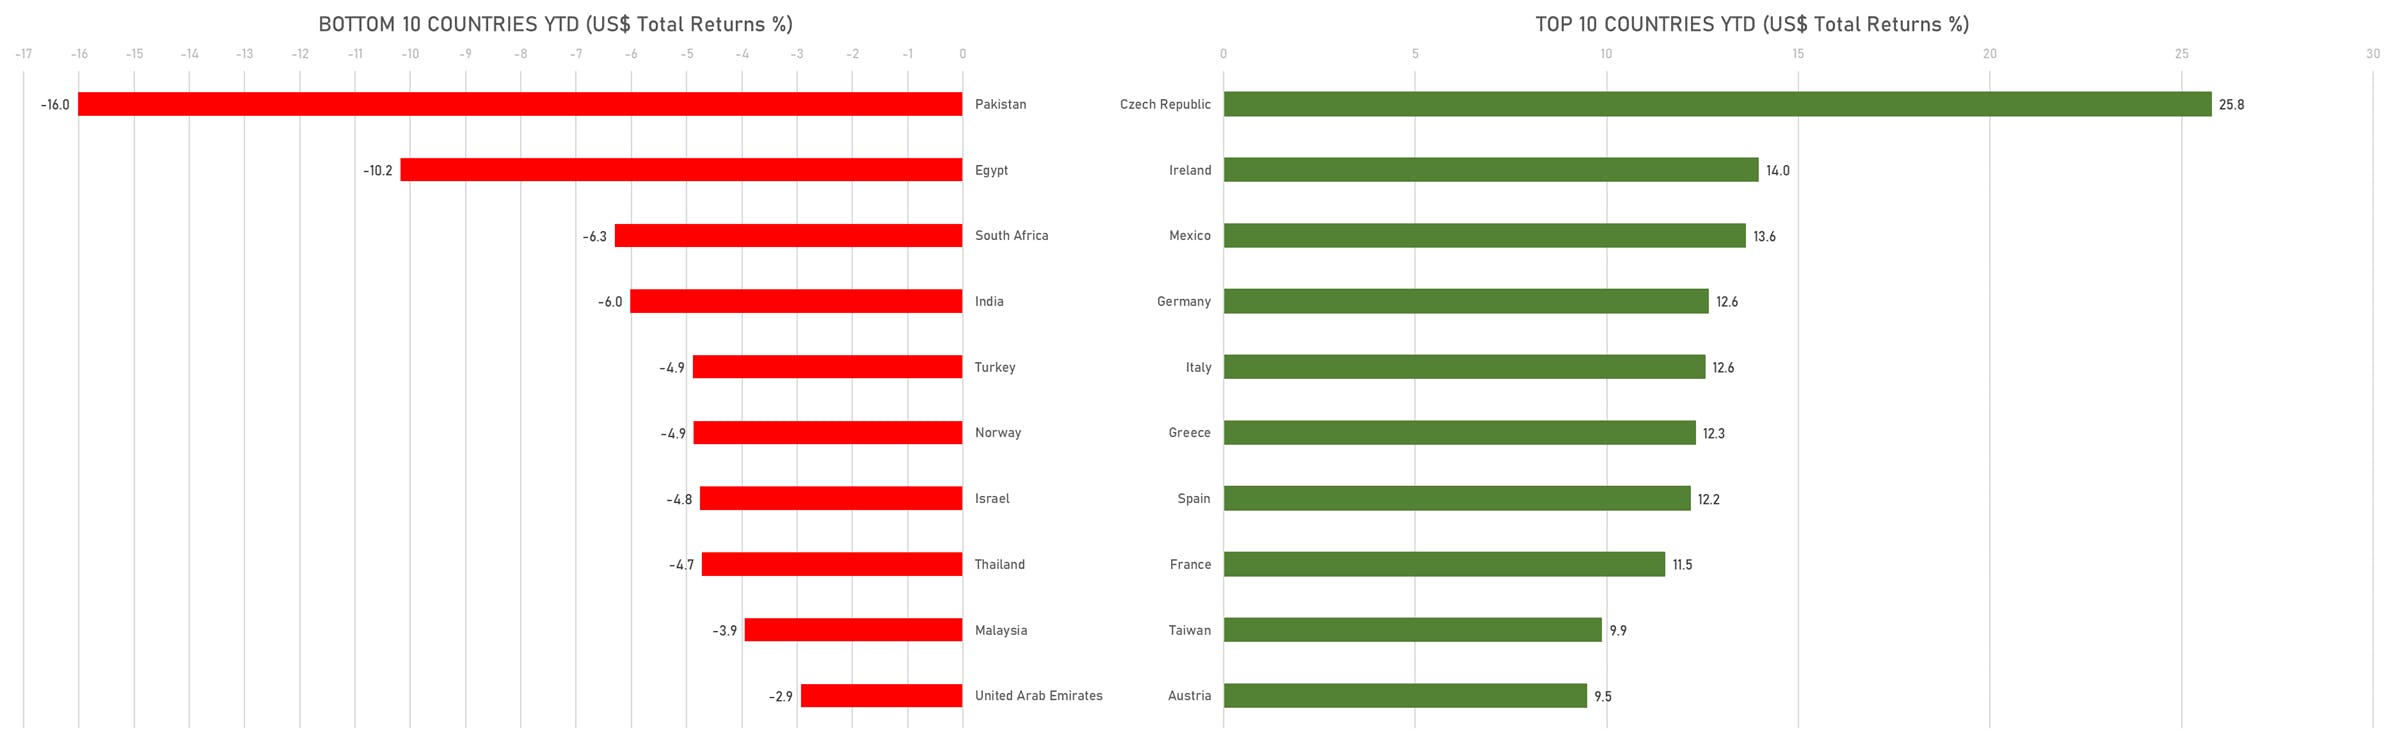
TOP / BOTTOM PERFORMING WORLD MARKETS YTD
WORLD MARKET CAPITALIZATION (US$ Trillion)
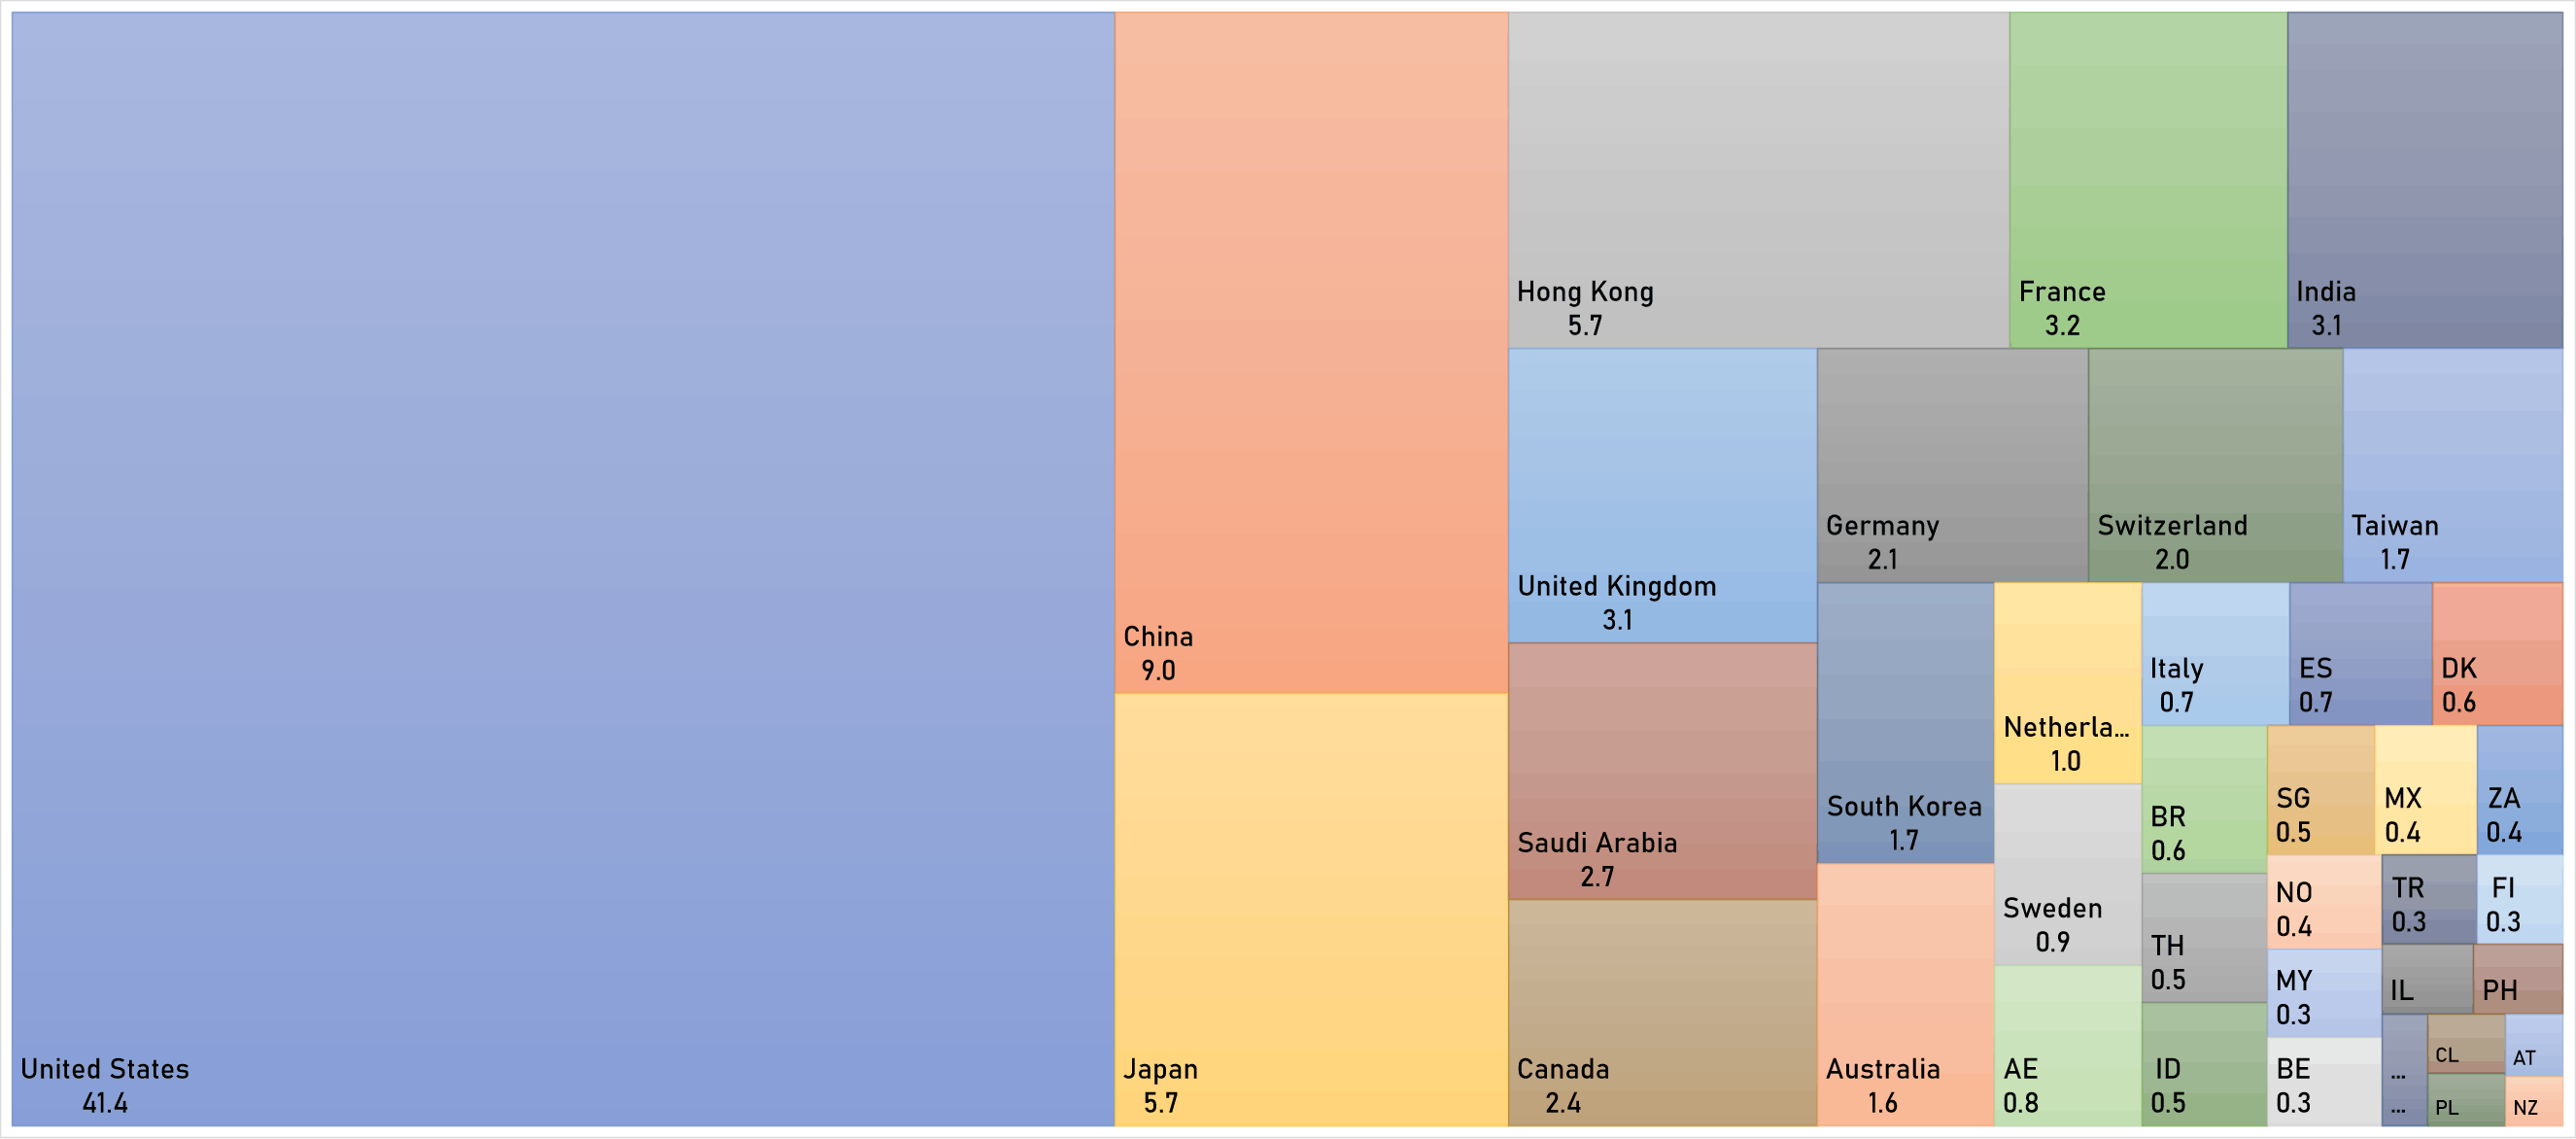
World market capitalization by country on 10 March 2023 (US$ trillion) | Sources: phipost.com, FactSet data